

Analzying historical commodity prices to identify trends
Benefits of analyzing historical commodity prices Historical commodity prices are a powerful tool for businesses across various industries. They provide insights into market trends, support financial planning, and enhance supply chain efficiency. By leveraging Vesper’s platform, businesses can access comprehensive historical data and make informed decisions that drive success. Start exploring historical commodity prices on Vesper today to gain a competitive edge in your market.
Understanding Long-Term Trends Historical commodity prices provide valuable insights into long-term market trends. By analysing data over several years, you businesses can identify pricing patterns and anomaliespredict future price movements. This is crucial for strategic planning and risk management. For example, a grain exporter can study past price trends to view patterns a forecast future prices and decide the best times to sell their produce.
Accurate Budget Forecasting Historical commodity prices are vital for accurate financial planning and budgeting. Businesses can use past data to forecast costs and set realistic budgets for future operations. This helps in avoiding unexpected expenses and ensures that financial plans are grounded in historical realities.
Optimizing Procurement Strategies Historical price data helps businesses optimise their procurement strategies. By understanding past price fluctuations, supply chain managers can make informed decisions on when to purchase raw materials and in what quantities, thereby improving efficiency and reducing costs.
Analyzing historical commodity prices: step-by-step
Whether you are looking for the price of a commodity a couple of days ago, or a year ago or more, you can find all this data in our two spot pricing widgets: Prices, and Price Comparison
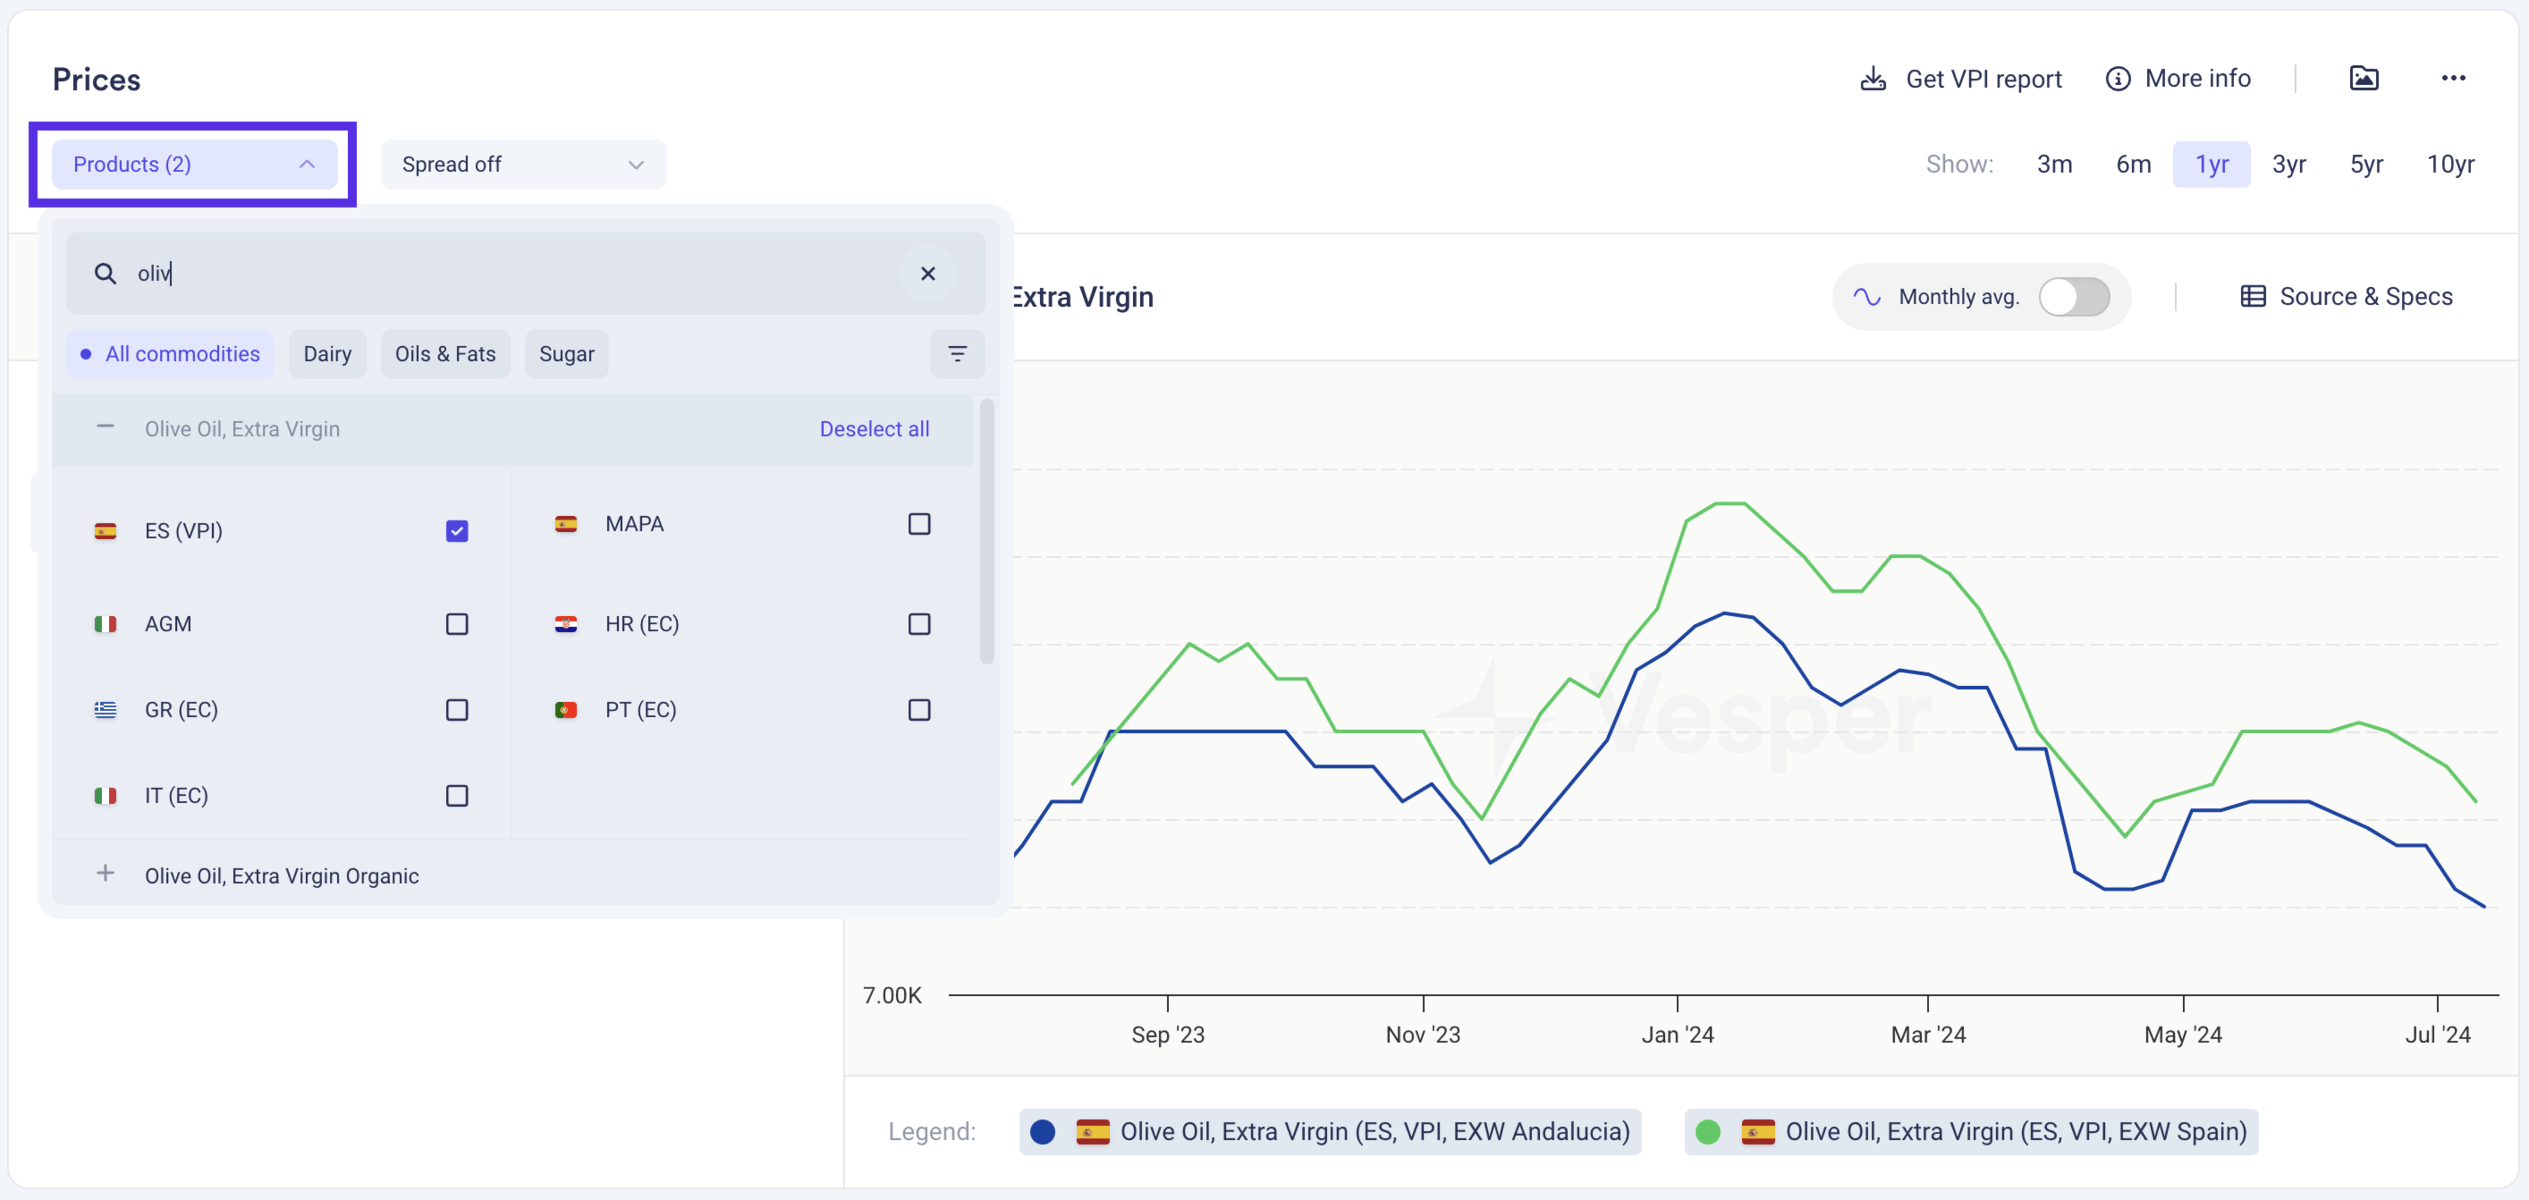
1. Find your product source
Use the product filter to find your product and source for which you want to check historical data.
2. Use filters to change the graph view
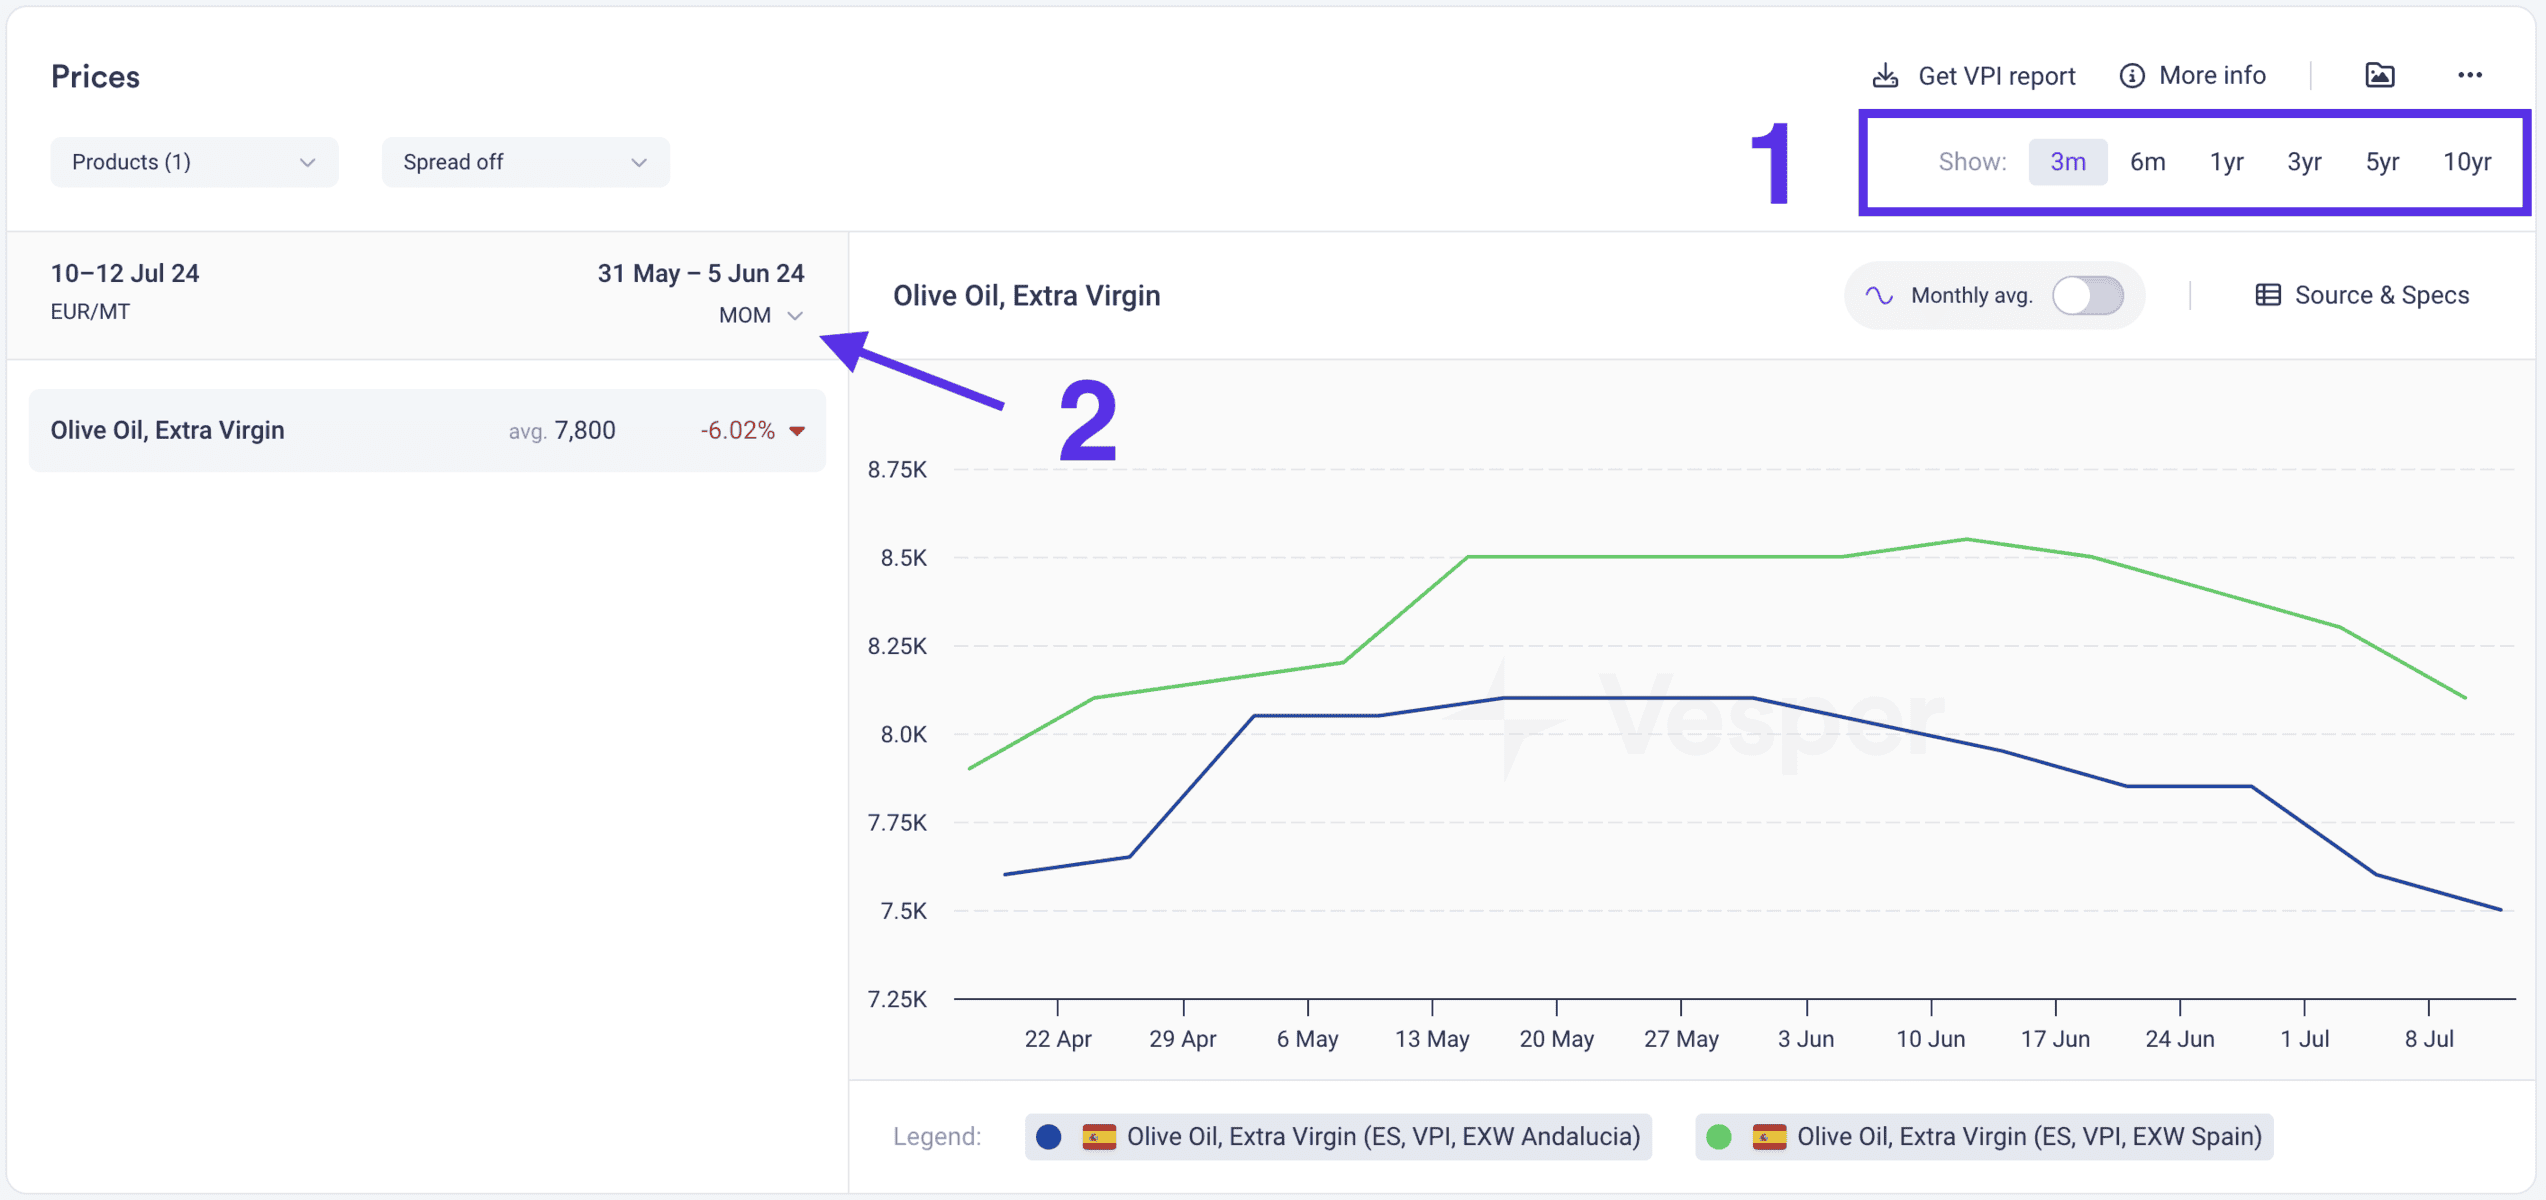
Your widget will now have two filter options to discover past commodity prices.
- Timespan Filter (screenshot action 1): Choose between 3 months, 6 months, 1 year, 3 years, 5 years and 10 years. This filter affects preiod visible on the chart. Note: How far the data tracks back depends on the original source and is not 10 years for every commodity.
- Table Filter (screenshot action 2): Choose between WOW (week over week), MOM (month over month), and YOY (year over year). This affects the percentage difference in table on the left side. This filter helps you to quickly compare current commodity prices to the previous period.
Use cases for analyzing historical pricing in different industries
Coffee Industry
In the coffee industry, understanding historical price trends is essential. Coffee prices are highly volatile and influenced by factors such as weather conditions, geopolitical events, and market demand. A coffee procurement manager can use historical price data to determine the best times to buy and sell, ensuring they maximise profits while minimising risks. By analysing past trends, they can also anticipate potential price spikes or drops, allowing for better inventory management.
FMCG Companies
An FMCGmanufacturing company relies on various raw materials like sugar, dairy, and grains. By analyzing historical prices of these commodities, the company can forecast future costs more accurately. For instance, if historical data shows that sugar prices typically rise during certain months, the company can budget for higher costs during those periods and adjust their procurement strategy accordingly, such as buying in bulk before price hikes.
Are you involved in buying, selling or trading commodities from different countries? Make use of commodity price comparisons to make smarter trading decisions..
Frequently asked questions
How far back does historical commodity price data go on Vesper?
You can view price history across several preset timespans, including 3 months, 6 months, 1 year, 3 years, 5 years, and 10 years. How far the data actually tracks back depends on the original source for that commodity, so it is not a full 10 years for every product. The available range is shown once you select your product and source.
What is the difference between the WOW, MOM, and YOY views when reviewing past prices?
These are table filters that set the period over which the percentage change is calculated. WOW compares week over week, MOM compares month over month, and YOY compares year over year. They let you quickly see how the current price moves against the previous period, which is useful for spotting short-term swings versus longer seasonal shifts in historical commodity prices.
How can historical prices help me budget and time my purchases?
Reviewing past prices lets you forecast costs against historical realities rather than guesswork, so budgets are more grounded and you avoid surprise expenses. Understanding past fluctuations also helps you decide when to buy and in what quantity. The article gives the example of an FMCG buyer purchasing in bulk ahead of a recurring seasonal price rise.
Why do procurement teams analyze long-term commodity price trends?
Looking at several years of data reveals pricing patterns and anomalies that one-off quotes hide, which supports strategic planning and risk management. A grain exporter can study past trends to anticipate the best times to sell, and a buyer can flag likely spikes or drops early. For cross-country sourcing, the article suggests pairing this with price comparisons for smarter decisions.