


Import & Export Data
Understand global trade lanes with import/export data
Simplify complex trade analysis with intuitive graphs and standardized metrics.
Let's get started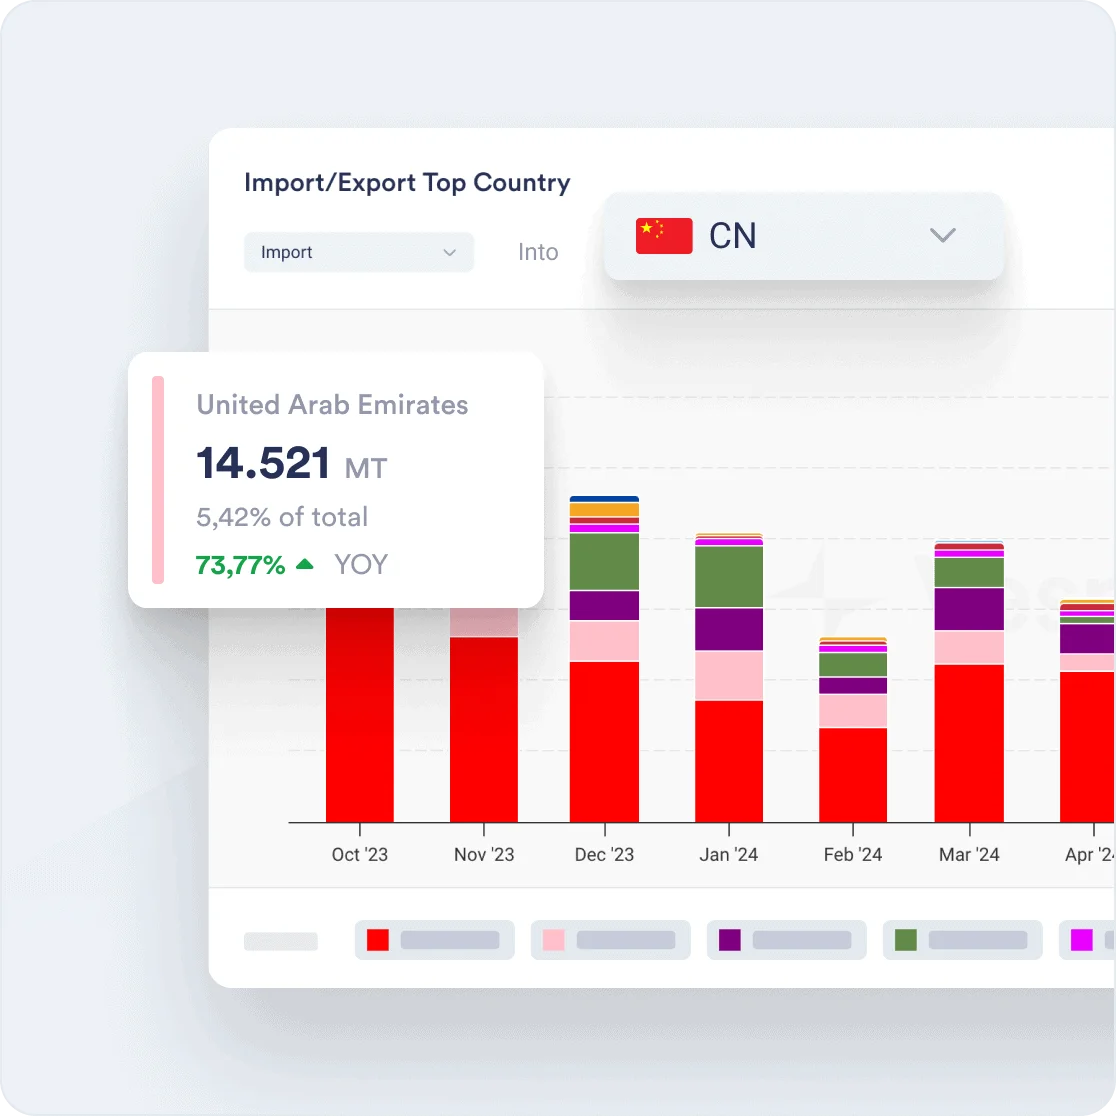
Our Users
Trusted by modern FMCG



















































Intuitive visualization tools for trade data
Bring import/export data to life with Vesper's intuitive graphs. From detailed tables to the top ten import/export country-to-country graph.
Customizable trade metrics
Easily switch between trade metrics like volume, value, and price, with options for MoM, YoY, and YTD comparisons.
Real-time vessel line-up data
Track real-time movements of vessels transporting agricultural commodities, offering insights into port arrivals, departures, and loading times.
Insights
Spot emerging market trends with comprehensive visualizations
Vesper consolidates thousands of global data points, including various HS codes, and transforms them into actionable insights through intuitive visualizations. Explore trade data with the Total Import/Export Graph, Import/Export Table, Country-to-Country Graph, and Top Country Graph, allowing for easy identification of trends, trade flows, and market opportunities. This comprehensive approach simplifies complex data, making it easier to spot emerging patterns and strategize effectively.
Start your free trial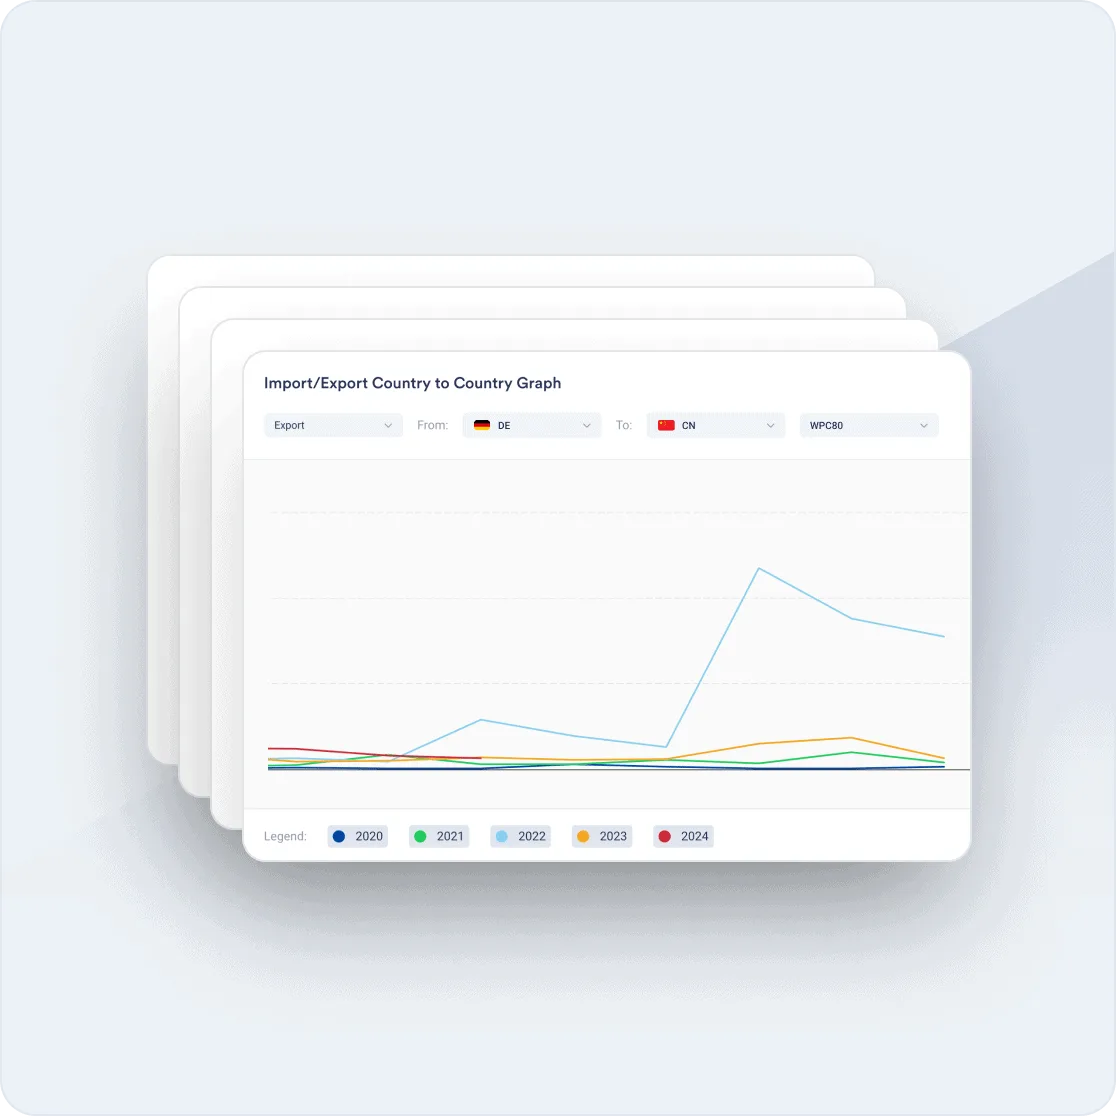
Comparability
Consistent trade metrics for seamless comparisons
Vesper standardizes diverse datasets, converting them into consistent trade metrics like volume, value, and price, with options for MoM, YoY, and YTD comparisons. This uniformity lets you toggle between different metrics effortlessly, facilitating quick and accurate comparisons across regions, timeframes, and product categories. Standardized metrics in one platform save time and enhance analytical precision, empowering you to make data-driven decisions confidently.
Get access now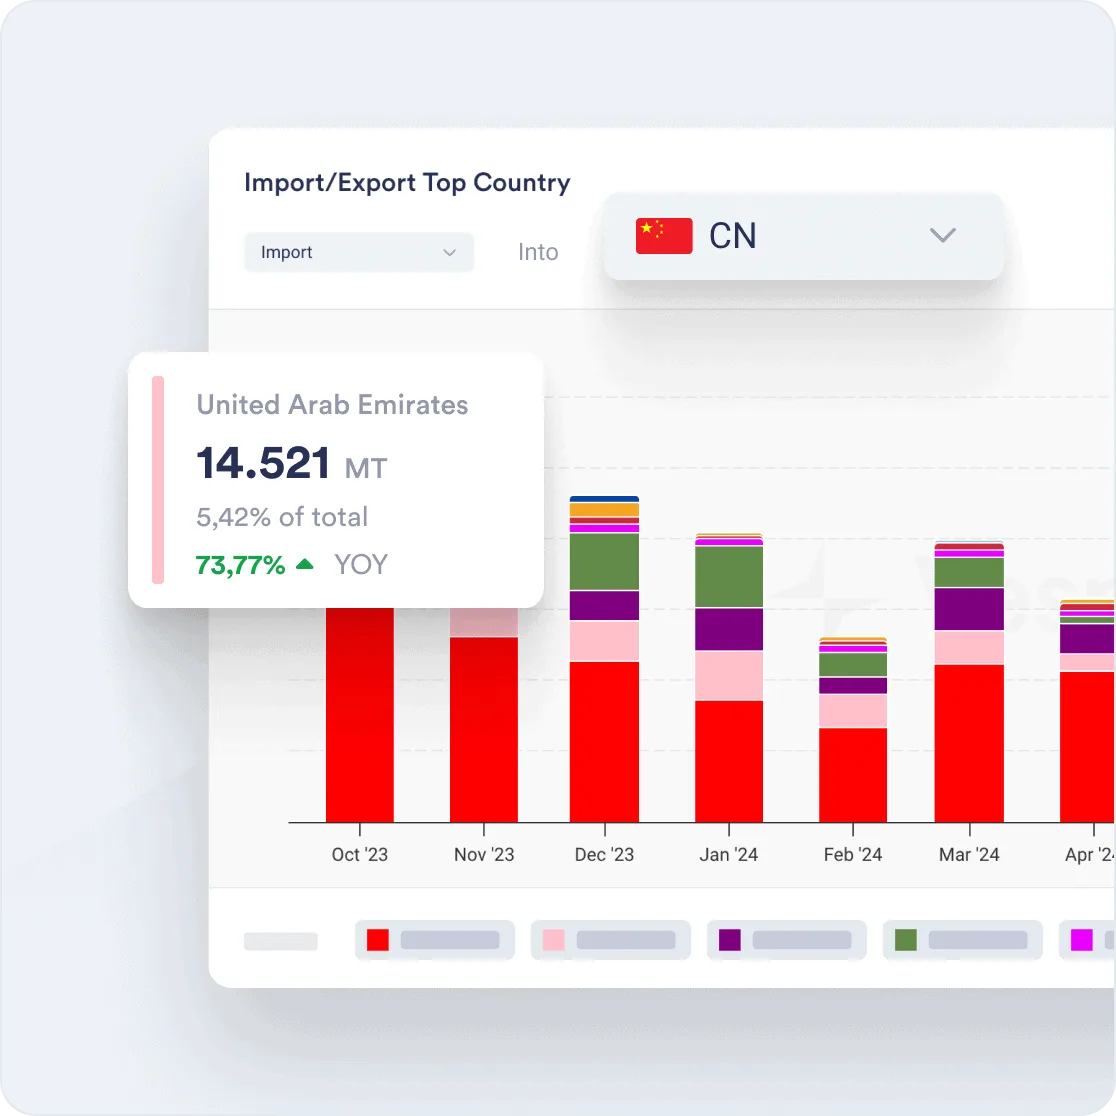
Your tour of the platform
Schedule your demo
Enter your work email and pick a time slot. We'll connect you with the right person.

Agility
Agile response to market changes
Our real-time vessel line-up data offers crucial insights into shipment origins, destinations, volumes, and schedules, updated far more frequently than traditional customs data. By accessing real-time information on shipments leaving ports, you can more accurately anticipate supply shifts and price movements, gaining a significant edge in decision-making. This allows for more agile supply chain adjustments, reducing delays and ensuring more effective responses to market fluctuations.
Test it yourself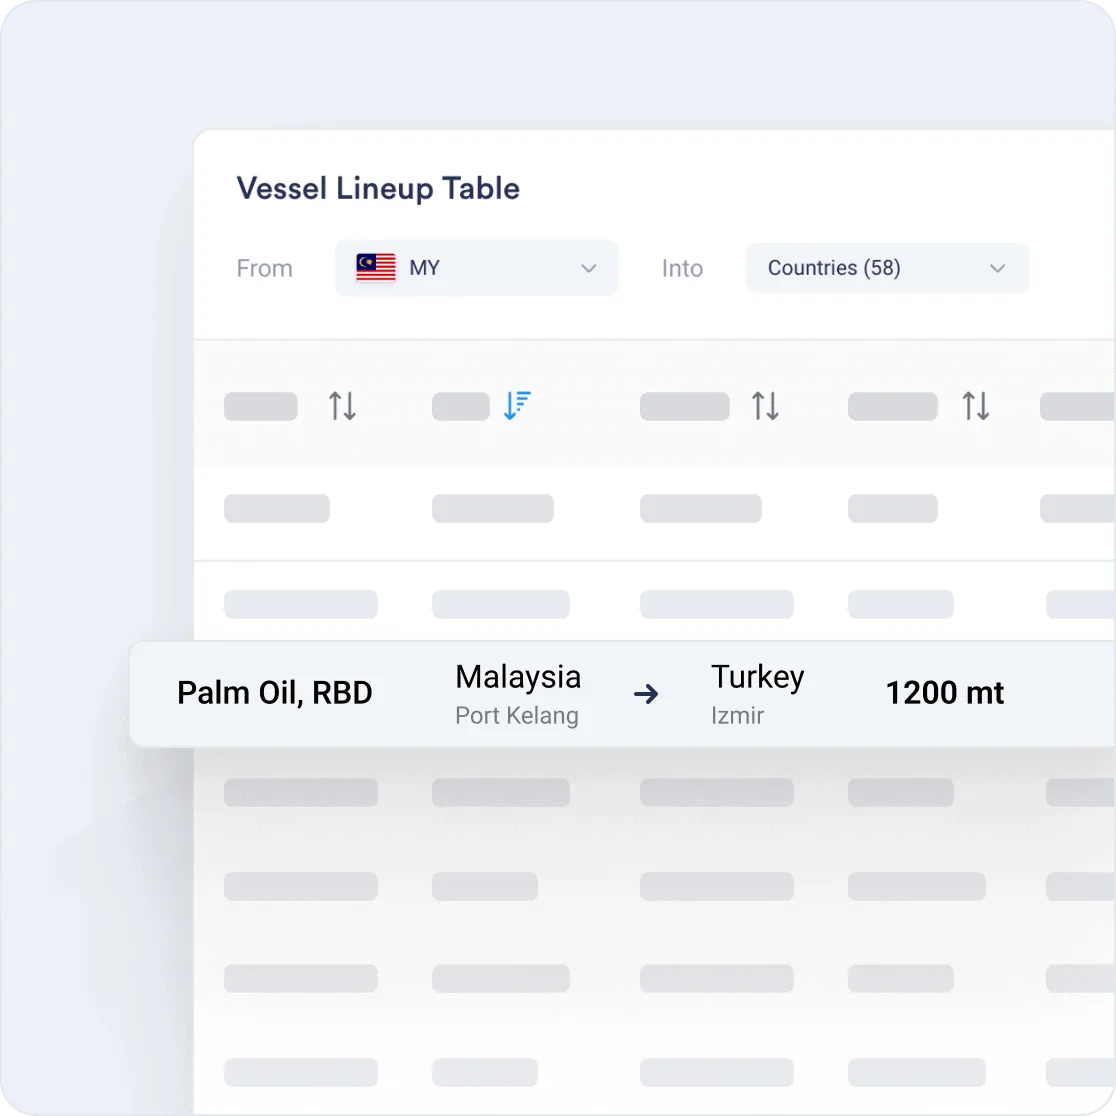
Niche Coverage
Access rare import/export data for specialized markets
Gain insights into niche commodities that are often difficult to source, including lesser-known but critical products like HVO, UCO, lauric oils, and other specialized oils and fats. This exclusive data gives businesses in specialized industries a competitive advantage, enabling them to strategically navigate their market segments.
Create your account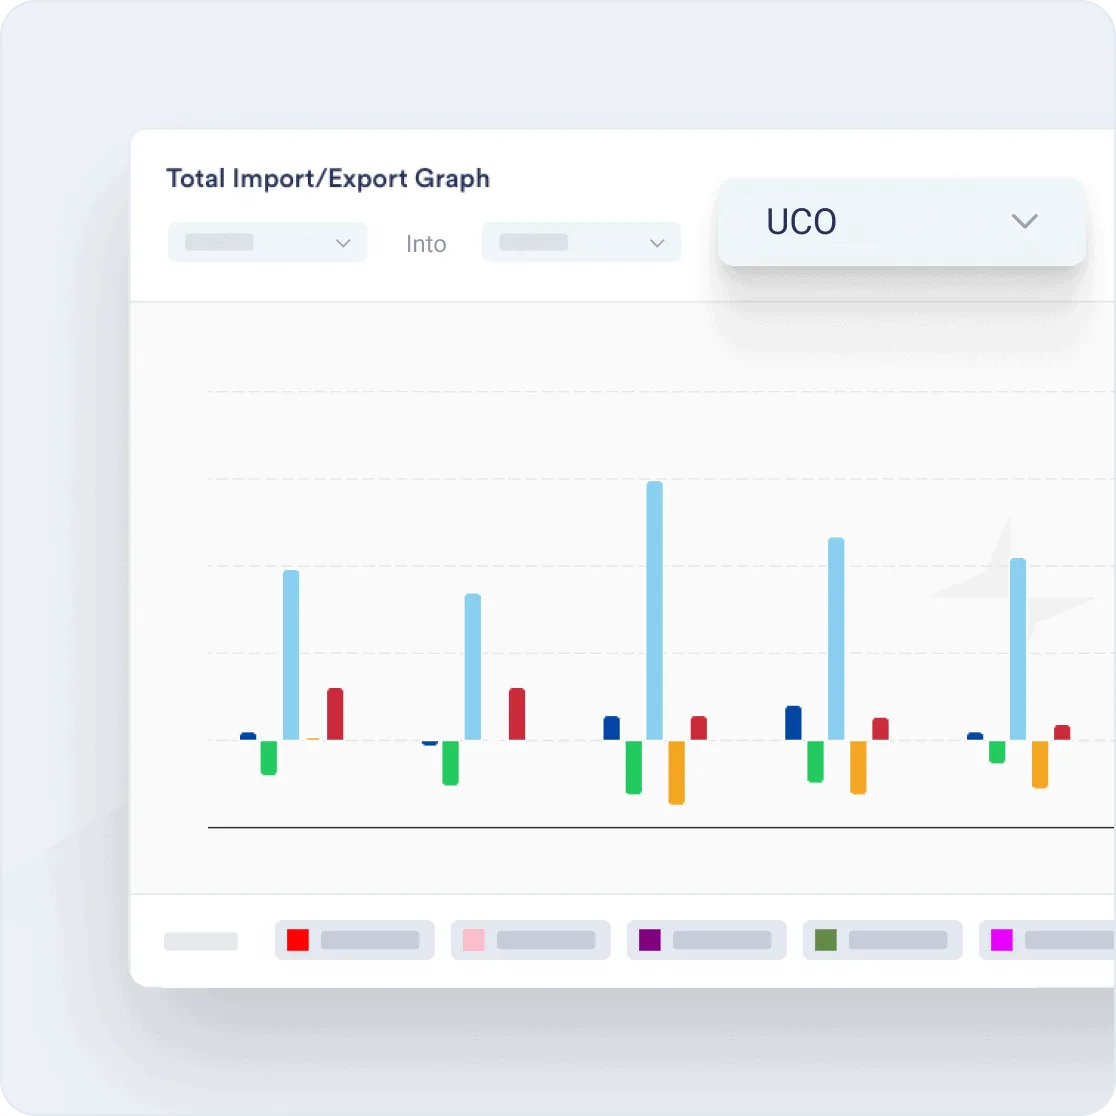
What we track
Coverage across 20+ commodity markets
20,000+ price series across every major ingredient and material category. If your team buys it, Vesper likely benchmarks it.
Grains & oilseeds
Soft commodities
Industrial & inputs







FAQ
Frequently Asked Questions
What import and export data does Vesper provide?
Vesper aggregates customs and trade data into clean, comparable series for volume, value, and price, across 150+ countries and various HS codes, with visualizations like the Total Import/Export Graph, Country-to-Country Graph, and Top Country Graph.
How often is trade data updated?
Customs-based import and export data refreshes as soon as official sources publish. Vesper also provides real-time vessel line-up data that updates far more frequently than traditional customs feeds.
What is vessel line-up data?
Vessel line-up data tracks real-time movements of ships transporting agricultural commodities, including port arrivals, departures, loading status, and ETAs. It gives you a leading indicator of supply shifts before official trade data is published.
Which HS codes do you cover?
Vesper covers a broad set of HS codes across the 20+ commodity markets on the platform, including niche oils and fats like HVO, UCO, lauric oils, and stearic acid that are difficult to track elsewhere.
Can I compare across regions, timeframes, and metrics?
Yes. Trade metrics are standardized so you can toggle between volume, value, and price with MoM, YoY, and YTD comparisons. Standardization means you can compare countries and timeframes directly without manual cleaning.