


Analytical Toolbox
Transforming data into actionable insights with Vesper's toolbox
Customize, visualize, and download your data as high-quality images, perfect for creating shareable reports or internal presentations. Every analytical tool you need, in one place.
Let's get started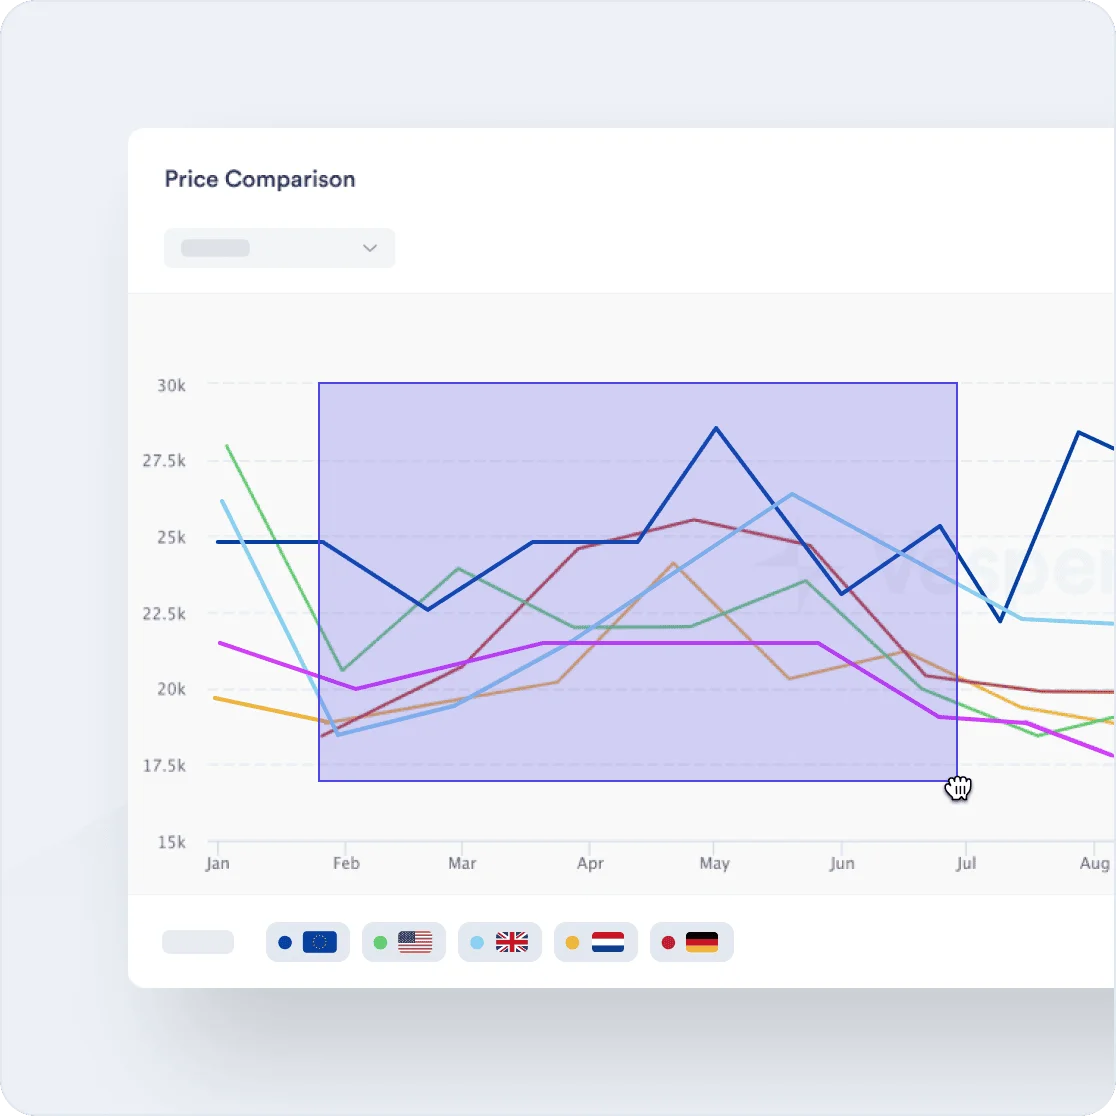
Our Users
Trusted by modern FMCG
Zoom in on time frames
Select any timeframe from 3 months to 10 years for precise market analysis. Use the click-and-drag feature to zoom in further, focusing down to a specific day within the selected period.
Generate price spreads and average lines
Create inter-commodity, intra-commodity, and geographical spreads with a single click, and calculate average price lines across any timeframe effortlessly.
Rename widgets and add notes
Organize your dashboard by renaming widgets and adding annotations directly to graphs to highlight key events or track trends.
Zoom
Analyze market movements in detail
Zooming in on specific time frames allows you to focus on precise market movements, whether it's a day, week, or year. This tool provides the granularity needed to track sudden price fluctuations or seasonal trends, helping you make informed decisions based on accurate, time-specific data.
Start your free trial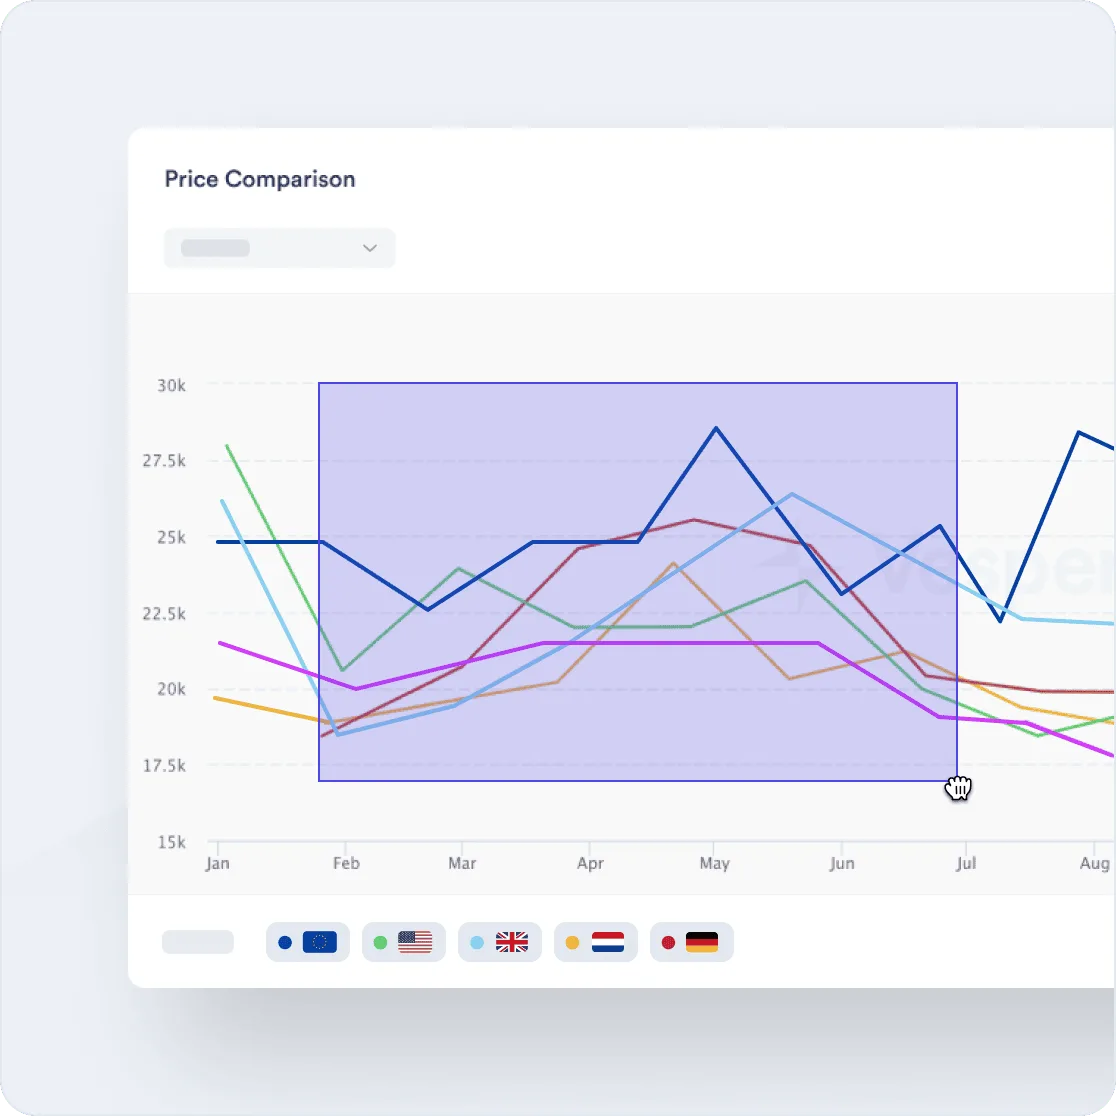
Spreads
Easily compare prices
Generate and customize price spreads across regions and commodities with a single click. Flip the spread direction to quickly shift from a negative to a positive benchmark, allowing you to evaluate the market from different perspectives and identify opportunities regardless of which price point you consider as your benchmark.
Get access now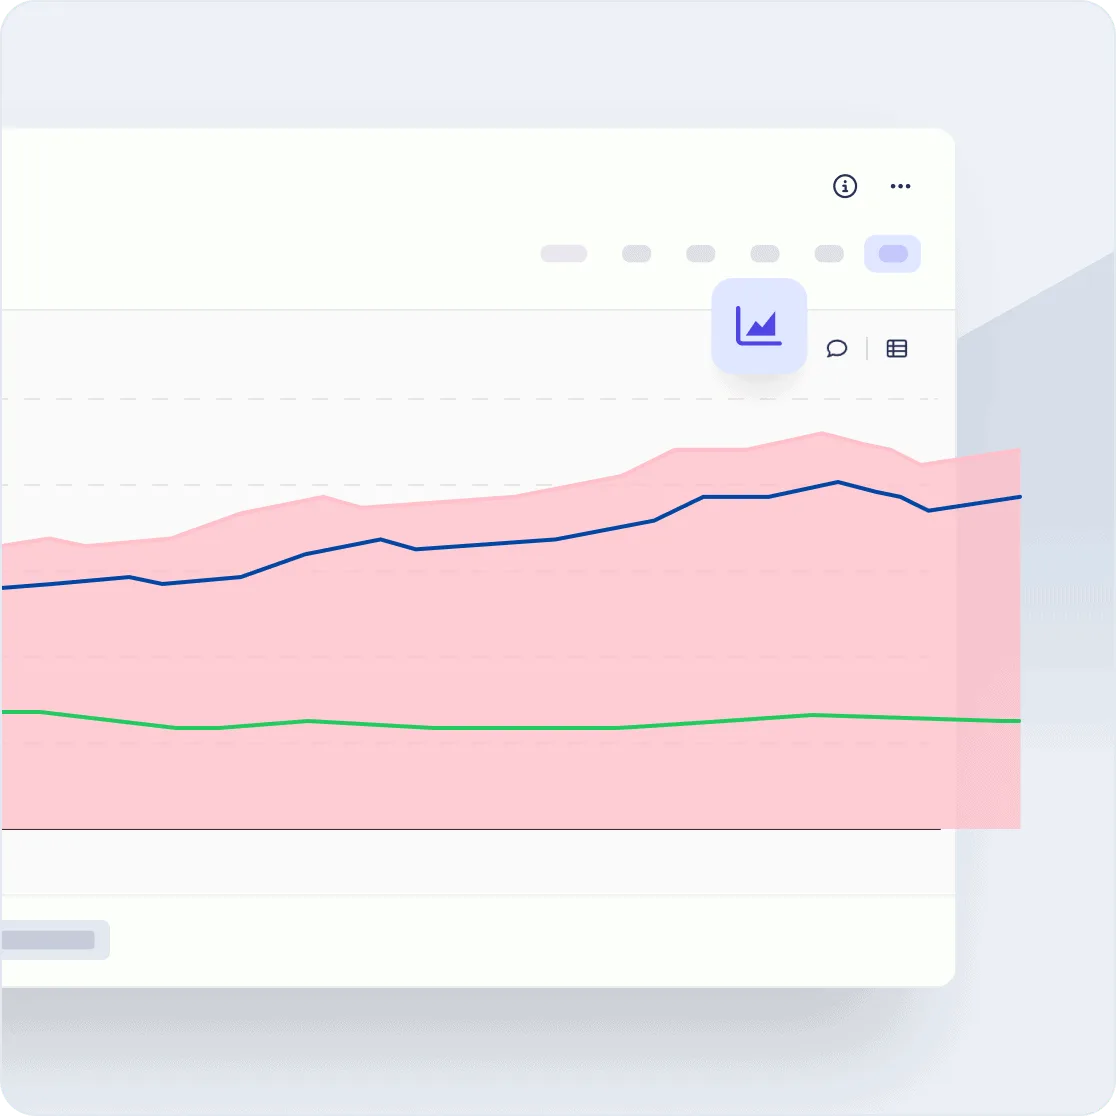
Your tour of the platform
Schedule your demo
Enter your work email and pick a time slot. We'll connect you with the right person.

Averages
Quickly benchmark and assess price levels
The Average Price Line tool allows you to instantly calculate and visualize average prices over any selected timeframe. This feature helps you quickly determine whether current prices are above or below historical averages, giving you a clear benchmark for assessing market conditions.
Test it yourself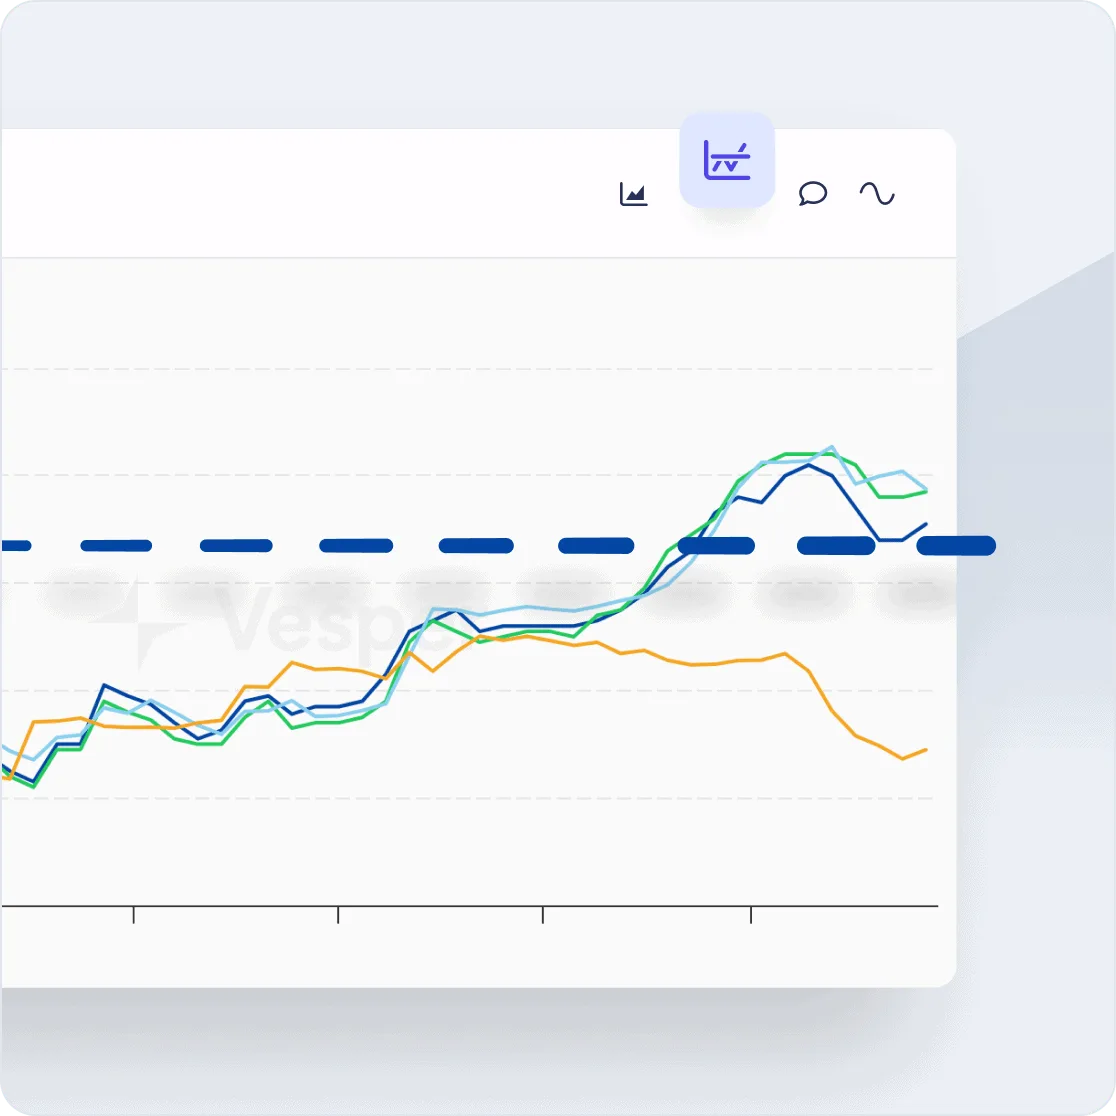
Annotations
Keep your data structured and organized
By renaming widgets and adding notes directly to your graphs, you can organize your workspace and annotate key events for future reference. This feature makes it easy to track and interpret data trends, ensuring that your insights remain clear and your dashboard stays organized for efficient analysis.
Create your account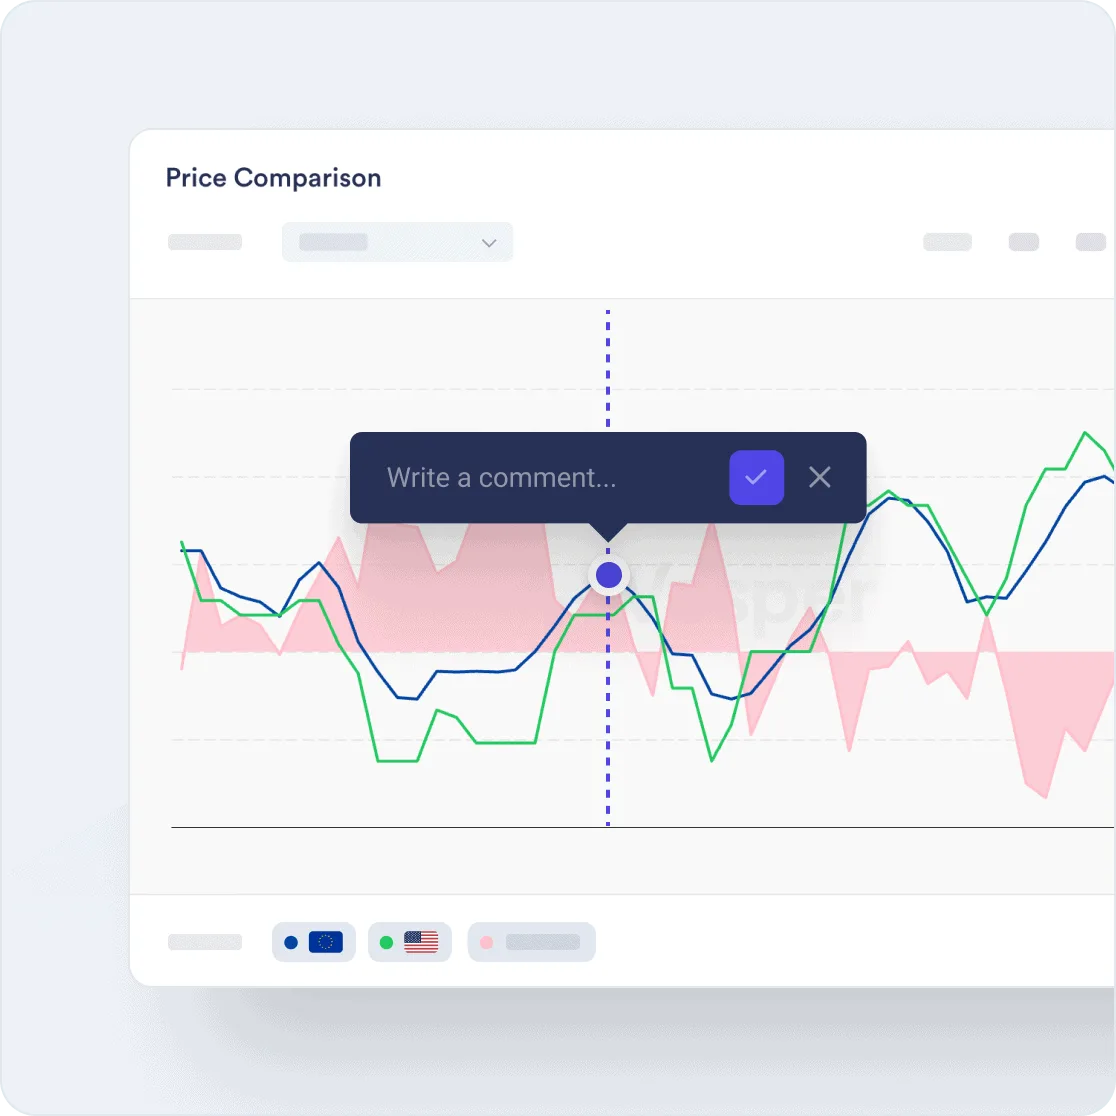
What we track
Coverage across 20+ commodity markets
20,000+ price series across every major ingredient and material category. If your team buys it, Vesper likely benchmarks it.
Grains & oilseeds
Soft commodities
Industrial & inputs


FAQ
Frequently Asked Questions
How do I zoom into a specific date range on a Vesper chart?
Select your base time period using the timeframe selector (1W, 1M, 3M, etc.), then click and drag directly on the chart to zoom into any specific range within that period. You can go down to individual day-level data. Double-click to reset the zoom.
What types of price spreads can I generate?
Three types: inter-commodity spreads (comparing different commodities, such as cocoa butter vs cocoa mass), intra-commodity spreads (the same product in different specifications or origins), and geographical spreads (the same product across different regions). All are generated with a single click and can be flipped to invert the direction.
How does the Average Price Line work?
Select any price series and choose your averaging period (such as 52 weeks, 12 months, or a custom range). Vesper calculates the rolling average and overlays it as a dashed line on the main price chart. You can see at a glance whether current prices are above or below the average and by how much.
Can I export charts for use in presentations?
Yes. Any chart or visualization on Vesper can be exported as a high-quality image for use in reports, presentations, or emails. The exported image includes the price series labels, timeframe, and any annotations you've added.
Can I share annotated charts with colleagues?
Yes. Annotations and renamed widgets are saved to your workspace and visible to teammates who have access to the same account. You can also export annotated charts as images for sharing externally in presentations or reports.