


Historical Prices
Identify market trends with historical pricing data
Unlock insights from past pricing trends to make smarter future decisions. Access up to 10 years of commodity price history, spot seasonal patterns, and benchmark your purchasing performance against the market.
Let's get started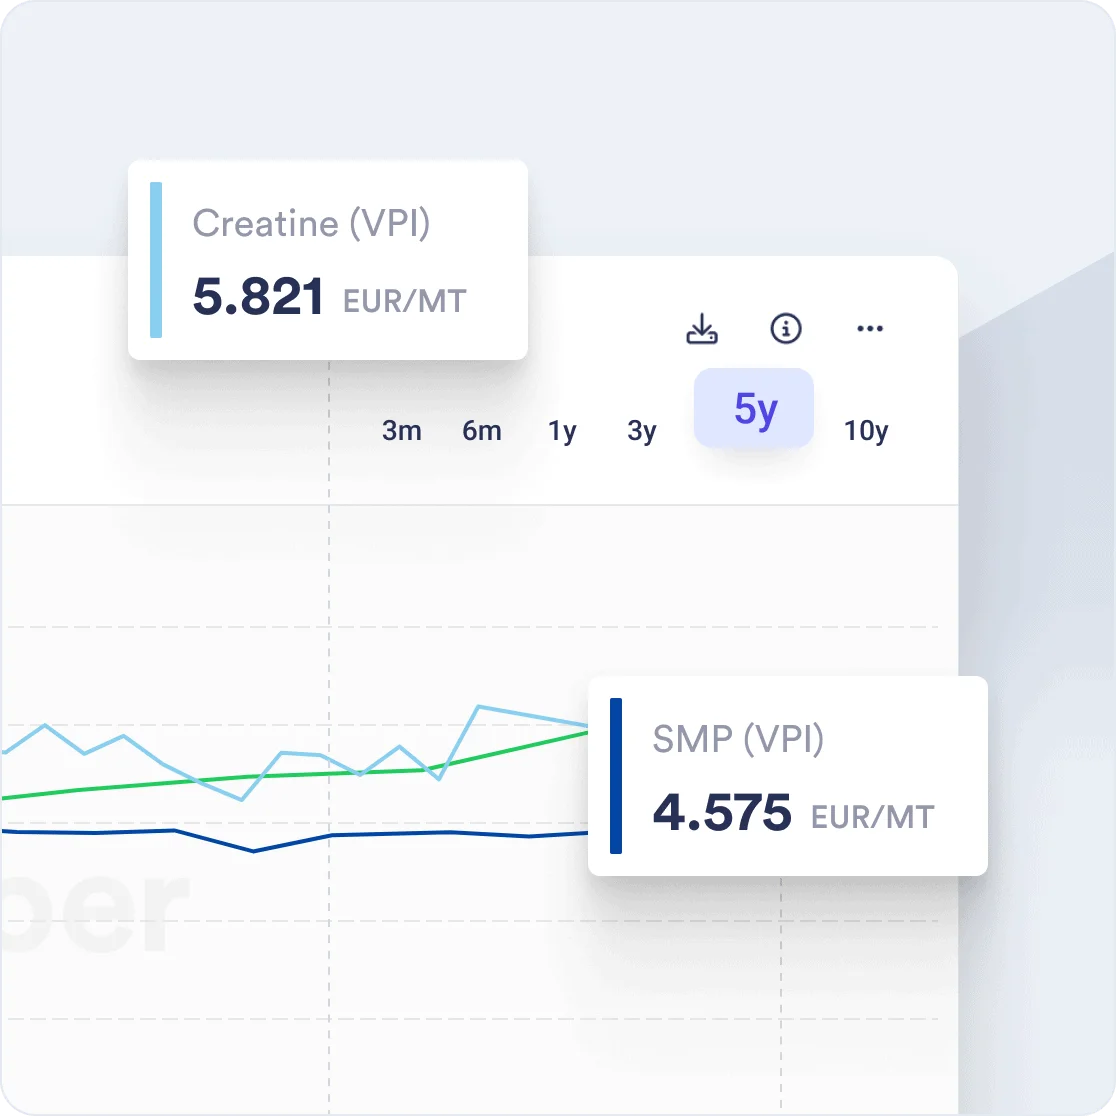
Our Users
Trusted by modern FMCG



















































Leverage reporting features
Enhance your historical pricing analysis with Vesper's reporting tools: the Average Line and Monthly Averages for visibility on fluctuations, Zoom for focused insights, price spread generation for comparisons, and a Comment feature for collaboration.
Access data up to 10 years back
Customize your graph's time frame from the past 3 months to 10 years. Analyze pricing trends and differences, including year-over-year, month-over-month, and week-over-week fluctuations.
In-depth analysis of raw data
Conduct advanced analyses with raw data using our download data feature or high-speed API connection, accessing 10+ years of data. The API allows automatic integration of historical pricing, futures, and import/export data from hundreds of independent sources into your database.
Benchmarking
Benchmark your performance
Compare your purchasing or pricing strategies to historical prices using established industry benchmarks, helping you evaluate your overall market position. Our platform enables you to track independent and reliable price benchmarks over time, giving you clear insights into how your pricing strategies measure up. With these insights, you can refine your approaches, improve cost efficiency, and ensure your pricing decisions align with the market's best practices.
Start your free trial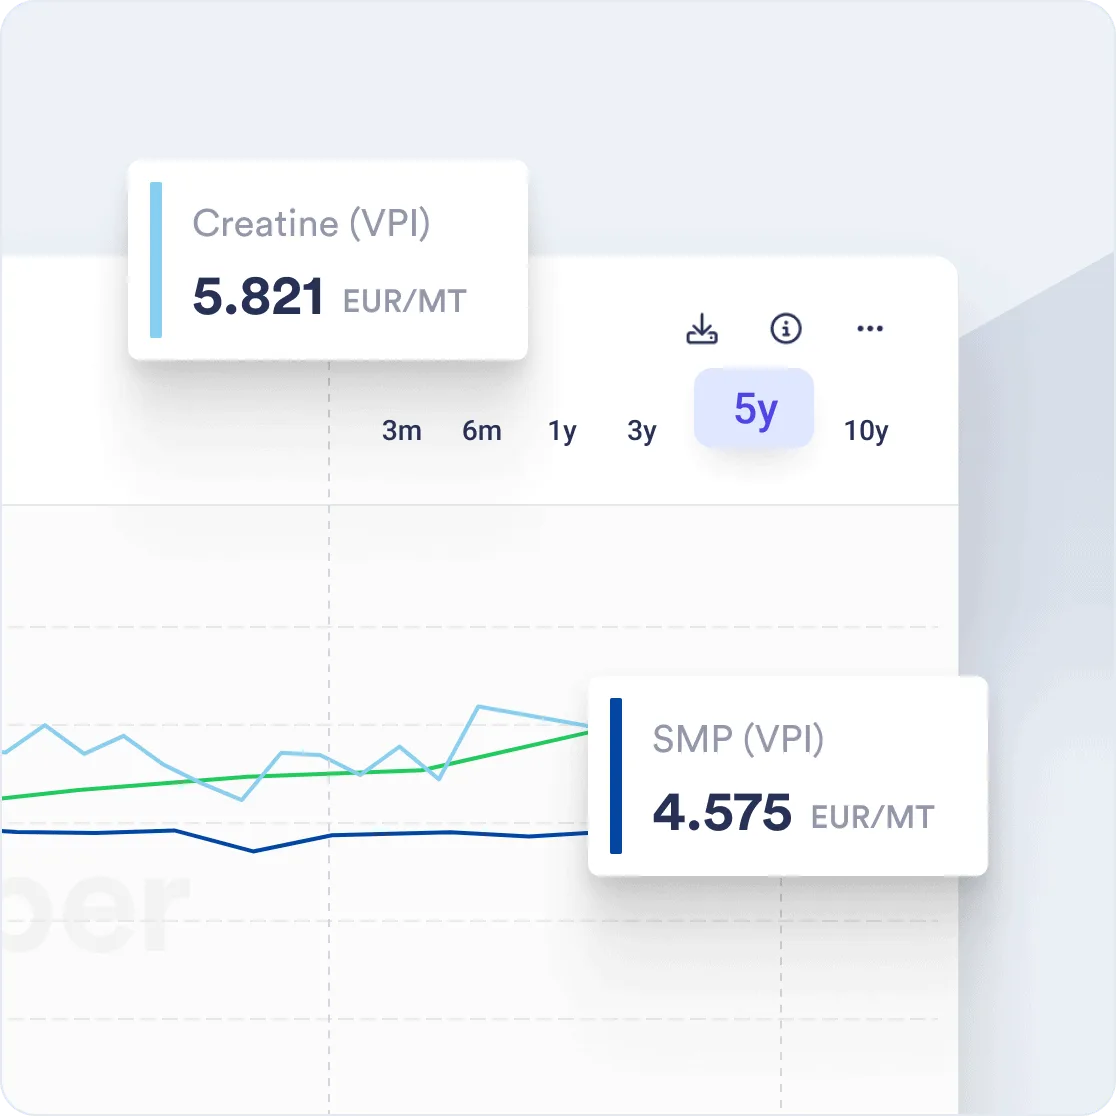
Timing
Identify optimal buying and selling windows
Analyze historical price data using the Average Line feature to clearly identify seasonal lows and highs. This helps you spot recurring trends and price patterns over time, enhancing your forecasting capabilities and allowing you to strategically time your purchases or sales to save costs or improve margins.
Get access now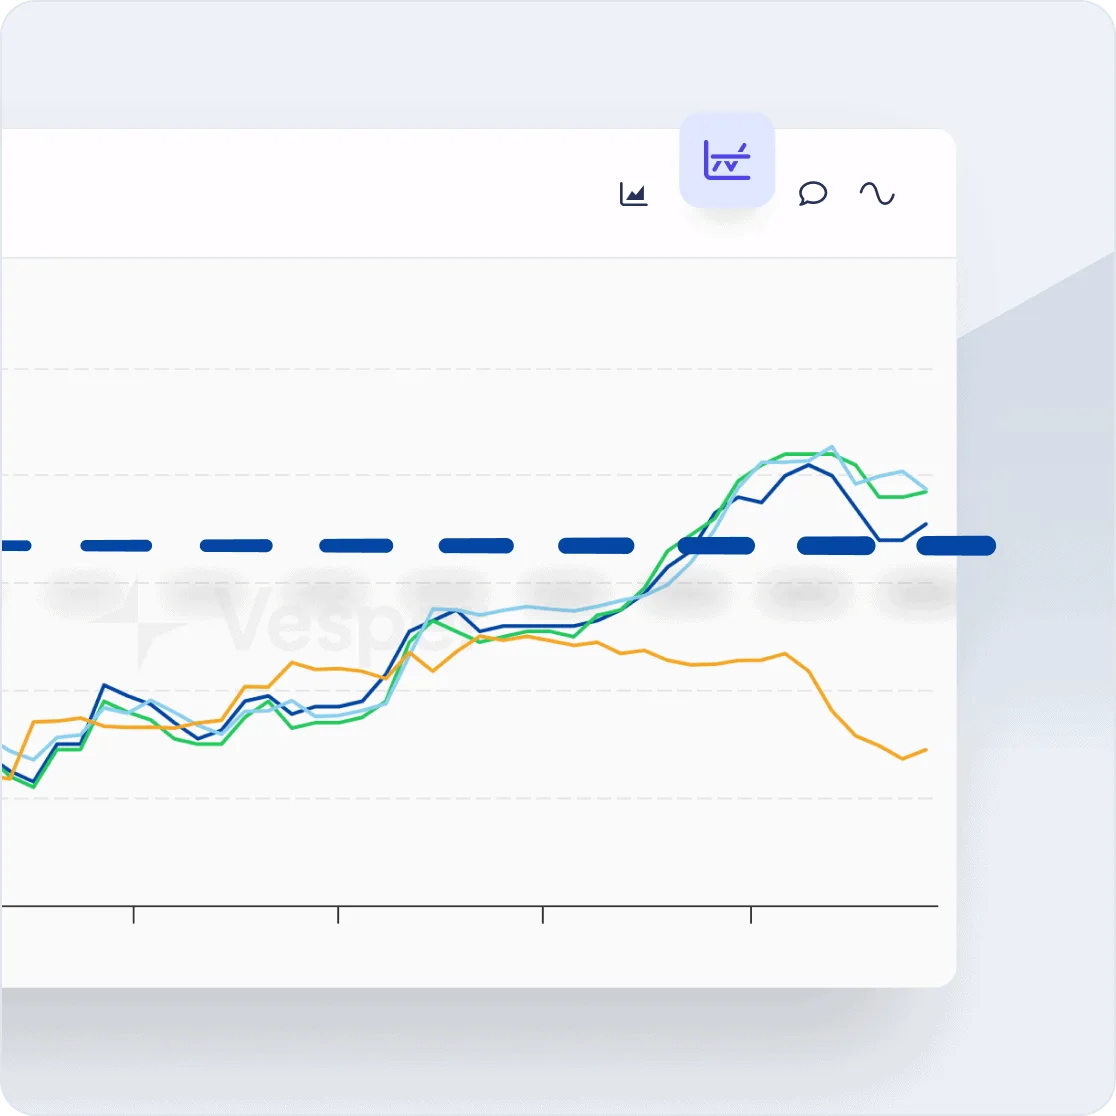
Your tour of the platform
Schedule your demo
Enter your work email and pick a time slot. We'll connect you with the right person.

Data extraction
Various extraction methods
Vesper provides flexible extraction methods to suit your needs. Use the Download Data feature to customize datasets by time frame, region, and product for analyses based solely on Vesper's data. For advanced needs, our high-speed API connects directly to your database, offering real-time updates and integration of multiple datasets for tailored analyses, enhancing decision-making across your organization.
Test it yourself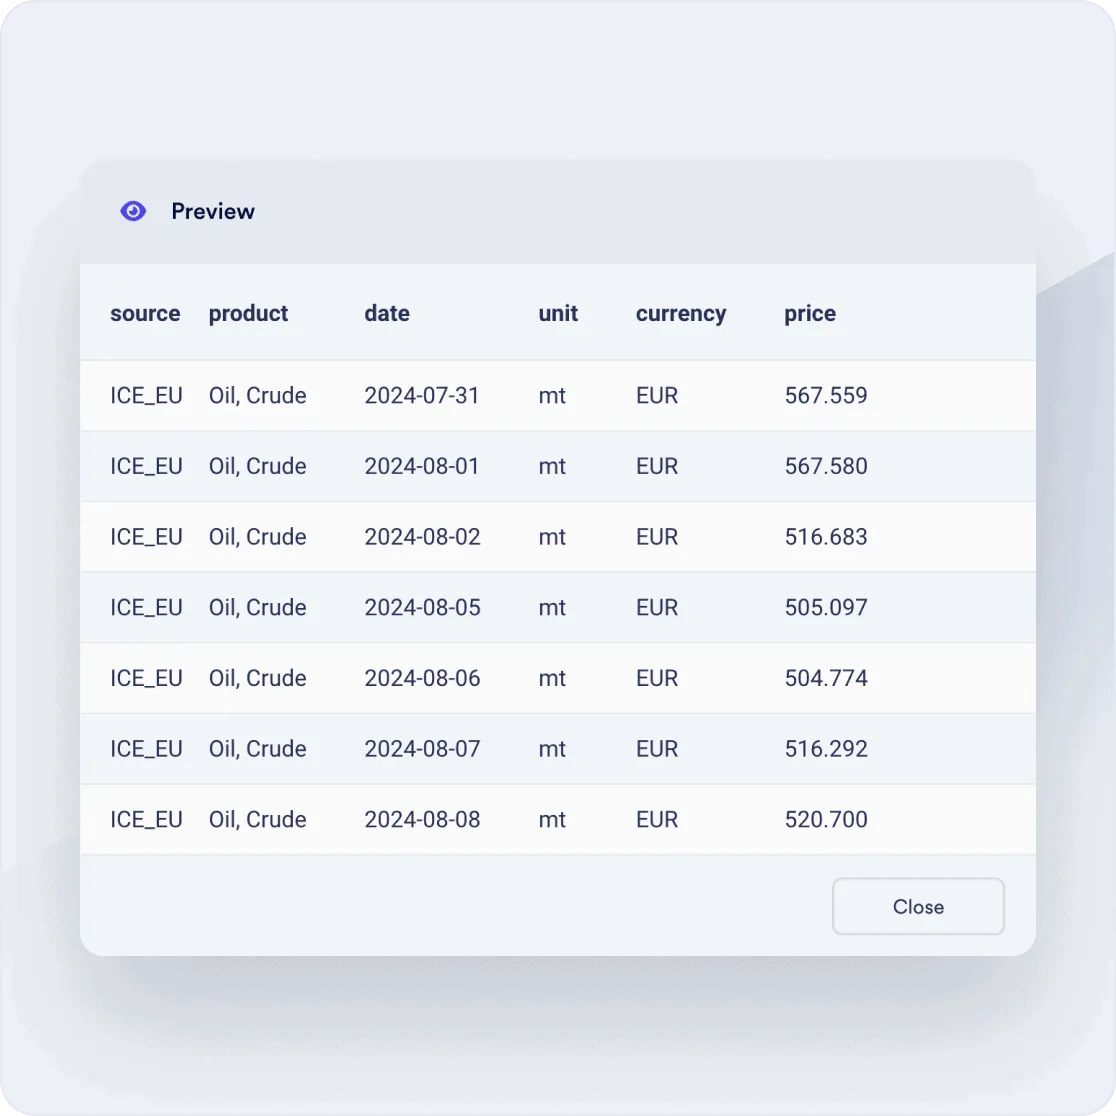
What we track
Coverage across 20+ commodity markets
20,000+ price series across every major ingredient and material category. If your team buys it, Vesper likely benchmarks it.
Grains & oilseeds
Soft commodities
Industrial & inputs








FAQ
Frequently Asked Questions
How far back does Vesper's historical pricing data go?
For most commodity series, Vesper provides 5 to 10 years of historical data. Some series go further. The exact start date for each series is shown on the platform. For bulk historical data extraction, both the Download Data feature and the API support the full available range.
Can I compare multiple commodities over the same time period?
Yes. Vesper lets you overlay multiple price series on the same chart, across different commodities, regions, or benchmarks. This is useful for spotting correlations, comparing how a raw material has moved relative to its derivatives, or analyzing your key inputs side by side.
What is the Average Line feature and how does it help?
The Average Line adds a rolling average to any historical price chart, calculated over the period you select (such as 52-week or 12-month). This makes it much easier to filter out short-term noise and identify the underlying trend, seasonal patterns, or structural shifts in a commodity market.
How can I use historical prices to improve my purchasing strategy?
Historical data lets you identify recurring seasonal patterns, compare your actual purchase prices against market benchmarks, and evaluate whether your timing has been above or below the trend. Over time, this gives you a data-driven basis for setting procurement targets, timing contracts, and measuring your team's market performance.
Can I download historical price data for use in my own models?
Yes. You can export any historical price series as CSV, XLSX, or JSON via the Download Data feature, with full control over the time range, product, and region. For automated ingestion, the Vesper API provides the same data in real-time, with support for integration into databases, BI tools, and custom pricing models.