

Leverage Commodity Stock Forecasts to navigate market uncertainty
Vesper forecasts can help you form a comprehensive market outlook and make decisions confidently. Leveraging machine learning, Vesper Forecasts analyse millions of global data points to provide insights into potential market shifts. Our model, primarily based on technical analysis, examines historical patterns, incorporating technical and economic indicators to make unbiased market predictions.
We also forecast prices and production. Find out more about Price Forecasts here and Production Forecasts here.
Benefits of Using Vesper’s Commodity Price Forecasts
Extensive Processing Power Our model can analyse millions of data points, far exceeding human capabilities, ensuring you can access comprehensive and detailed insights.
Advanced Data Interpretation Our in-house data science team provides an extremely technical level of analysis, meaning you get unique insights that are challenging to obtain elsewhere.
Transparent Predictions We provide the average accuracy for each forecasted time period, giving you confidence in the precision and transparency of our predictions.
Real-Time Updates Our forecasting model updates in real-time with each new data point, ensuring you always have the latest information for accurate decision-making.
Stay Ahead in Volatile Markets Use our AI-driven forecasts to understand potential market shifts, along with your own fundamental analysis, to form a comprehensive outlook on the market.
Forecasting commodity production: step-by-step
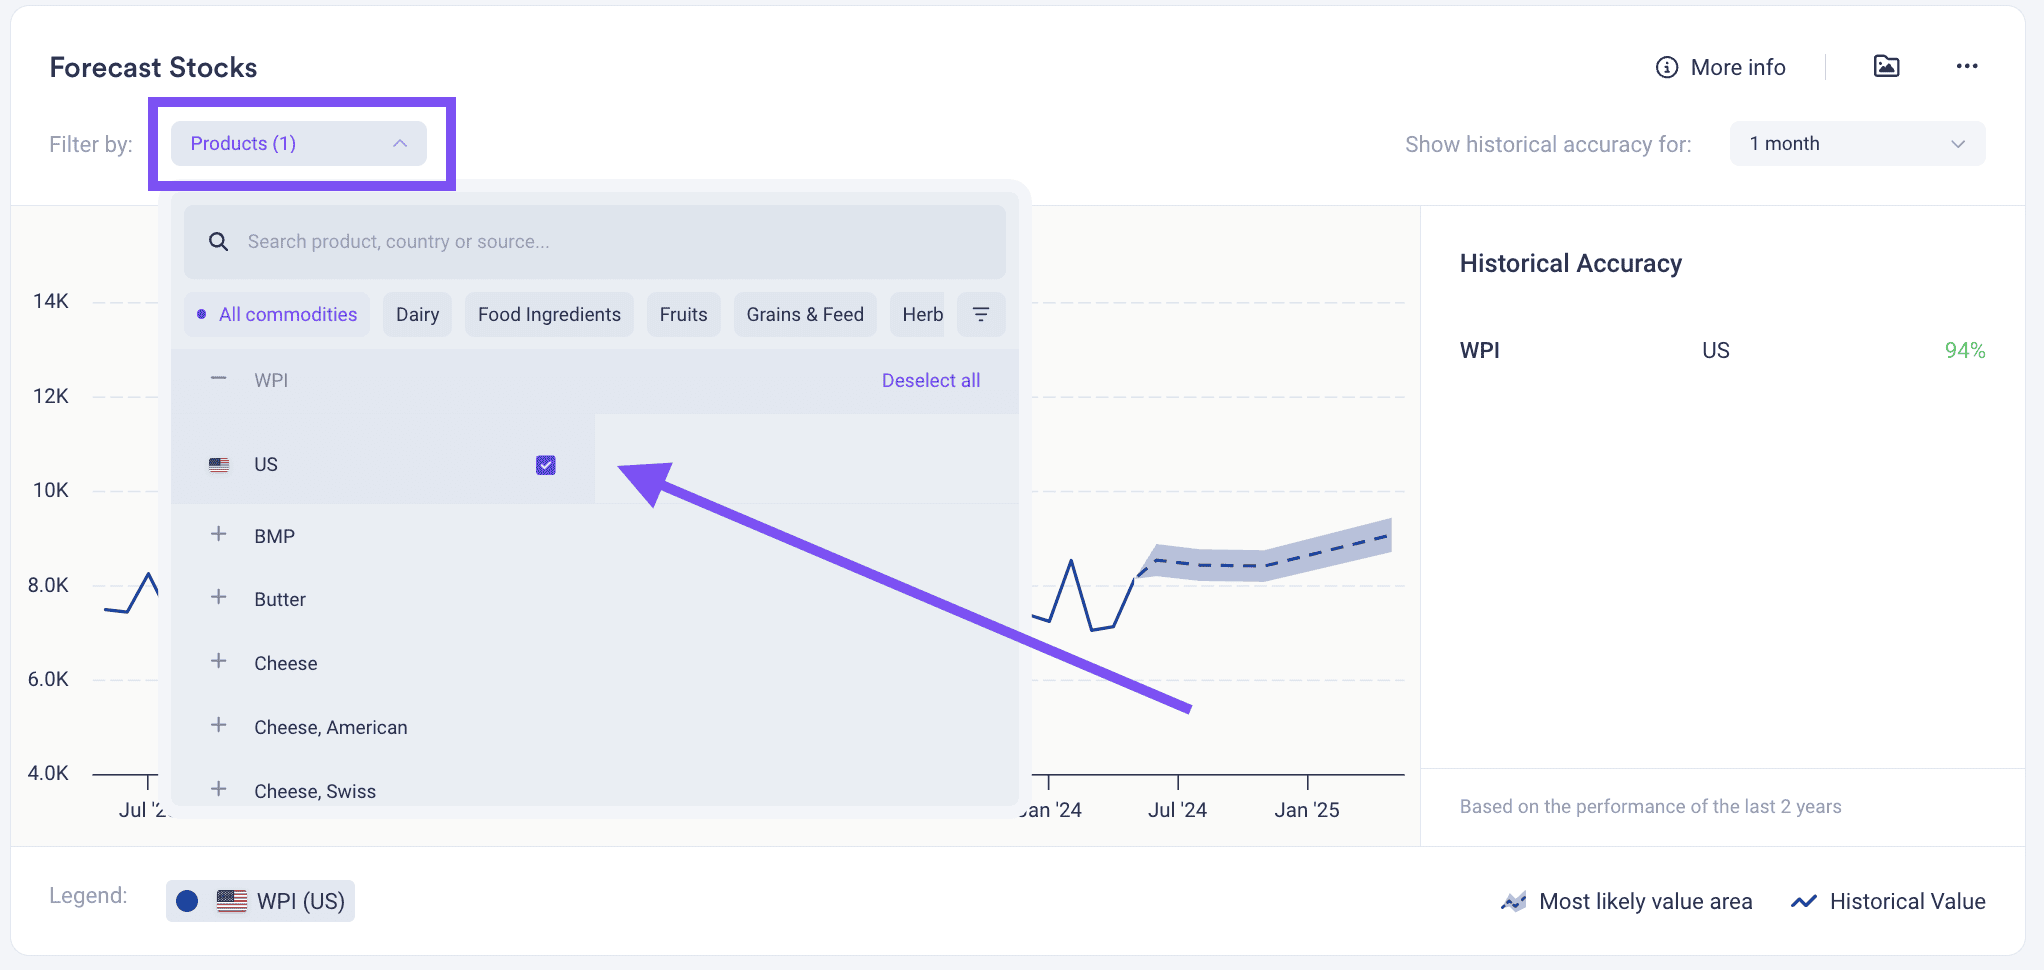
1. Find and select your product
Use the products filter to find and select the product for which you would like to see the AI forecasts.
In our example below, we are looking at the US stocks for WPI.
2. Interpreting the Forecast
Vesper Forecasts provide multiple insights:
- The forecasted data point (dashed line)
- The most likely range (the shaded area)
- The forecasted direction of the market (the dashed line and the shaded area)
- Its historical performance 2-year average for a specific interval (right-hand bar)
- Individual price point accuracy (as you hover over the solid line) Keep in mind as you hover over the solid line, the forecasted data point was predicted months before the actual data point, depending on the interval you have chosen in the right-hand bar.
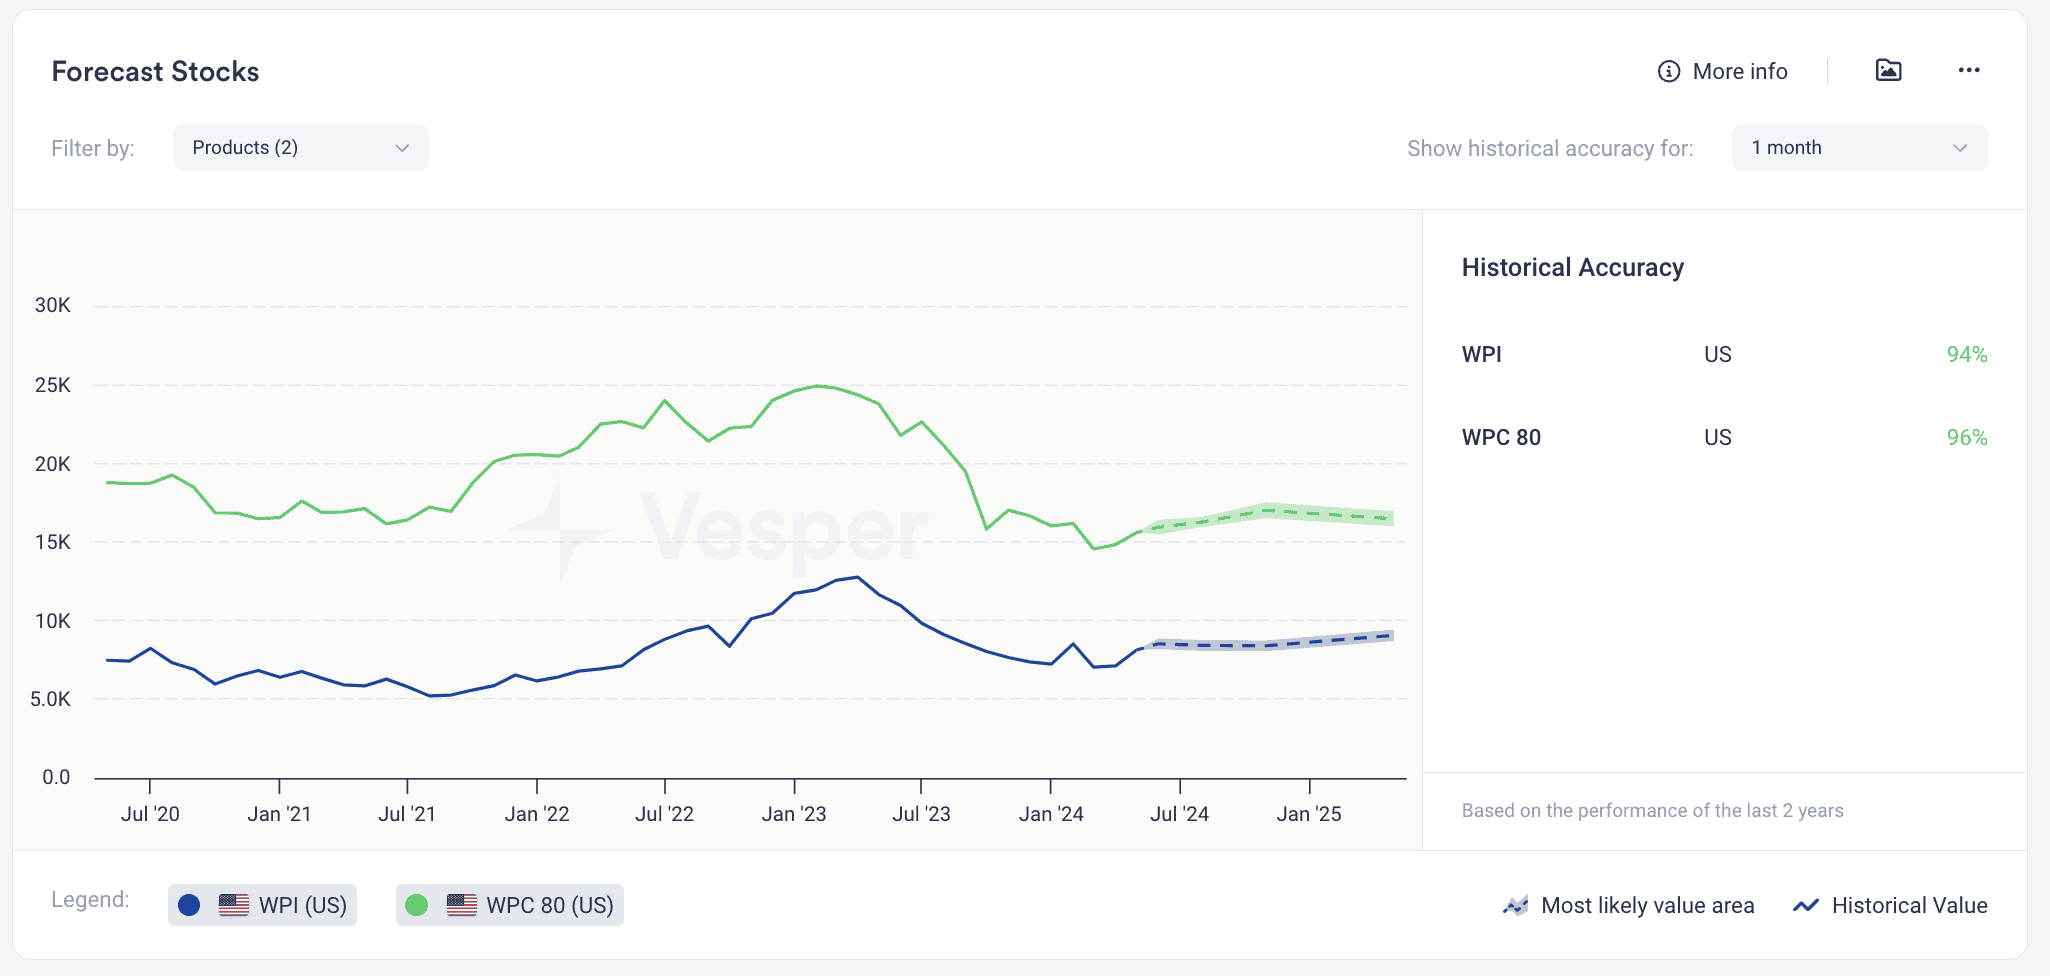
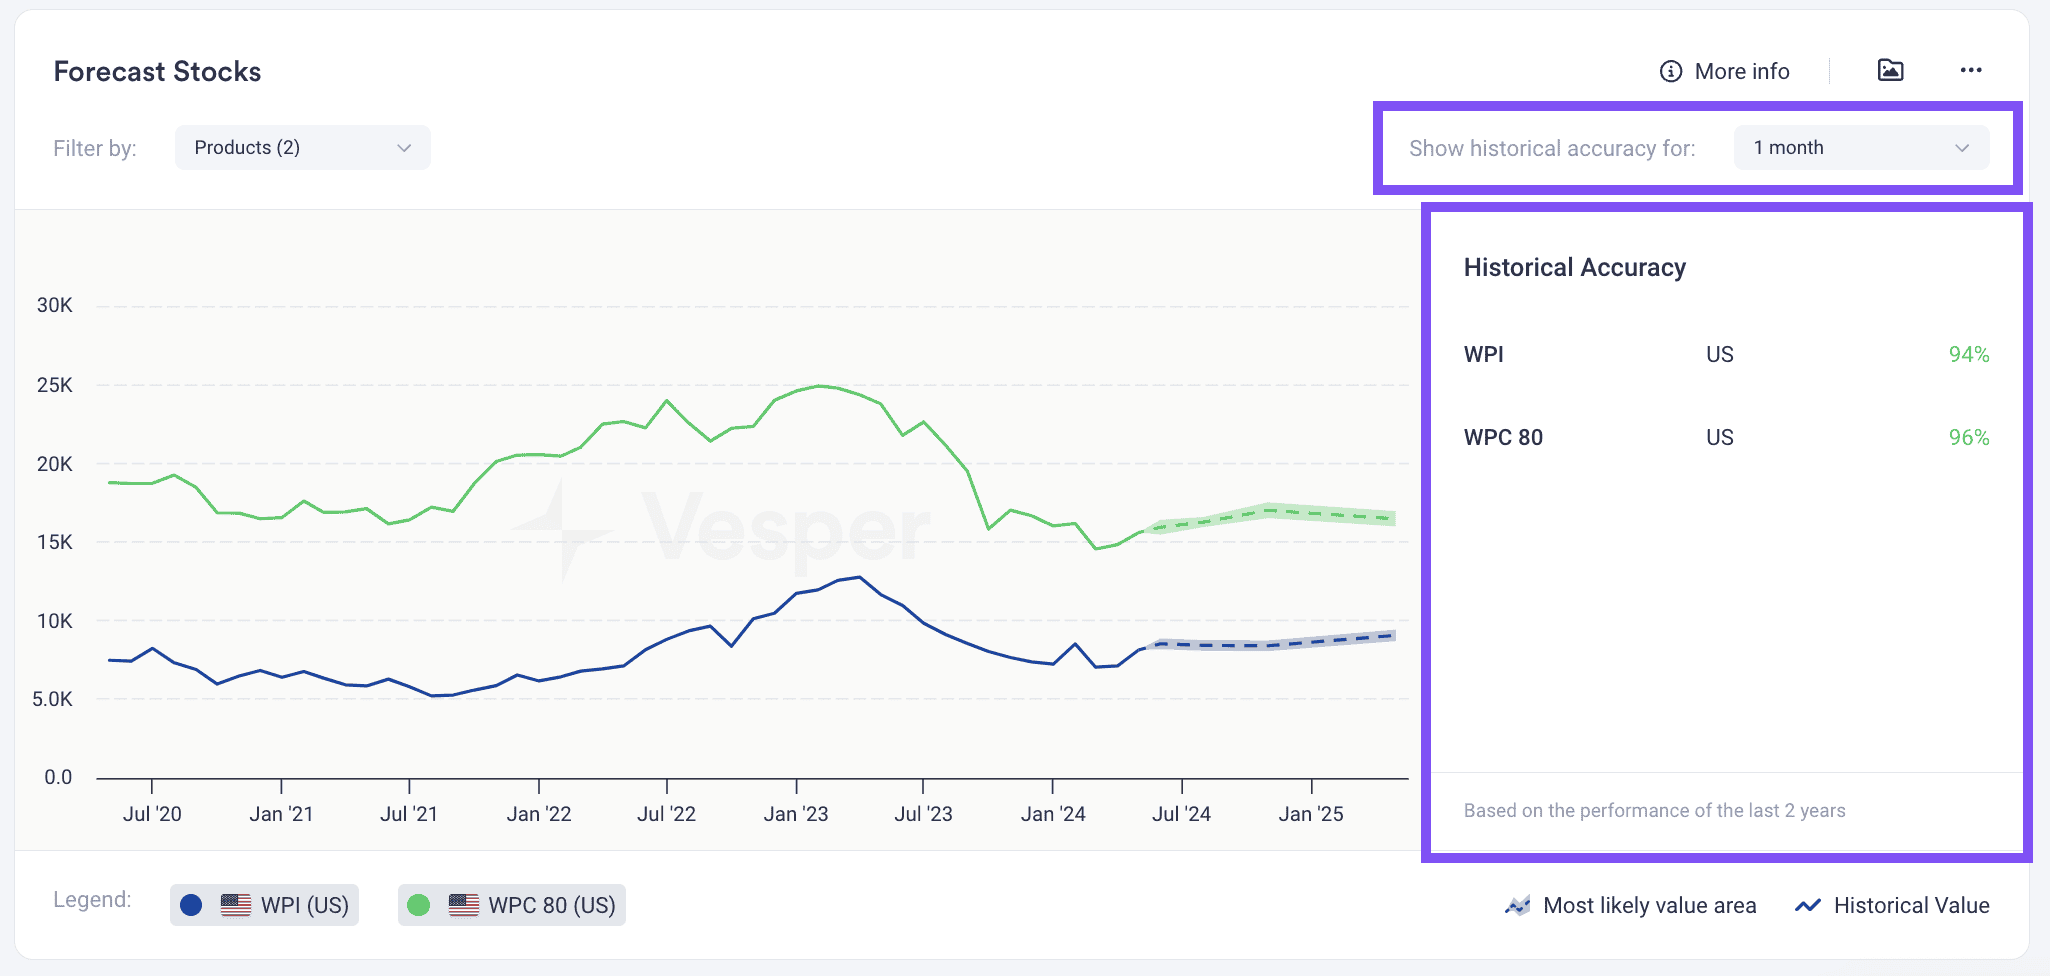
You can also add multiple products at the same time to your widget. Simply select more than one product in the products filter. In this case, we are comparing US WPC80 and WPI.
As you can see in our example below, this enables you to quickly compare forecasts.
3. Analyze Forecast Accuracy
In the right-hand sidebar, you can view the average historical accuracy for this product for the last two years. You can select which forecast you want to view the accuracy for:
- 1 month
- 3 months
- 6 months
- 12 months
We prioritise transparency at Vesper, and that’s why we openly display the accuracy of our forecasts. This way, you can make well-informed decisions when incorporating the forecasts into your strategies.
Use Case for adopting commodity price forecats
Procurement Teams
Procurement teams can use stock forecasts, including seasonal trends, to plan their purchasing schedules. By analysing projected stock performance, identifying seasonal trends, and anticipating changes, they can time their procurement strategically. This approach ensures a steady supply and helps manage budgets more effectively. For instance, a procurement manager might avoid overpaying during high-demand periods and secure better deals when stocks are predicted to be more plentiful.
Market Analysts
Market analysts can utilise stock forecasts to enhance their market trend predictions and evaluate the potential impacts on business margins. By studying anticipated stock performance, seasonal trends, and anticipated fluctuations, they can offer more accurate and strategic advice to their procurement and risk management teams. This knowledge allows them to guide the business in making informed decisions to maintain a competitive edge.
Sales Managers
Sales managers can leverage stock forecasts to refine their sales strategies. With insights into expected stock and seasonal trends, they can adapt their pricing models and efforts to maximise revenue. For example, during anticipated high-demand seasons, they can increase prices to boost margins, while offering discounts or special deals during predicted low-demand periods to stimulate sales and maintain customer engagement.
Frequently asked questions
What is the difference between a commodity stock forecast and a price forecast?
A stock forecast projects future inventory or stock levels for a commodity, helping you anticipate whether supplies will be tight or plentiful. A price forecast predicts the price itself. Vesper produces both, alongside production forecasts, so you can connect expected supply and demand conditions to the price moves they tend to drive.
How can procurement teams use stock forecasts to time their purchasing?
By studying projected stock performance and seasonal trends, procurement teams can schedule buying strategically: securing volume when stocks are predicted to be plentiful and prices softer, and avoiding overpaying during high-demand periods when inventories tighten. This helps maintain steady supply and manage budgets more effectively rather than reacting to the market after a swing has already happened.
How does Vesper generate its stock forecasts, and can I trust the accuracy?
The forecasts use machine learning, analysing millions of global data points with a model based primarily on technical analysis of historical patterns plus technical and economic indicators. For transparency, Vesper openly displays the two-year average historical accuracy for each product across 1, 3, 6, and 12-month intervals, so you can judge reliability before building forecasts into your strategy.
What information does a Vesper stock forecast actually show me?
Each forecast shows the projected data point as a dashed line, the most likely range as a shaded band, and the predicted market direction. A right-hand bar displays the two-year average accuracy for your chosen interval, and hovering the solid line reveals individual price-point accuracy. You can also overlay multiple products in one widget to compare their forecasts side by side.