

Leverage Commodity Production Forecasts to navigate market volatility
Vesper forecasts can help you form a comprehensive market outlook and make decisions confidently. Leveraging machine learning, Vesper Forecasts analyse millions of global data points to provide insights into potential market shifts. Our model, primarily based on technical analysis, examines historical patterns, incorporating technical and economic indicators to make unbiased market predictions.
We also forecast prices and ending stocks. Find out more about Price Forecasts here and Ending Stock Forecasts here.
Benefits of Using Vesper’s Commodity Price Forecasts
Extensive processing power Our model can analyse millions of data points, far exceeding human capabilities, ensuring you can access comprehensive and detailed insights.
Advanced data interpretation Our in-house data science team provides an extremely technical level of analysis, meaning you get unique insights that are challenging to obtain elsewhere.
Transparent Predictions We provide the average accuracy for each forecasted time period, giving you confidence in the precision and transparency of our predictions.
Real-time updates Our forecasting model updates in real-time with each new data point, ensuring you always have the latest information for accurate decision-making.
Stay ahead in volatile markets: Use our AI-driven forecasts to understand potential market shifts, along with your own fundamental analysis to form a comprehensive outlook on the market.
Forecasting commodity production: step-by-step
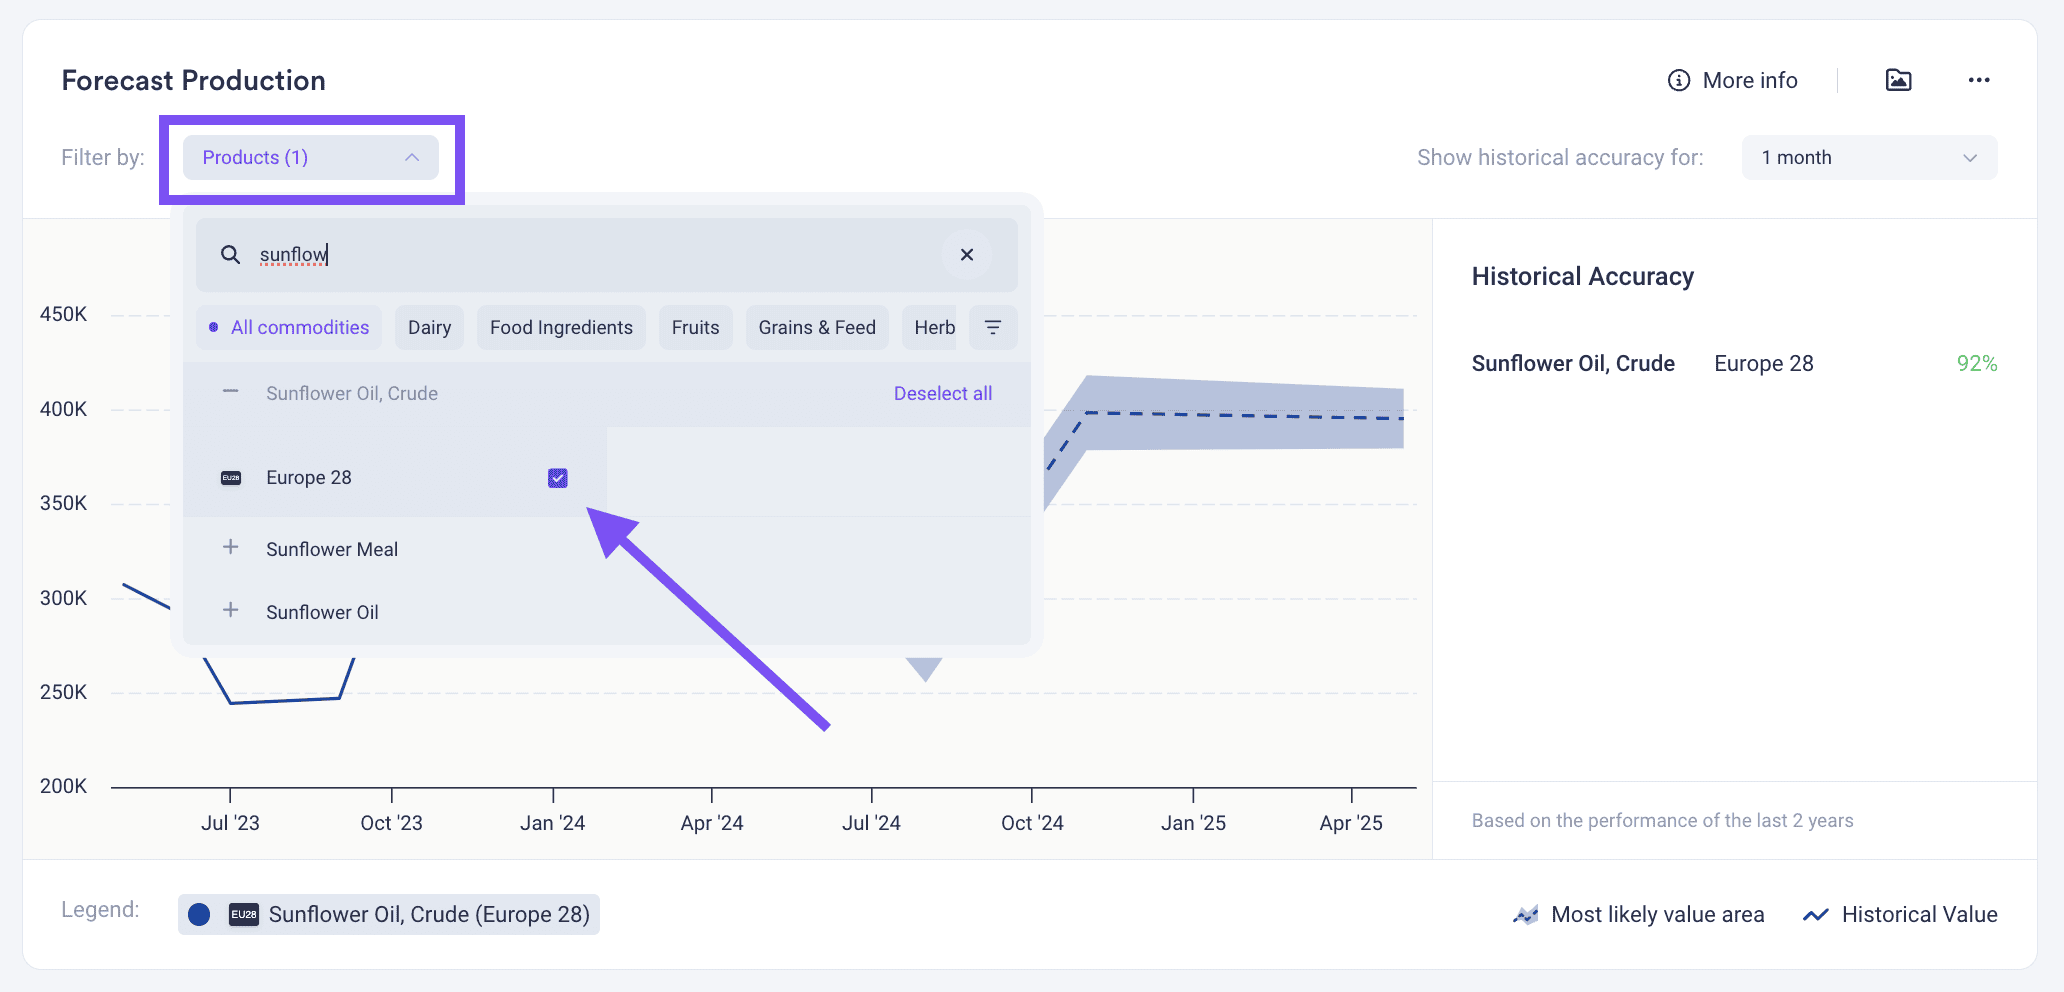
1. Find and select your product
Use the products filter to find and select the product for which you would like to see the AI forecasts.
In our example below, we are looking at the Europe 28 production for Crude Sunflower Oil.
2. Interpreting the forecast points
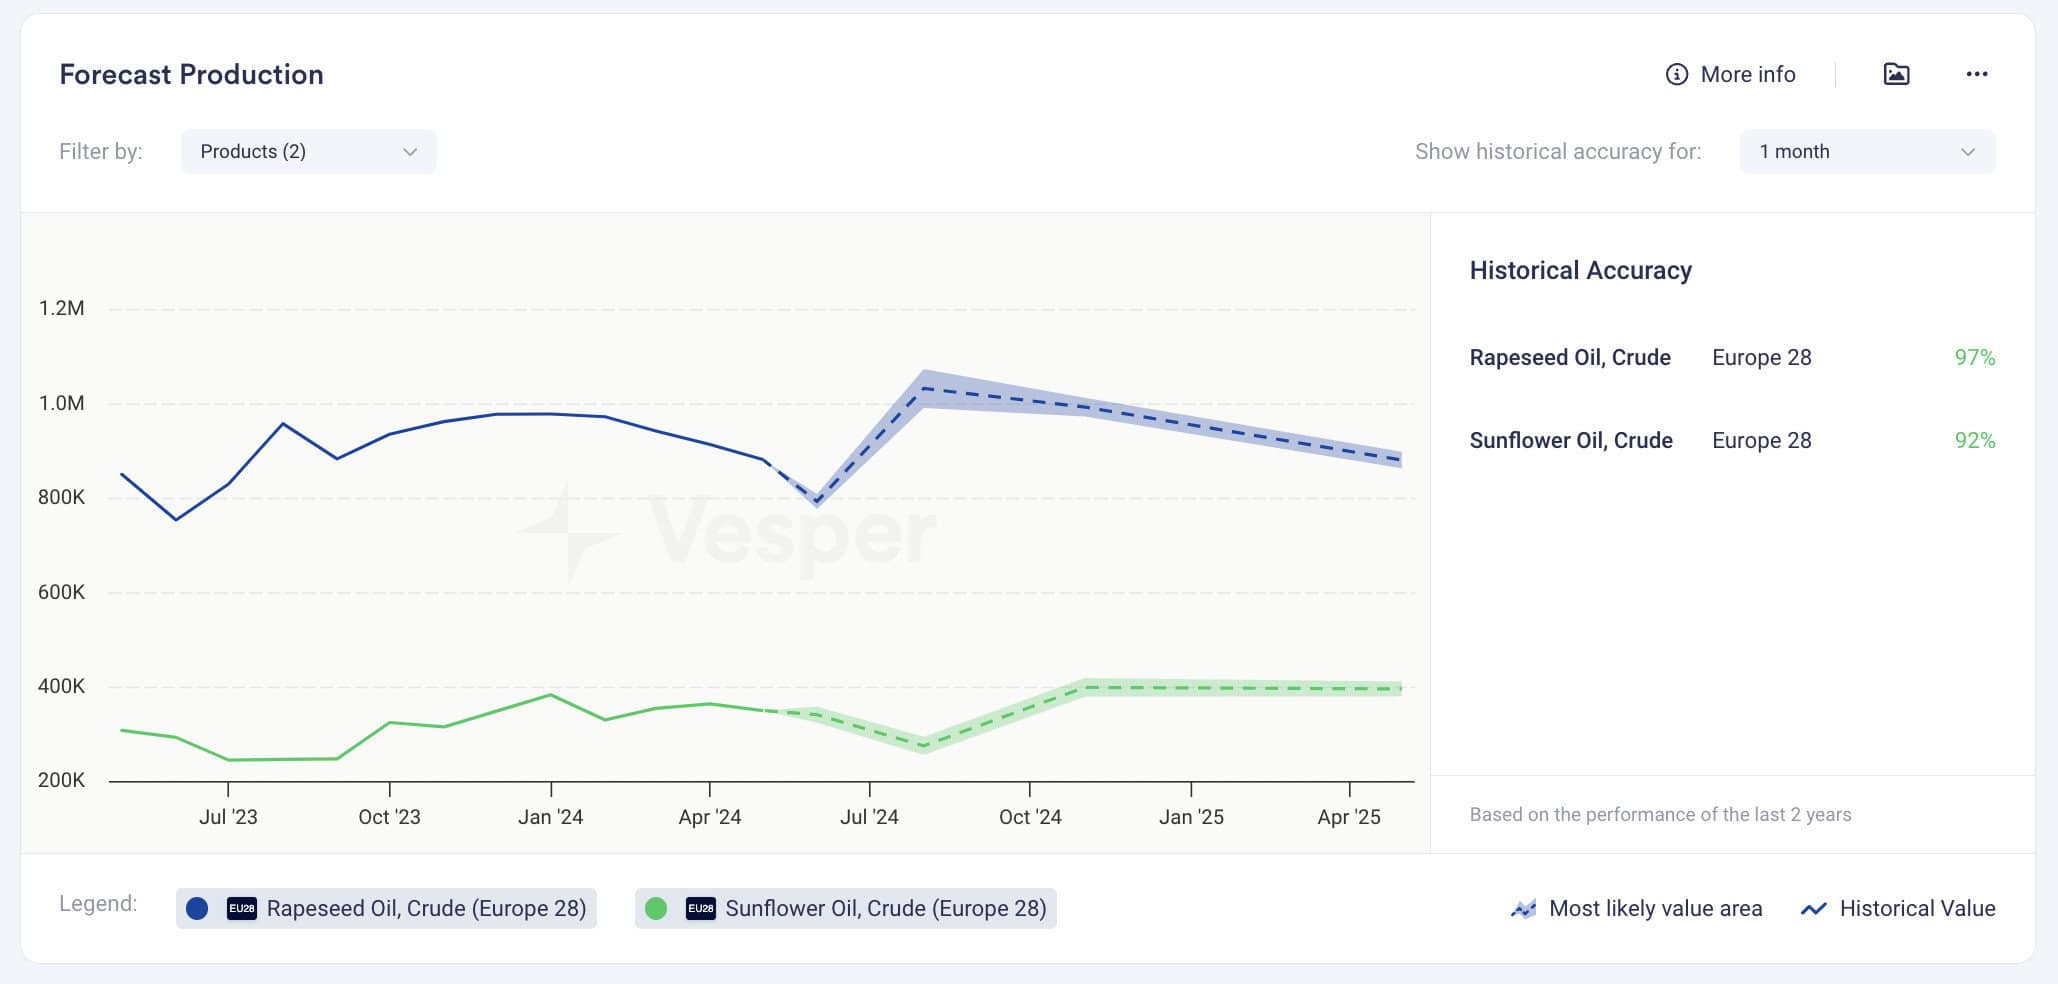
Vesper Forecasts provide multiple insights:
- the forecasted data point (dashed line)
- the most likely range (the shaded area)
- the forecasted direction of the market (the dashed line and the shaded area)
- its historical performance 2-year average for a specific interval (right-hand bar)
- and individual price point accuracy (as you hover over the solid line) Keep in mind as you hover over the solid line, the forecasted data point was predicted months before the actual data point, depending on the interval you have chosen in the right-hand bar.
You can also add multiple products at the same time to your widget. Simply select more than one product in the products filter. In this case, we are comparing Europe 28 Crude Sunflower Oil and Crude Rapeseed Oil.
As you can see in our example below, this enables you to quickly compare forecasts.
3. Analyze forecast accuracy
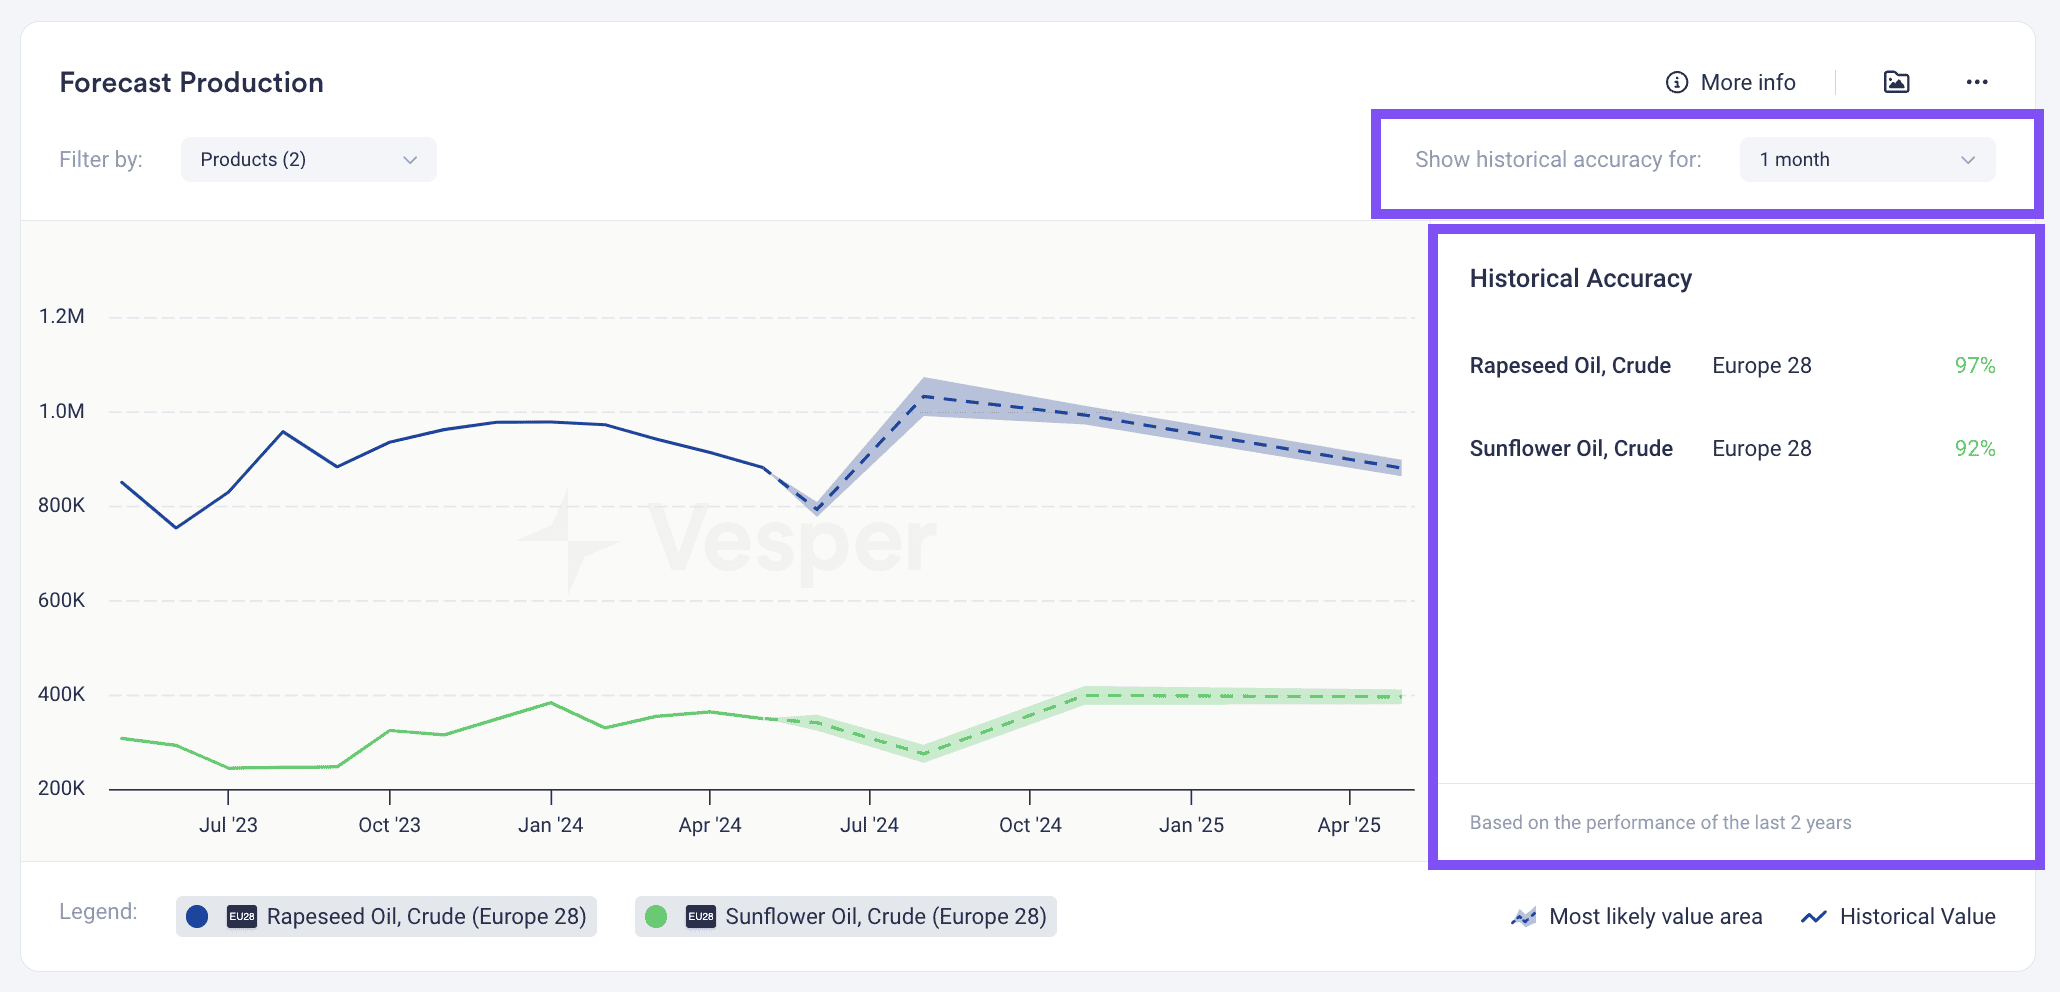
In the right-hand sidebar, you can view the average historical accuracy for this product for the last two years. You can select which forecast you want to view the accuracy for:
- 1 month
- 3 months
- 6 months
- 12 months
We prioritise transparency at Vesper, and that’s why we openly display the accuracy of our forecasts. This way, you can make well-informed decisions when incorporating the forecasts into your strategies.
Use Case for adopting commodity price forecats
Procurement Teams
Procurement teams can utilise production forecasts, including seasonal trends, to plan their purchasing schedules. By understanding future production patterns and seasonal fluctuations, they can decide on the best times to secure contracts, ensuring a consistent supply and effective budget management throughout the year.
Market Analysts
Market analysts can utilise production forecasts to predict market trends and assess their potential impact on the business. By understanding future production cycles and seasonal variations, they can provide strategic recommendations on procurement strategies and competitive positioning, helping the company stay ahead of market changes and seasonal shifts.
Sales Managers
Sales managers can leverage production forecasts to develop proactive sales strategies. By understanding anticipated production trends and seasonality, they can adjust pricing models and tailor sales to maximise revenue. This foresight enables them to offer competitive prices and better deals to clients, aligning with both market conditions and seasonal demands.
Frequently asked questions
What data does Vesper use to forecast commodity production?
Vesper's model is primarily based on technical analysis. It uses machine learning to analyse millions of global data points, examining historical patterns and incorporating technical and economic indicators to produce unbiased predictions. Because the model updates in real time with each new data point, the production forecasts always reflect the latest available information rather than a static snapshot.
How can I judge whether a production forecast is reliable before acting on it?
The platform openly displays the average historical accuracy for each product over the past two years, and you can view that accuracy by interval: 1, 3, 6, or 12 months. Hovering over the solid line also shows individual price-point accuracy, with the forecast made months before the actual value. Vesper prioritises this transparency so you can weigh each prediction appropriately.
How should I read the shaded area and dashed line on a production forecast chart?
The dashed line is the forecasted data point, and the shaded area is the most likely range around it. Together they indicate the forecasted direction of the market. Rather than treating the dashed line as a single certain number, procurement teams should plan around the full range, which reflects the uncertainty inherent in any forward-looking production estimate.
Can I compare production forecasts for more than one commodity at once?
Yes. You can add multiple products to the same widget by selecting more than one in the products filter. The article's example compares Europe 28 Crude Sunflower Oil and Crude Rapeseed Oil side by side. This lets buyers quickly weigh substitutable inputs or related markets together, which supports timing purchasing schedules and managing budgets across a category.