Daily & weekly commodity pricing
A simplified view of commodity Futures
A personalised hub of information
Enhanced forecasting with AI
Easy-to-use, integrated pricing models
An unbiased view on local & global markets
Access data on the go with the Vesper App
Set yourself up for success by scheduling a strategy demo with one of our experts.
Find out how Vesper can help you with more than 1900+ products
From raw milk and cheeses, to high-protein whey and more
From vegetable oil and animal fats to oleochemicals, feedstocks and more
From white sugar and crystal sugar to hydrous ethanol and more
From corn flour, wheats and oats to barley, rice and more
From beef, veal and chicken to wild boar, eggs, and more
From boxboard and paper waste to tin, aluminium and more
Set yourself up for success by scheduling a strategy demo with one of our experts.
Industry news & Vesper highlights
Learn how Vesper is transforming the industry
Stay informed with Vesper updates
Get to know everything about commodities
Get your hands on valuable whitepapers
Try free versions of our commodity calculators
Join industry tailored Whatsapp groups
Join our bi-weekly webinars
Expert insights on commodities.
Get your hands on the latest marketprices for a range of products including:
We're building the most user-friendly commodity intelligence platform
Get to know the people leading the way at vesper
Get in touch to discuss how Vesper can help you and your team
View our vacancies and join the team
Discover how you can become an official partner of Vesper
Join one of the fastest growing commodity tools in the market.
Track Global Trade
Import and export data provides you with a comprehensive view of global market dynamics. By understanding trade flows, you can identify key markets, track international demand and supply, and make informed decisions based on global trends.
Strategic Trade Planning
Access to detailed import and export data enables your business to develop strategic trade plans. This information helps in identifying profitable markets and improving trade routes, ensuring efficient and cost-effective operations.
Competitive Advantage
Leveraging import and export data provides a competitive edge by identifying emerging markets and potential trade opportunities. Your business can stay ahead of competitors by adapting strategies to changing global trade patterns.
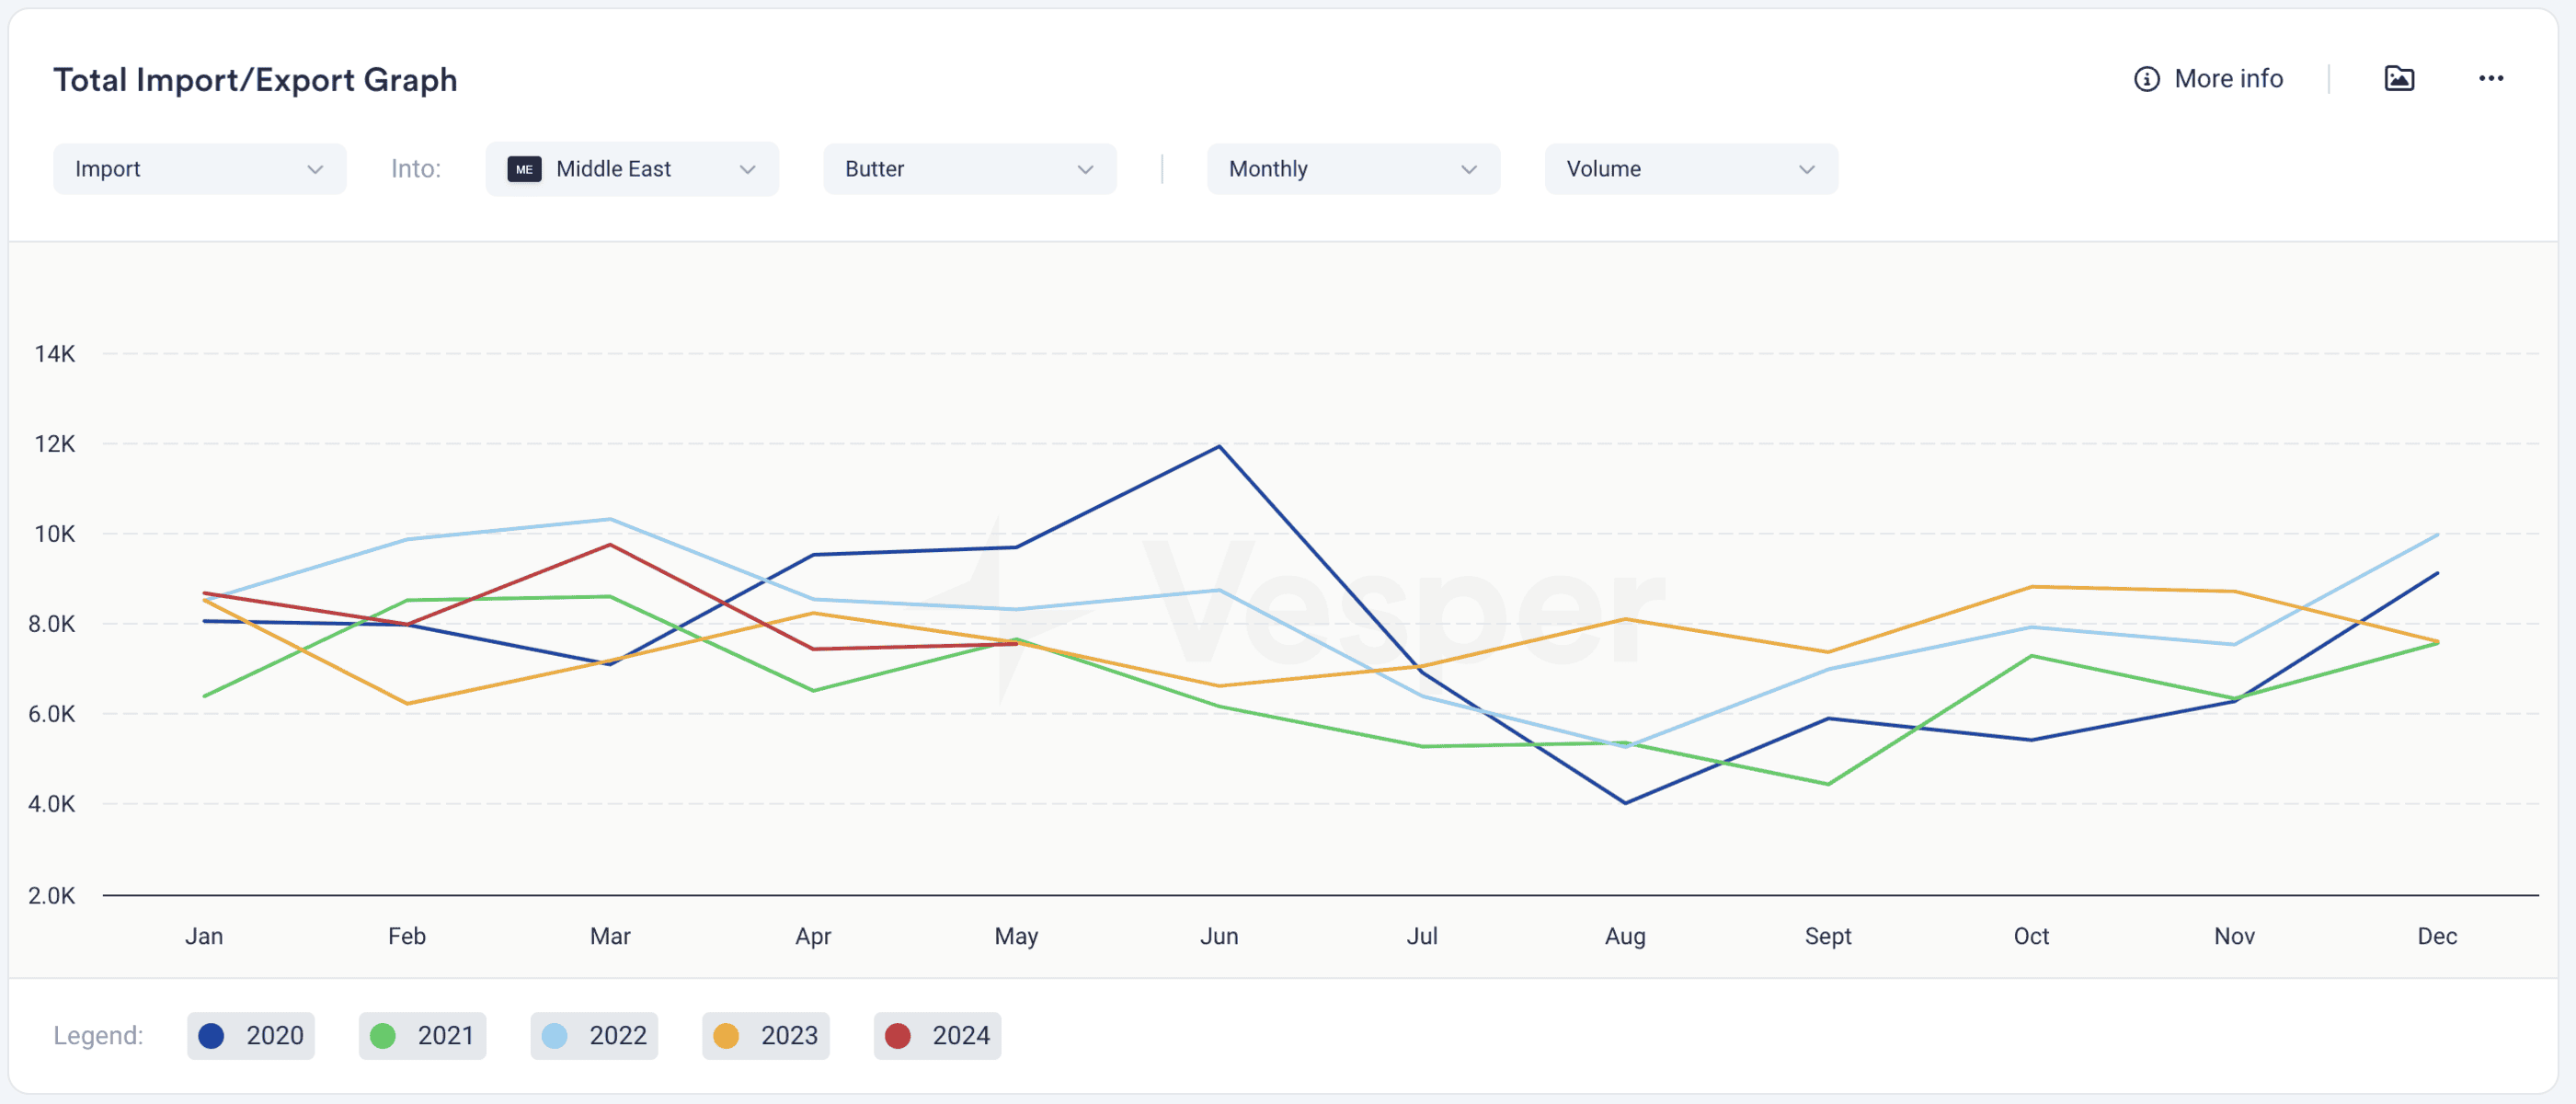
In this widget, you can view the historical import/export patterns of a product from a specific country or region across the past five years. You will be able to see monthly import or export data for a region/country and a single product. These products are based on HS Codes.
You can change the visualisation of the data in the graph by time period:
You can also change the visualisation of the data by the following metrics:
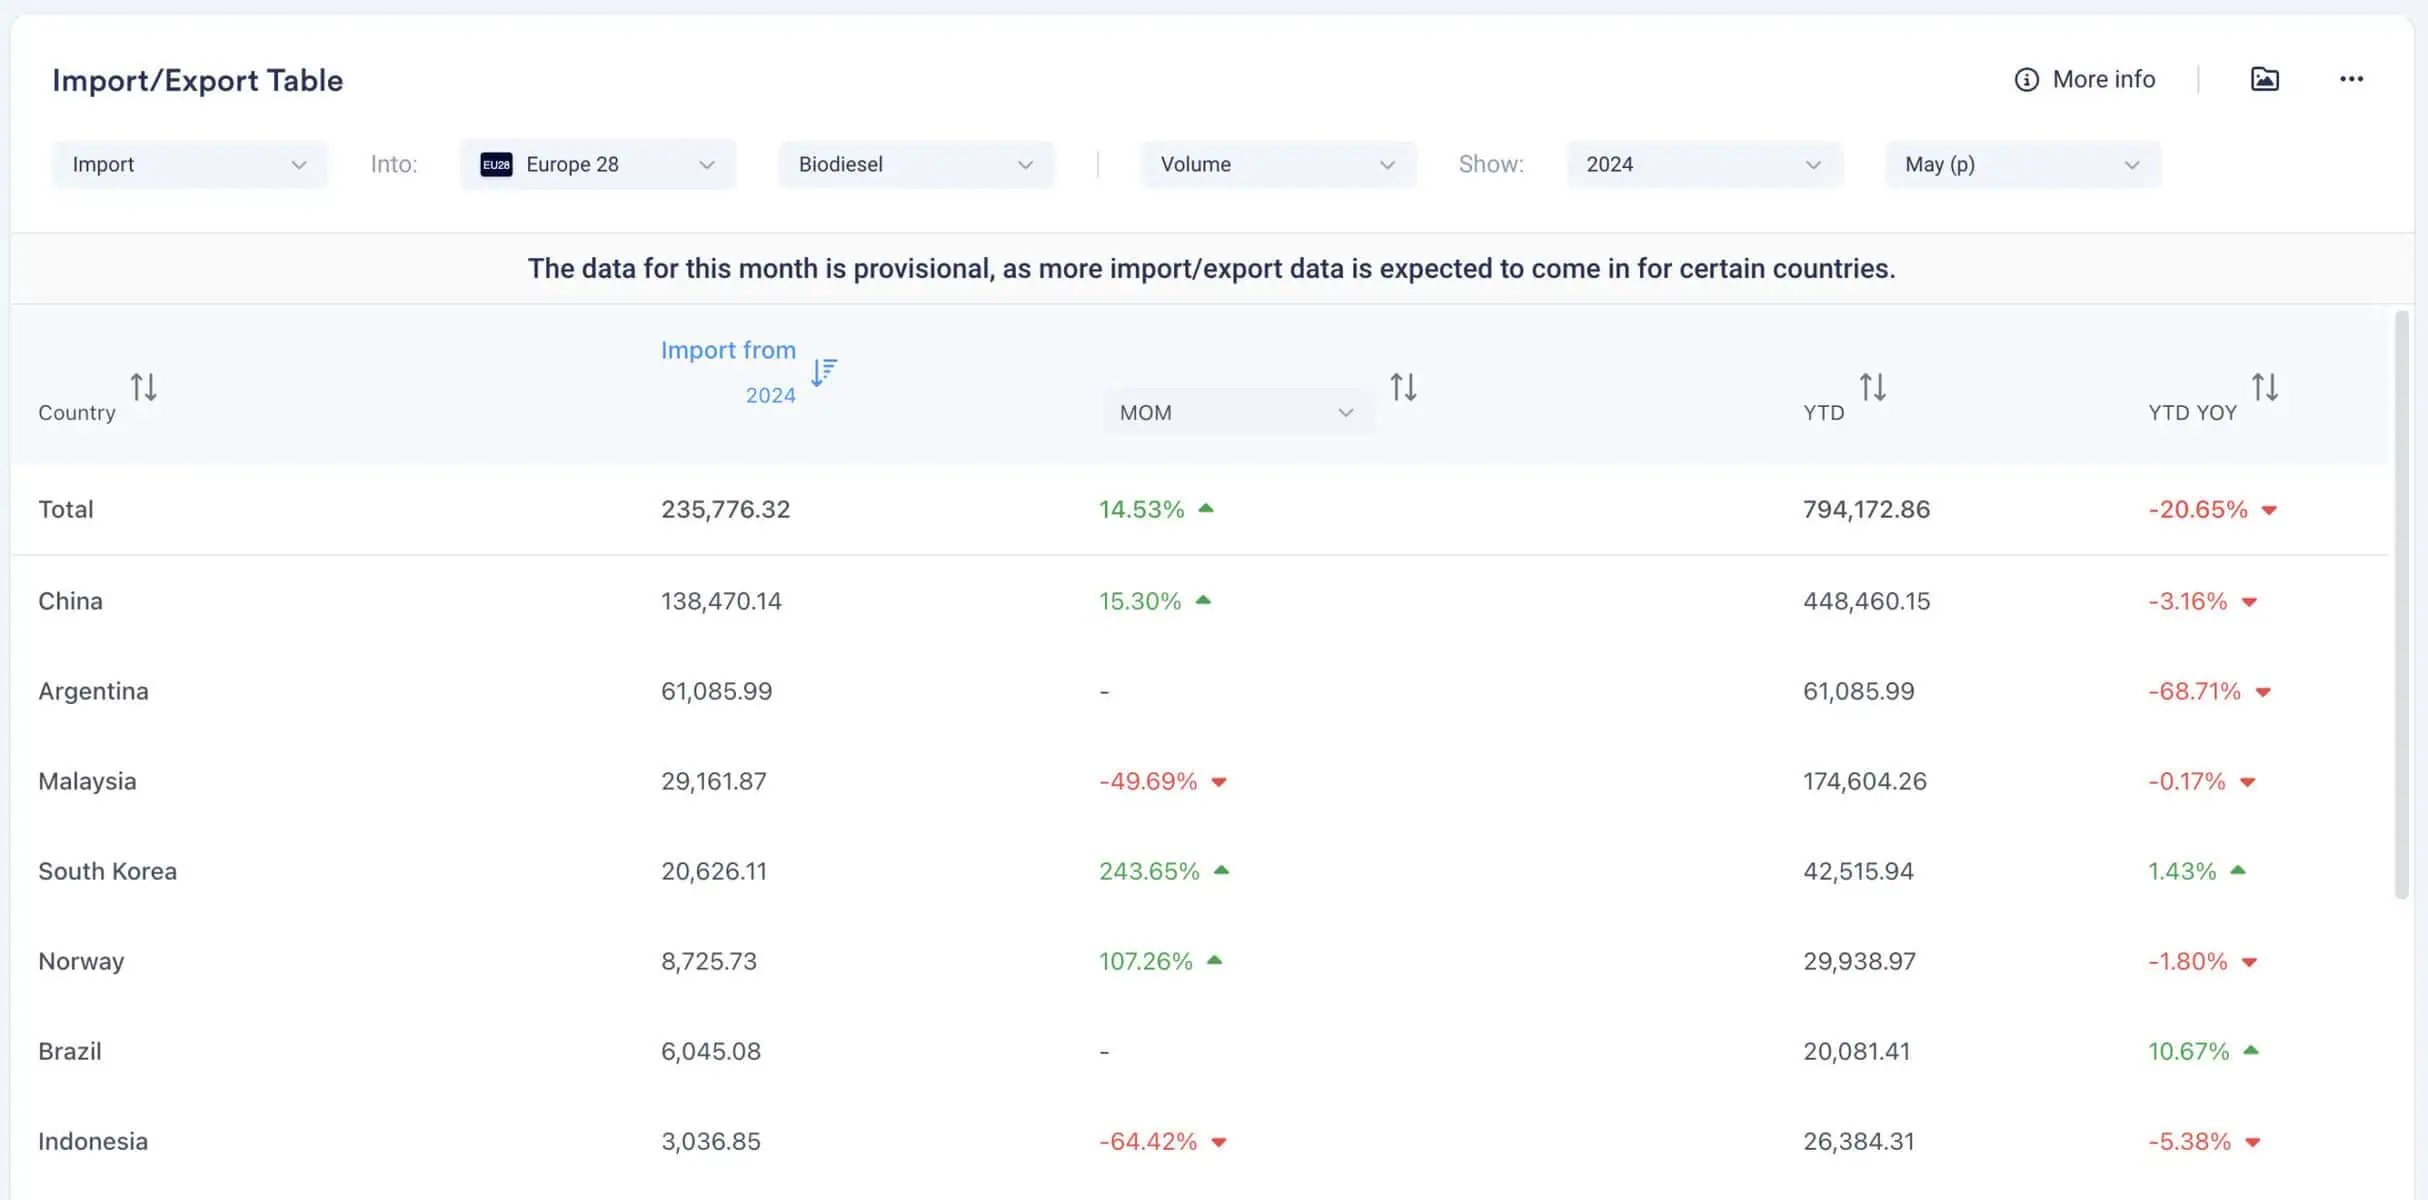
Our Import/Export Table provides a more detailed view of the countries that contributed to the import/export of a product from a specific country or region. This table displays the monthly trade data from all countries for a product for the selected month and the YTD.
You can change the visualisation of the data by the following metrics:
You can change the visualisation of the data by time period:
You can sort the table by:
The trade data of the latest month available should be considered provisional, as more trade data regarding this month can still come in.
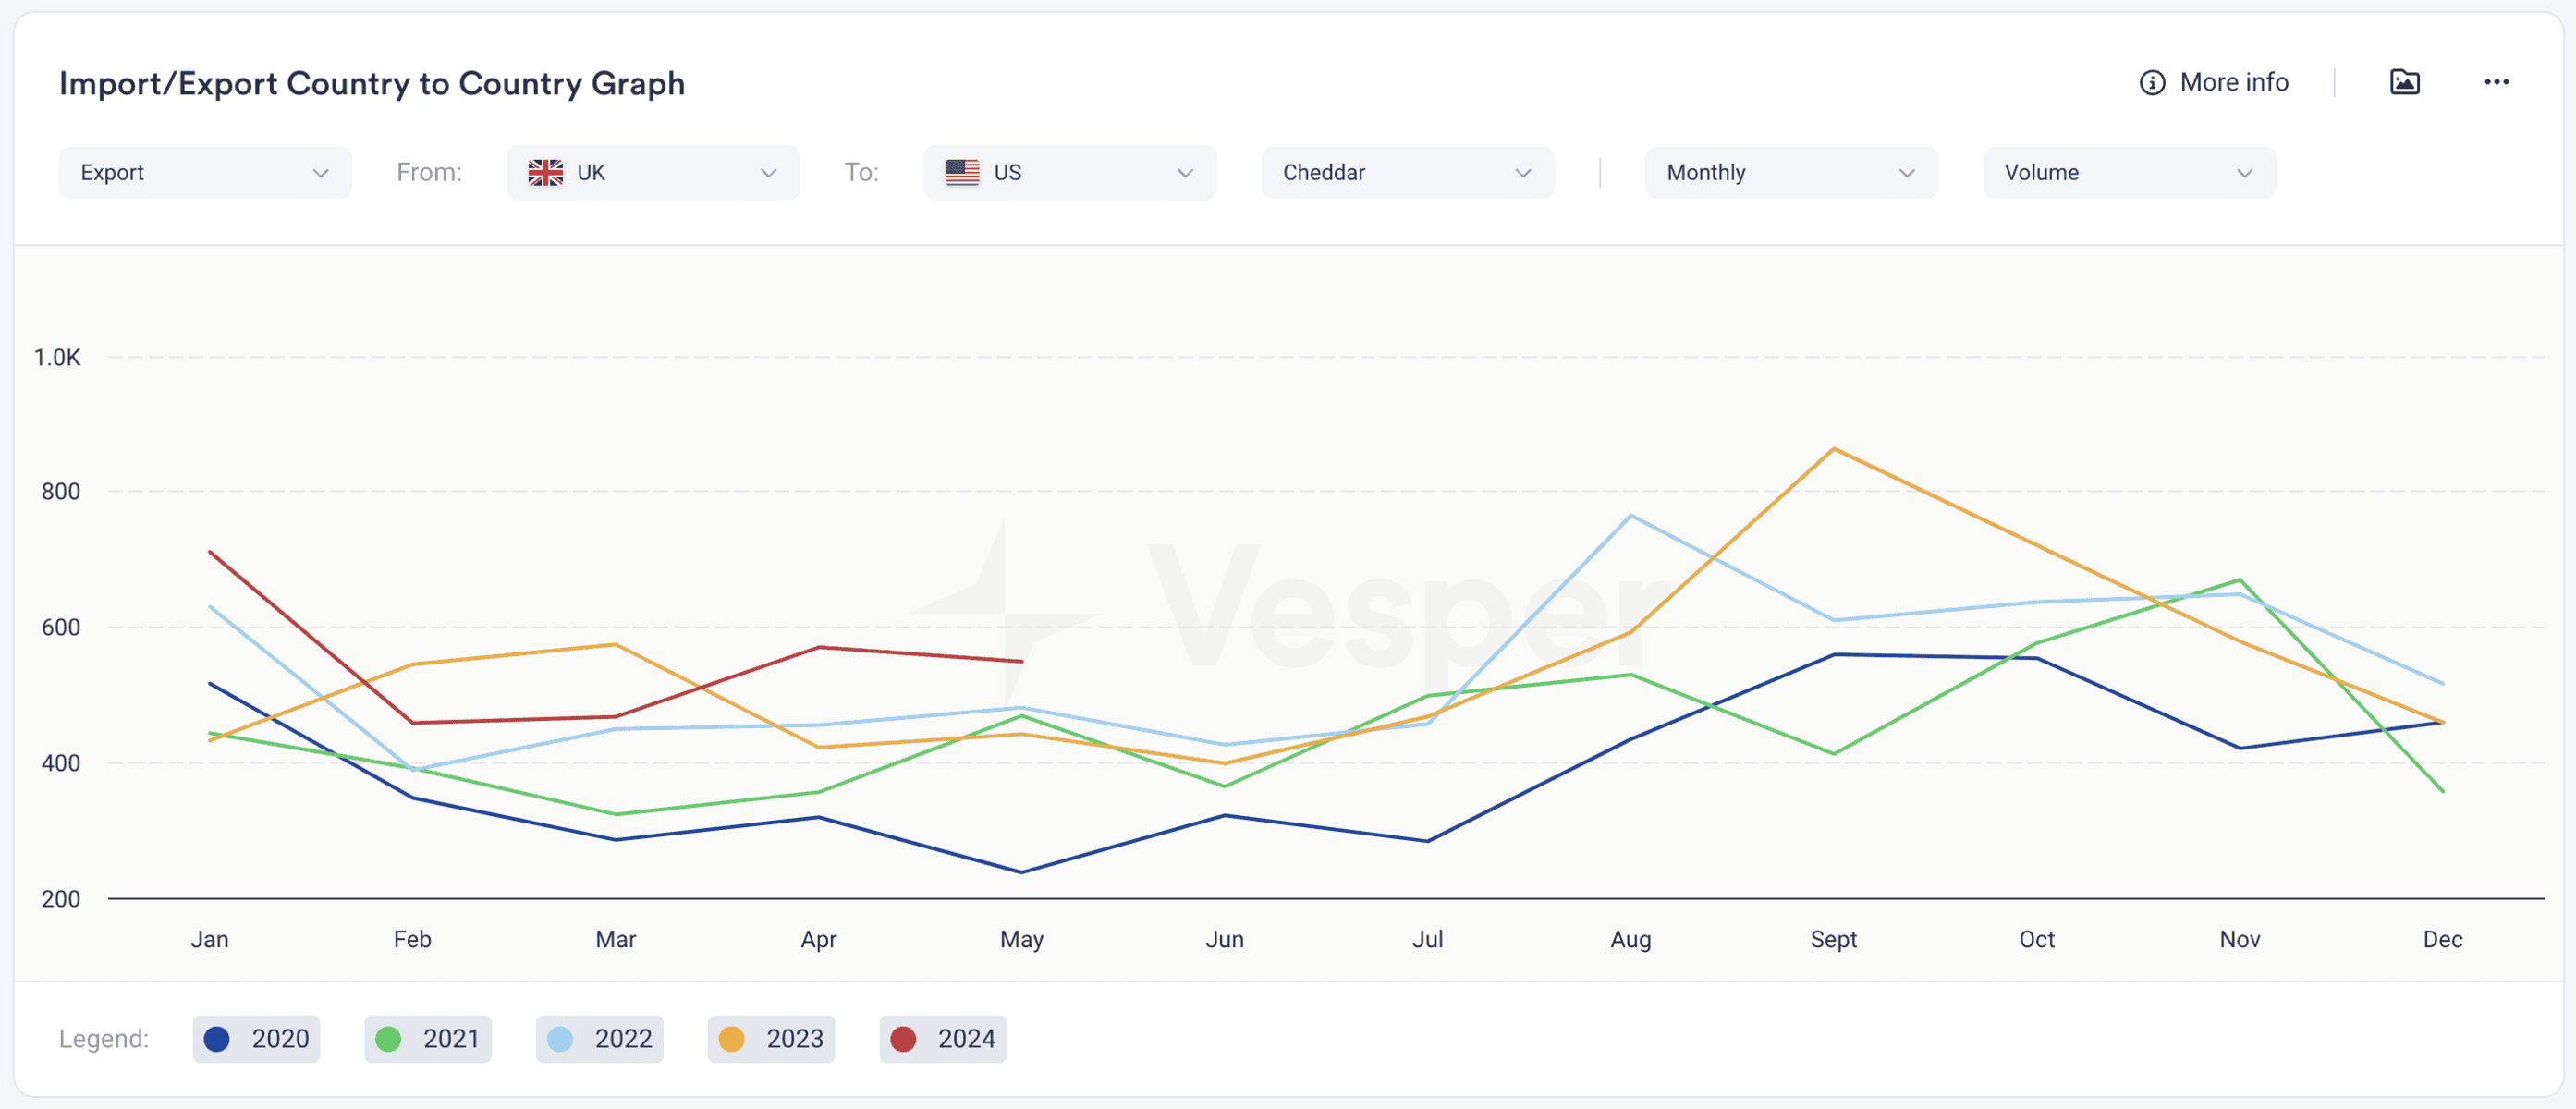
The Import/Export Country to Country Graph displays the historical trade patterns between two countries, showing data for a product via a specific trade route.
You can change the visualisation of the data in the graph by time period:
You can change the visualisation of the data by the following metrics:
For these three choices, you can see the:
You can also change the visualisation of the data by the following metrics:
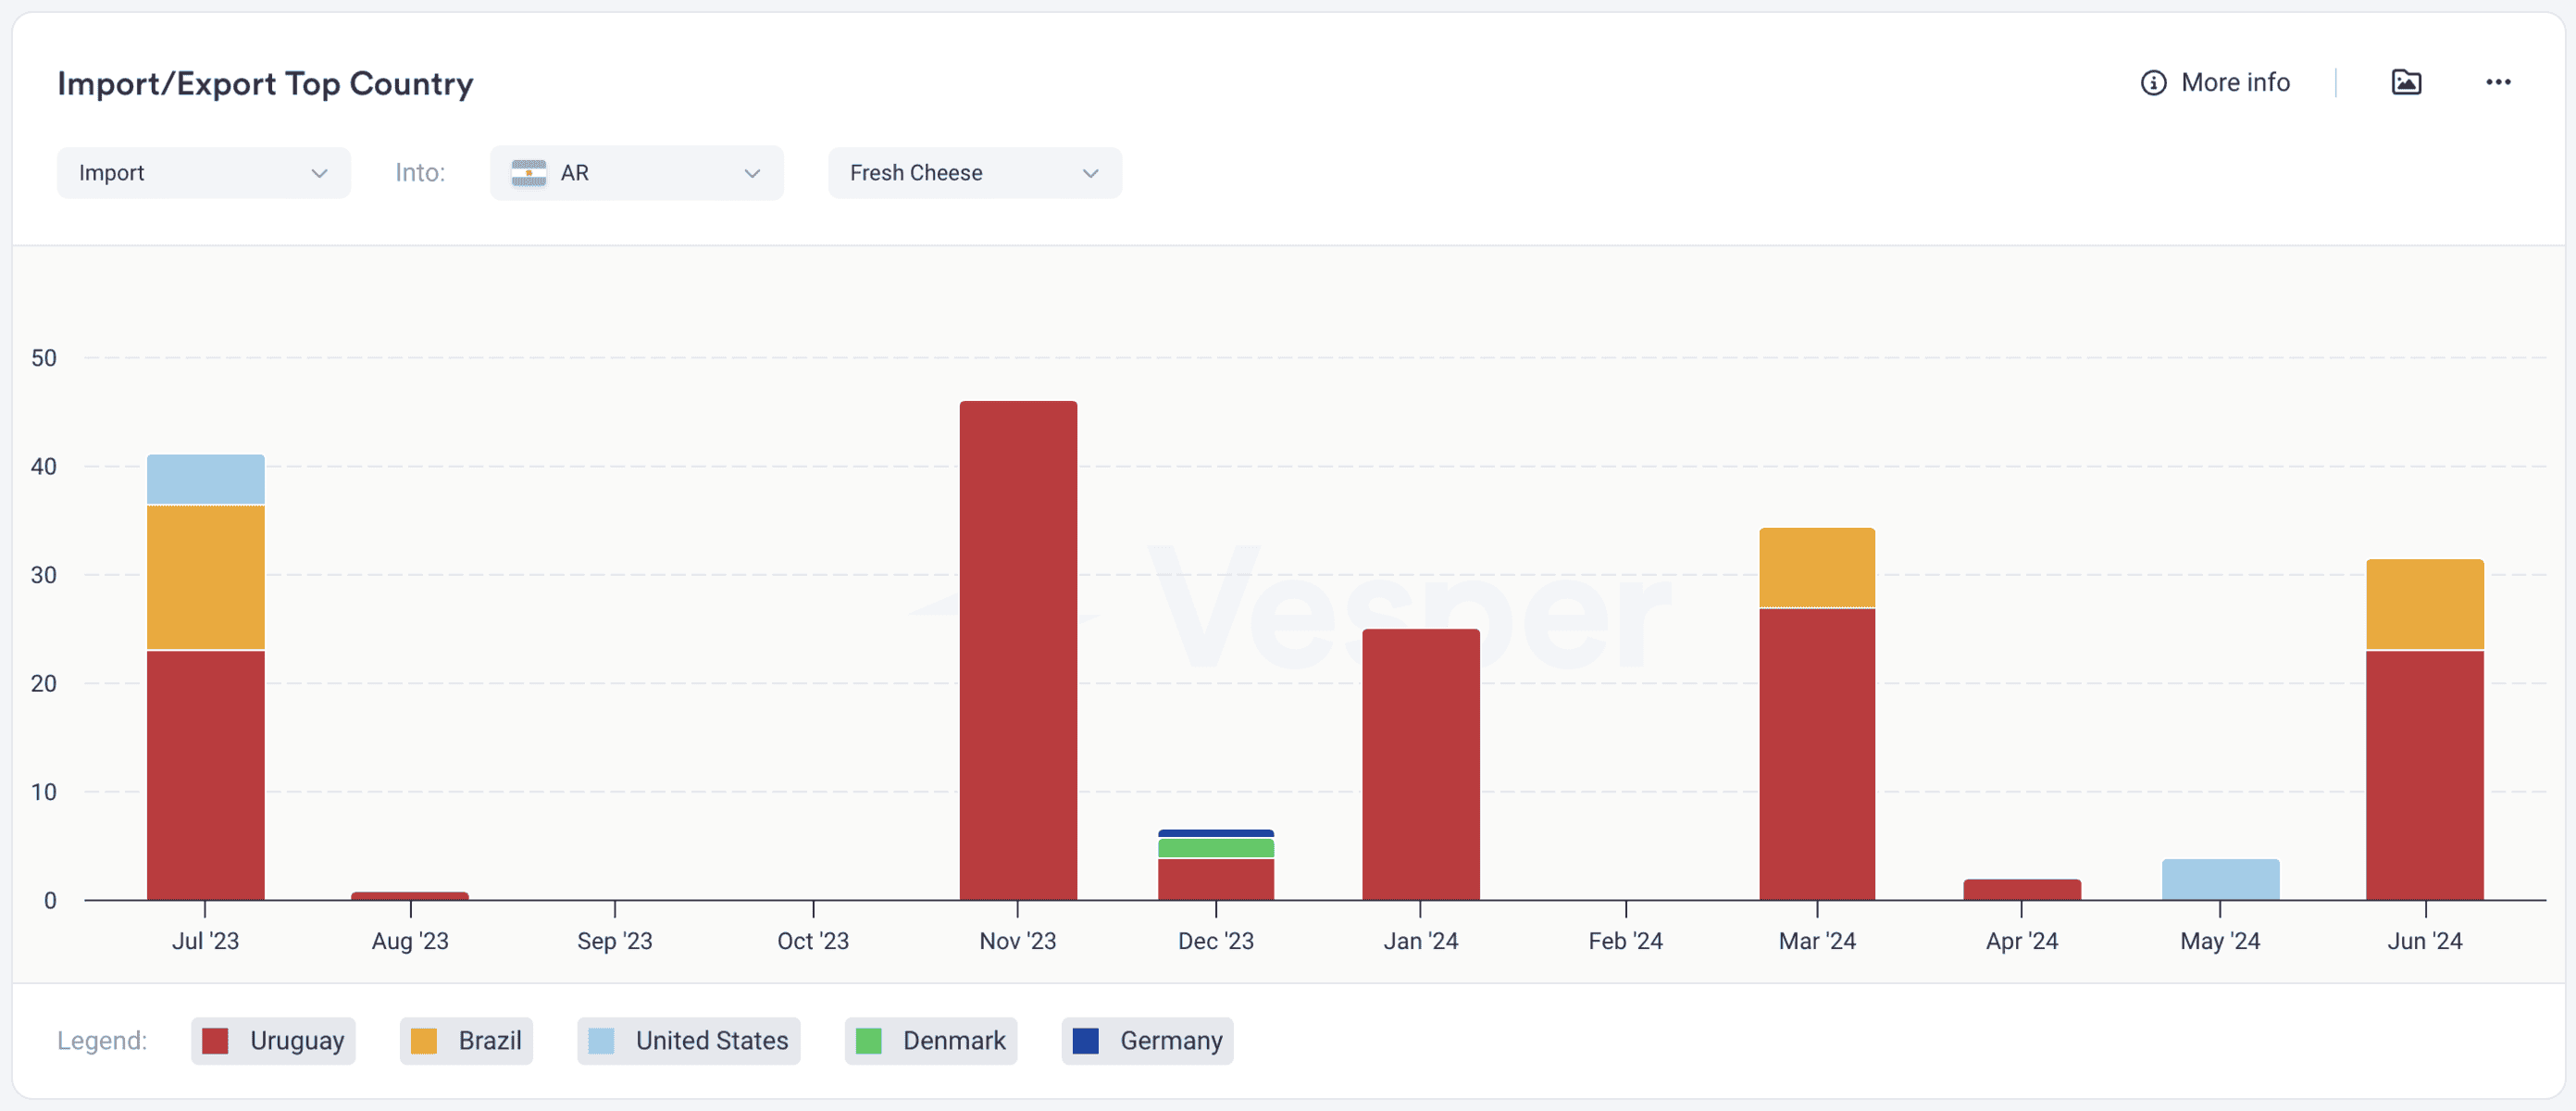
The Import/Export Top Countries graph allows you to explore the top importing or exporting countries for a product within a specific country or region.
You can define whether you are interested in:
When hovering over a specific country in the graph, you can view the following information:
The legend showing which country corresponds to each colour is at the bottom of the graph. If you want to examine fewer countries, you can deselect them by clicking on their names.
Gain earlier insights into import/export data with our Vessel Lineup table for Oils & Fats.
A procurement manager at an FMCG company can utilise import/export data to identify the best sources for raw materials. By analyzing the data, they can find countries that offer high-quality materials at competitive prices, ensuring cost-effective procurement strategies.
A sales manager can leverage import/export data to target new markets. By identifying countries with increasing demand for products, they can tailor sales strategies to expand the company’s market reach and boost revenue.
A market analyst can use import/export data to analyse global trade patterns and their impact on commodity prices. This information helps in advising the company on strategic decisions regarding market entry, pricing strategies, and product development.
A risk manager can use import and export data to identify potential risks in the supply chain. By analysing the stability of supply sources and the volatility of demand in different markets, they can develop strategies to mitigate these risks.
A trader can utilise import and export data to make informed trading decisions. By understanding market demand and supply dynamics, they can identify profitable trading opportunities and optimise their trading strategies.
Quickly navigate this page
Was this information useful?
Share: