

Navigating Markets with Commodity Import and Export Data
Benefits of Understanding Commodity Import and Export Data
Track Global Trade Import and export data provides you with a comprehensive view of global market dynamics. By understanding trade flows, you can identify key markets, track international demand and supply, and make informed decisions based on global trends.
Strategic Trade Planning Access to detailed import and export data enables your business to develop strategic trade plans. This information helps in identifying profitable markets and improving trade routes, ensuring efficient and cost-effective operations.
Competitive Advantage Leveraging import and export data provides a competitive edge by identifying emerging markets and potential trade opportunities. Your business can stay ahead of competitors by adapting strategies to changing global trade patterns.
Get started with commodity import and export data widgets: step-by-step
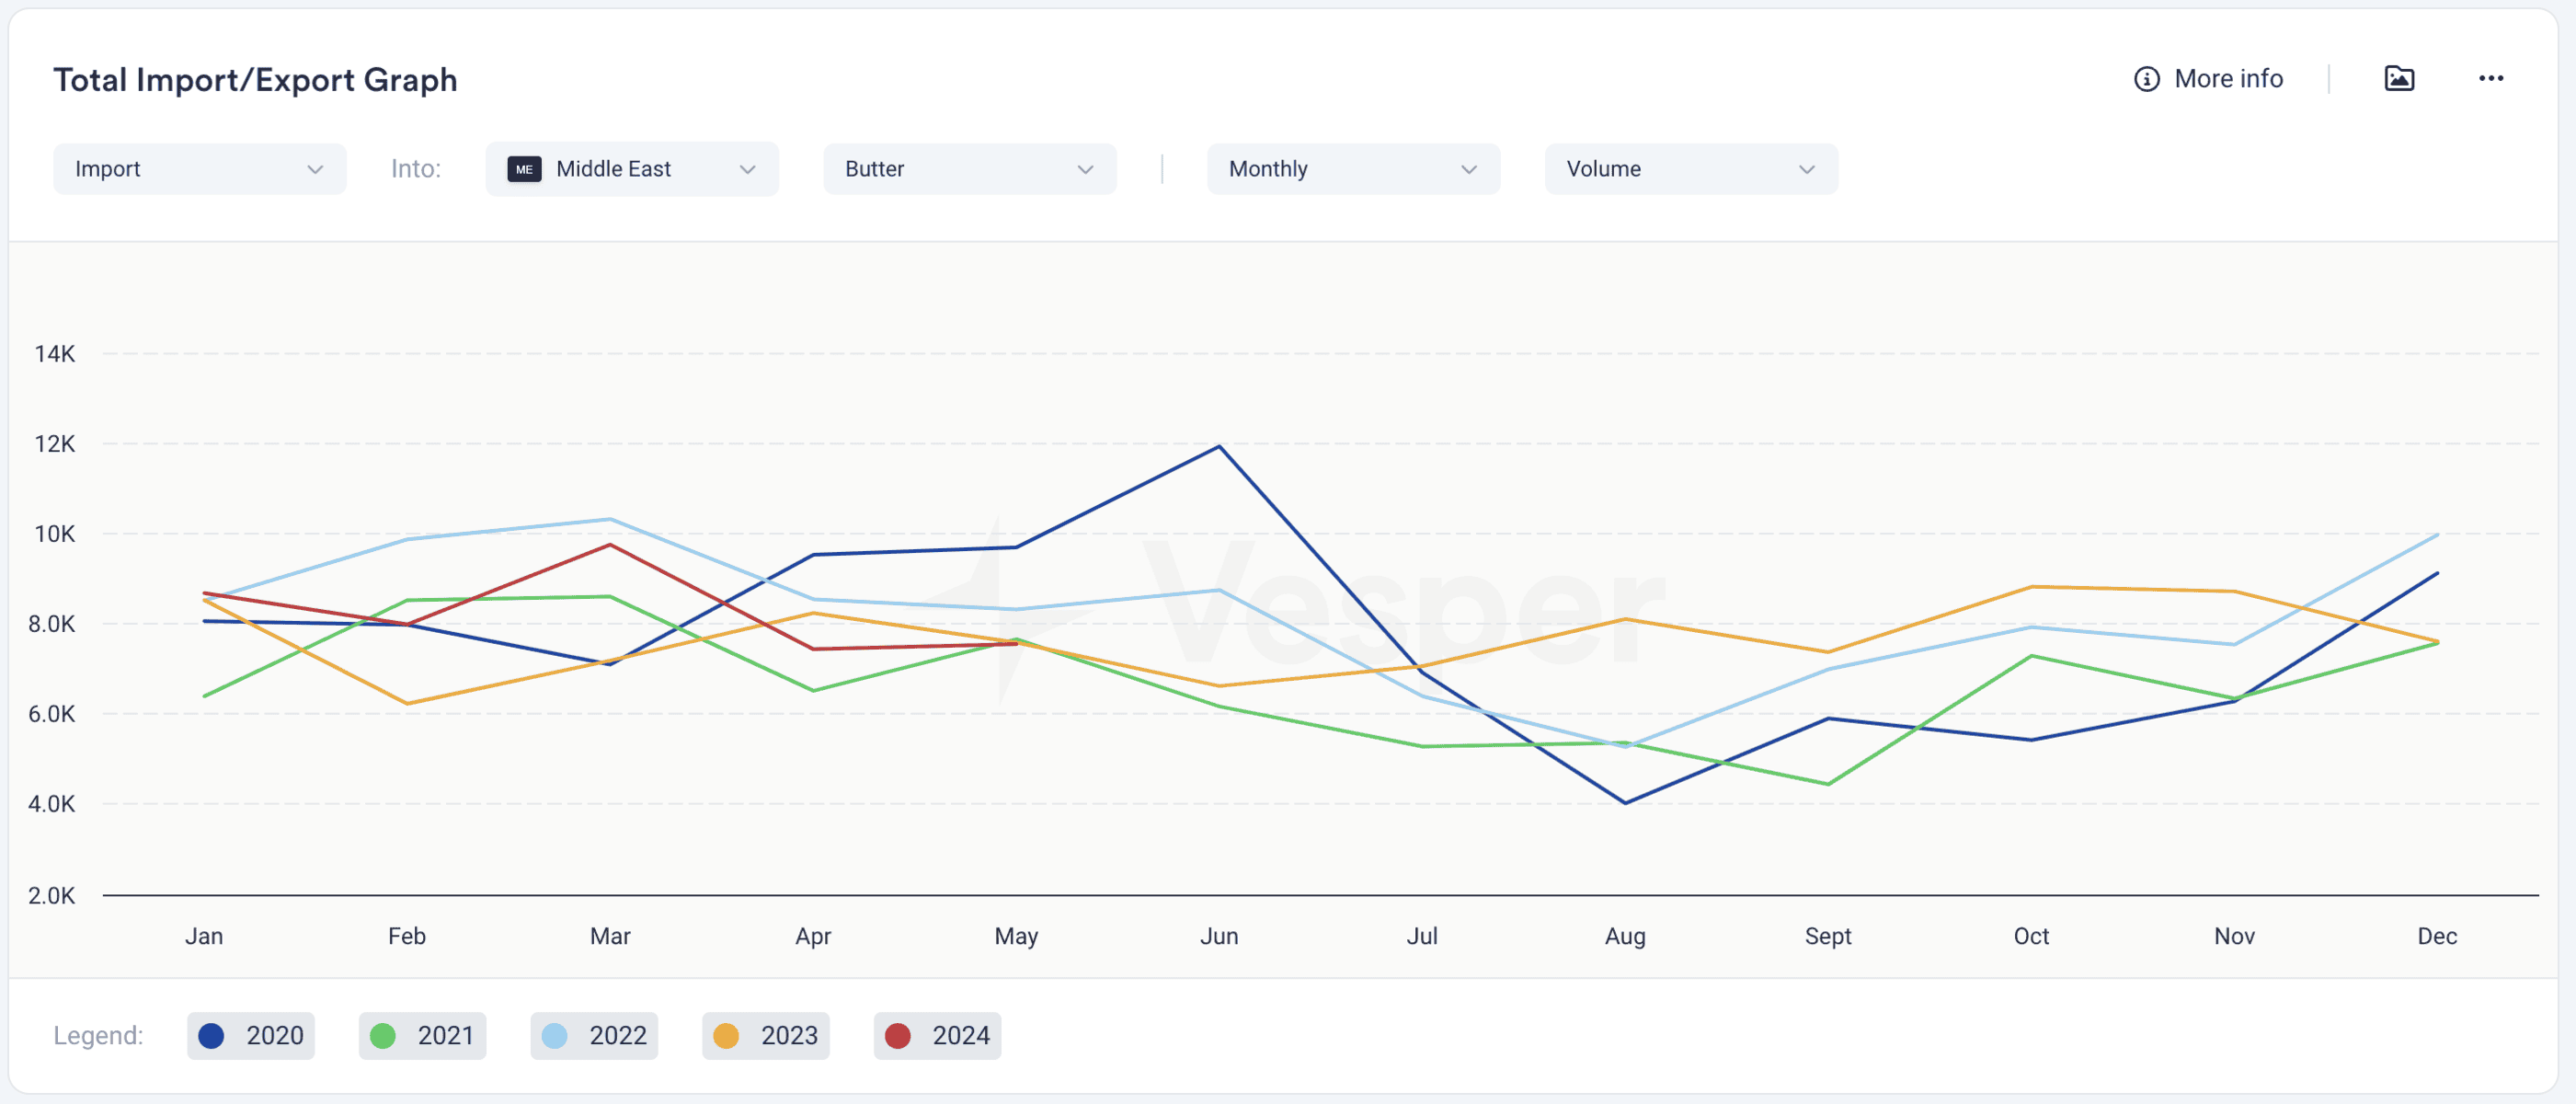
1. Explore the Commodity Total Import/Export Graph
In this widget, you can view the historical import/export patterns of a product from a specific country or region across the past five years. You will be able to see monthly import or export data for a region/country and a single product. These products are based on HS Codes.
You can change the visualisation of the data in the graph by time period:
- Monthly: the total amount of import/export per month
- YTD: the total import/export of all the months of the selected year up to that month
You can also change the visualisation of the data by the following metrics:
-
Volume: the total amount of import/export per month (in your mass or liquid setting) Volume MOM: the percentage change compared to the previous month
-
Volume YOY: the percentage change compared to the previous year
Value: the total value of the import/export per month (in your selected currency)
-
Value MOM: the percentage change compared to the previous month
-
Value YOY: the percentage change compared to the previous year
Price: the total import/export value divided by total import/export volume (not all commodities have this option)
-
Price MOM: the percentage change compared to the previous month
-
Price YOY: the percentage change compared to the previous year
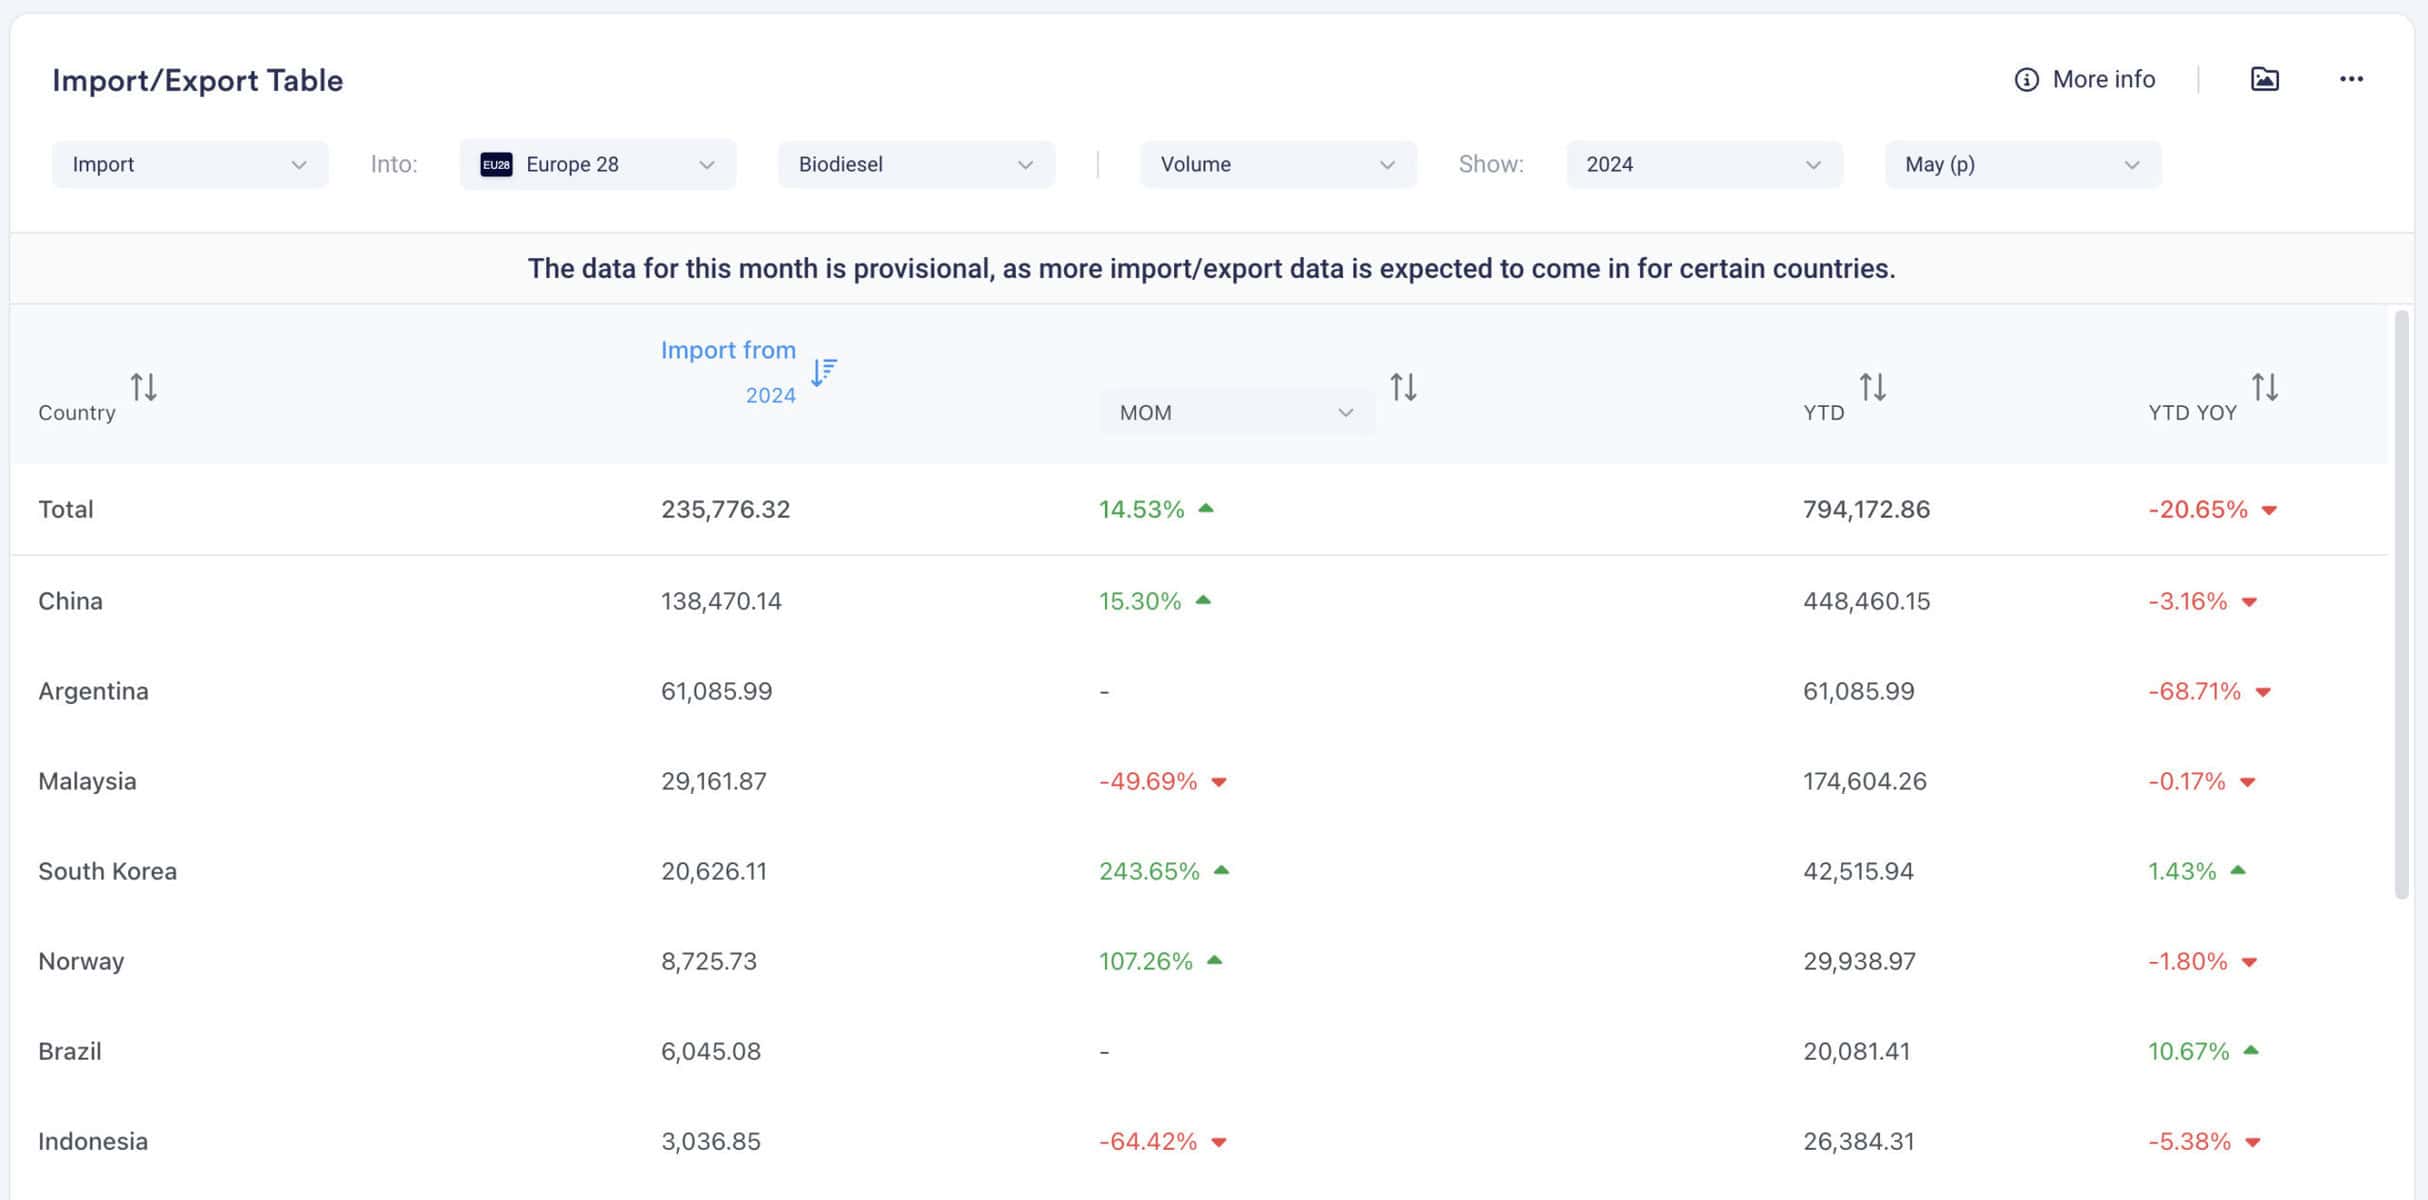
2. Explore the Commodity Import/Export Table
Our Import/Export Table provides a more detailed view of the countries that contributed to the import/export of a product from a specific country or region. This table displays the monthly trade data from all countries for a product for the selected month and the YTD.
You can change the visualisation of the data by the following metrics:
- Volume: the total amount of import/export per month (in your mass or liquid setting)
- Value: the total value of the import/export per month (in your selected currency)
- Price: the total import/export value divided by total import/export volume
You can change the visualisation of the data by time period:
- Year
- Month
You can sort the table by:
- Alphabetical order
- Highest importing/exporting country for that month
- Highest importing/exporting country YTD
The trade data of the latest month available should be considered provisional, as more trade data regarding this month can still come in.
3. Explore the Commodity Import/Export Country to Country Graph
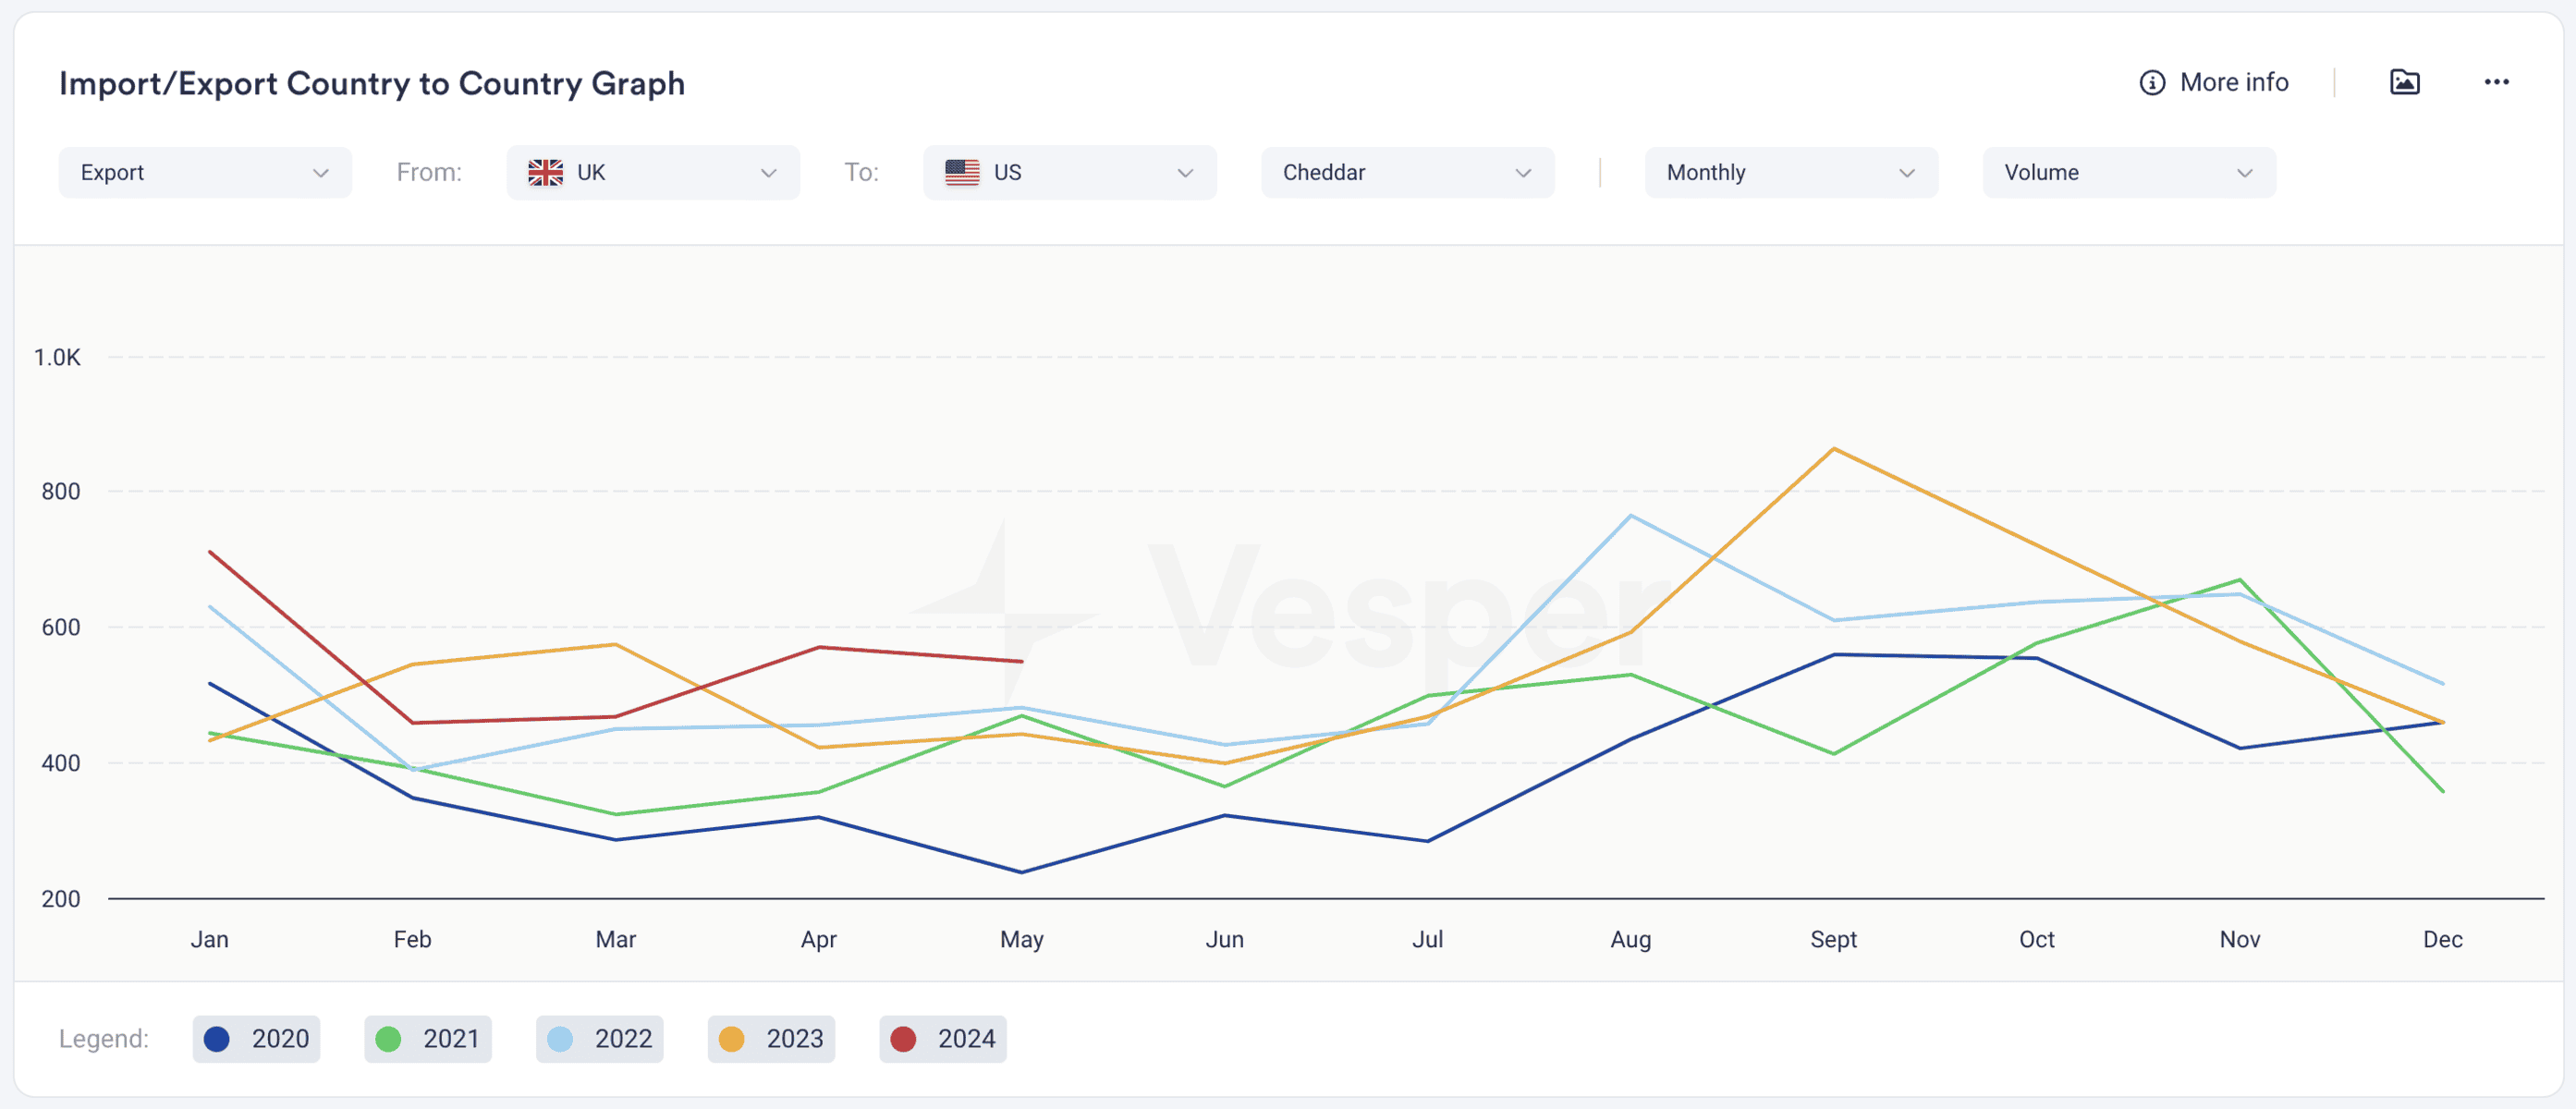
The Import/Export Country to Country Graph displays the historical trade patterns between two countries, showing data for a product via a specific trade route.
You can change the visualisation of the data in the graph by time period:
- Monthly: the total amount of import/export per month
- YTD: the total import/export of all the months of the selected year up to that month
You can change the visualisation of the data by the following metrics:
- Volume: the total amount of import/export per month (in mass or liquid setting)
- Value: the total value (in currency) of the import/export per month (in selected currency)
- Price: the total import/export value divided by total import/export volume
For these three choices, you can see the:
- MOM %: the percentage change compared to the previous month
- YOY %: the percentage change compared to the previous year
You can also change the visualisation of the data by the following metrics:
-
Volume: the total amount of import/export per month (in your mass or liquid setting) Volume YOY: the percentage change compared to the previous year
Value: the total value of the import/export per month (in your selected currency)
-
Value YOY: the percentage change compared to the previous year
4. Explore the Commodity Import/Export Top Country
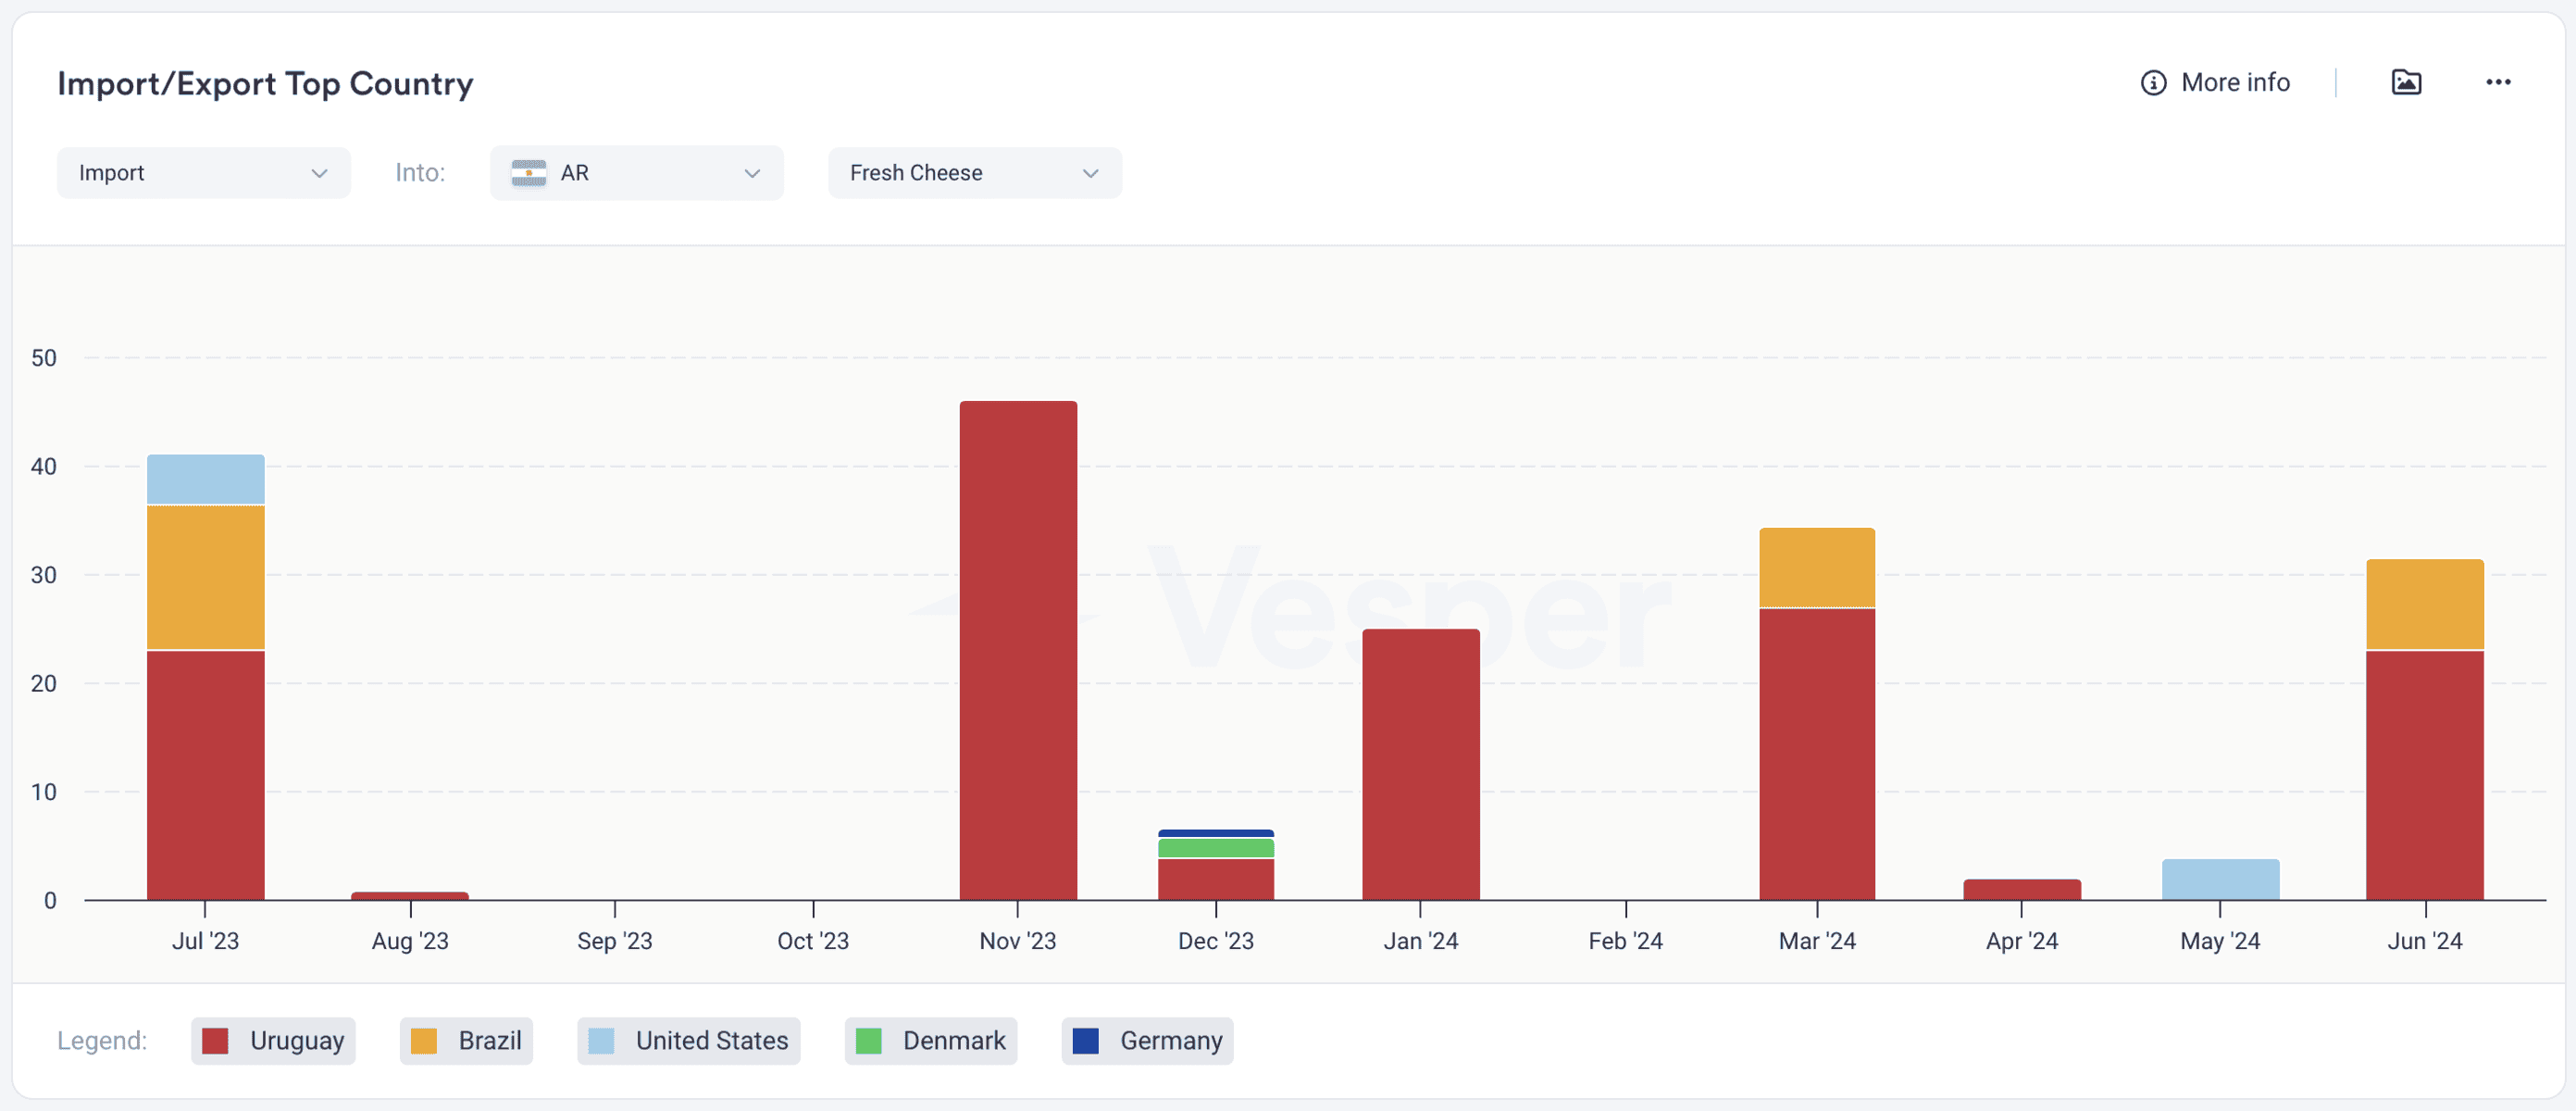
The Import/Export Top Countries graph allows you to explore the top importing or exporting countries for a product within a specific country or region.
You can define whether you are interested in:
- Export: Shows the top 10 countries the particular country exports to
- Import: Shows the top 10 countries the particular country imports from
When hovering over a specific country in the graph, you can view the following information:
- Country and date of the Import/Export
- Volume total for that country
- Percentage of total (all 10 countries) for that month
- YOY change for a specific data point
The legend showing which country corresponds to each colour is at the bottom of the graph. If you want to examine fewer countries, you can deselect them by clicking on their names.
5. Explore the Vessel Lineup Table
Gain earlier insights into import/export data with our Vessel Lineup table for Oils & Fats.
Use cases for Import/Export data
Procurement Manager
A procurement manager at an FMCG company can utilise import/export data to identify the best sources for raw materials. By analyzing the data, they can find countries that offer high-quality materials at competitive prices, ensuring cost-effective procurement strategies.
Sales Manager
A sales manager can leverage import/export data to target new markets. By identifying countries with increasing demand for products, they can tailor sales strategies to expand the company’s market reach and boost revenue.
Market Analyst
A market analyst can use import/export data to analyse global trade patterns and their impact on commodity prices. This information helps in advising the company on strategic decisions regarding market entry, pricing strategies, and product development.
Risk Manager
A risk manager can use import and export data to identify potential risks in the supply chain. By analysing the stability of supply sources and the volatility of demand in different markets, they can develop strategies to mitigate these risks.
Trader
A trader can utilise import and export data to make informed trading decisions. By understanding market demand and supply dynamics, they can identify profitable trading opportunities and optimise their trading strategies.
Frequently asked questions
What can commodity import and export data actually tell a procurement team?
It reveals global trade flows so you can see which countries supply or demand a product and how those volumes shift over time. That helps you identify reliable sourcing origins, spot emerging markets, and read shifts in international supply and demand before they show up in your contract prices. It turns trade movements into a planning signal rather than hindsight.
How is a product identified in the import and export widgets?
Products are mapped to HS Codes, the international Harmonized System classification used in customs data worldwide. Because HS Codes are standardised across countries, you can compare the same product consistently across origins and destinations. The widgets let you view a single product for a chosen country or region, then break the flows down monthly or year to date.
Which metrics can I view, and what is the difference between volume, value, and price?
You can switch between volume (total quantity in your mass or liquid setting), value (total worth in your chosen currency), and price (value divided by volume). Each can be shown month over month or year over year to highlight percentage changes. Reading them together separates a genuine demand shift from a pure price effect, sharpening your supply and demand read.
How can a risk manager use this trade data to protect the supply chain?
By examining the stability of supply origins and demand volatility across destination markets, a risk manager can flag concentration risk and brittle routes early. The Country to Country and Top Country views show how dependent a flow is on one partner, so you can plan alternative sources before a disruption forces a costly scramble.