

Gaining a Competitive Edge with Commodity Production Volumes
Benefits of Understanding Commodity Production Volumes
Market Insight and Seasonality Understanding commodity production volumes offers deep insights into market dynamics and product seasonality. By analysing production data, users can gauge supply levels, predict shortages or surpluses, and make strategic decisions based on comprehensive market intelligence.
Supply Chain Optimisation Access to production volumes enables businesses to optimise their supply chains. Knowing where and how much of a commodity is being produced helps in planning logistics, sourcing strategies, and ensuring a steady supply of raw materials.
Strategic Sourcing Decisions With detailed production volume data, users can make informed sourcing decisions. This helps in identifying the most reliable suppliers and regions with stable production, reducing risks associated with supply disruptions.
Tracking commodity production volume: step-by-step
1. Use the product filter
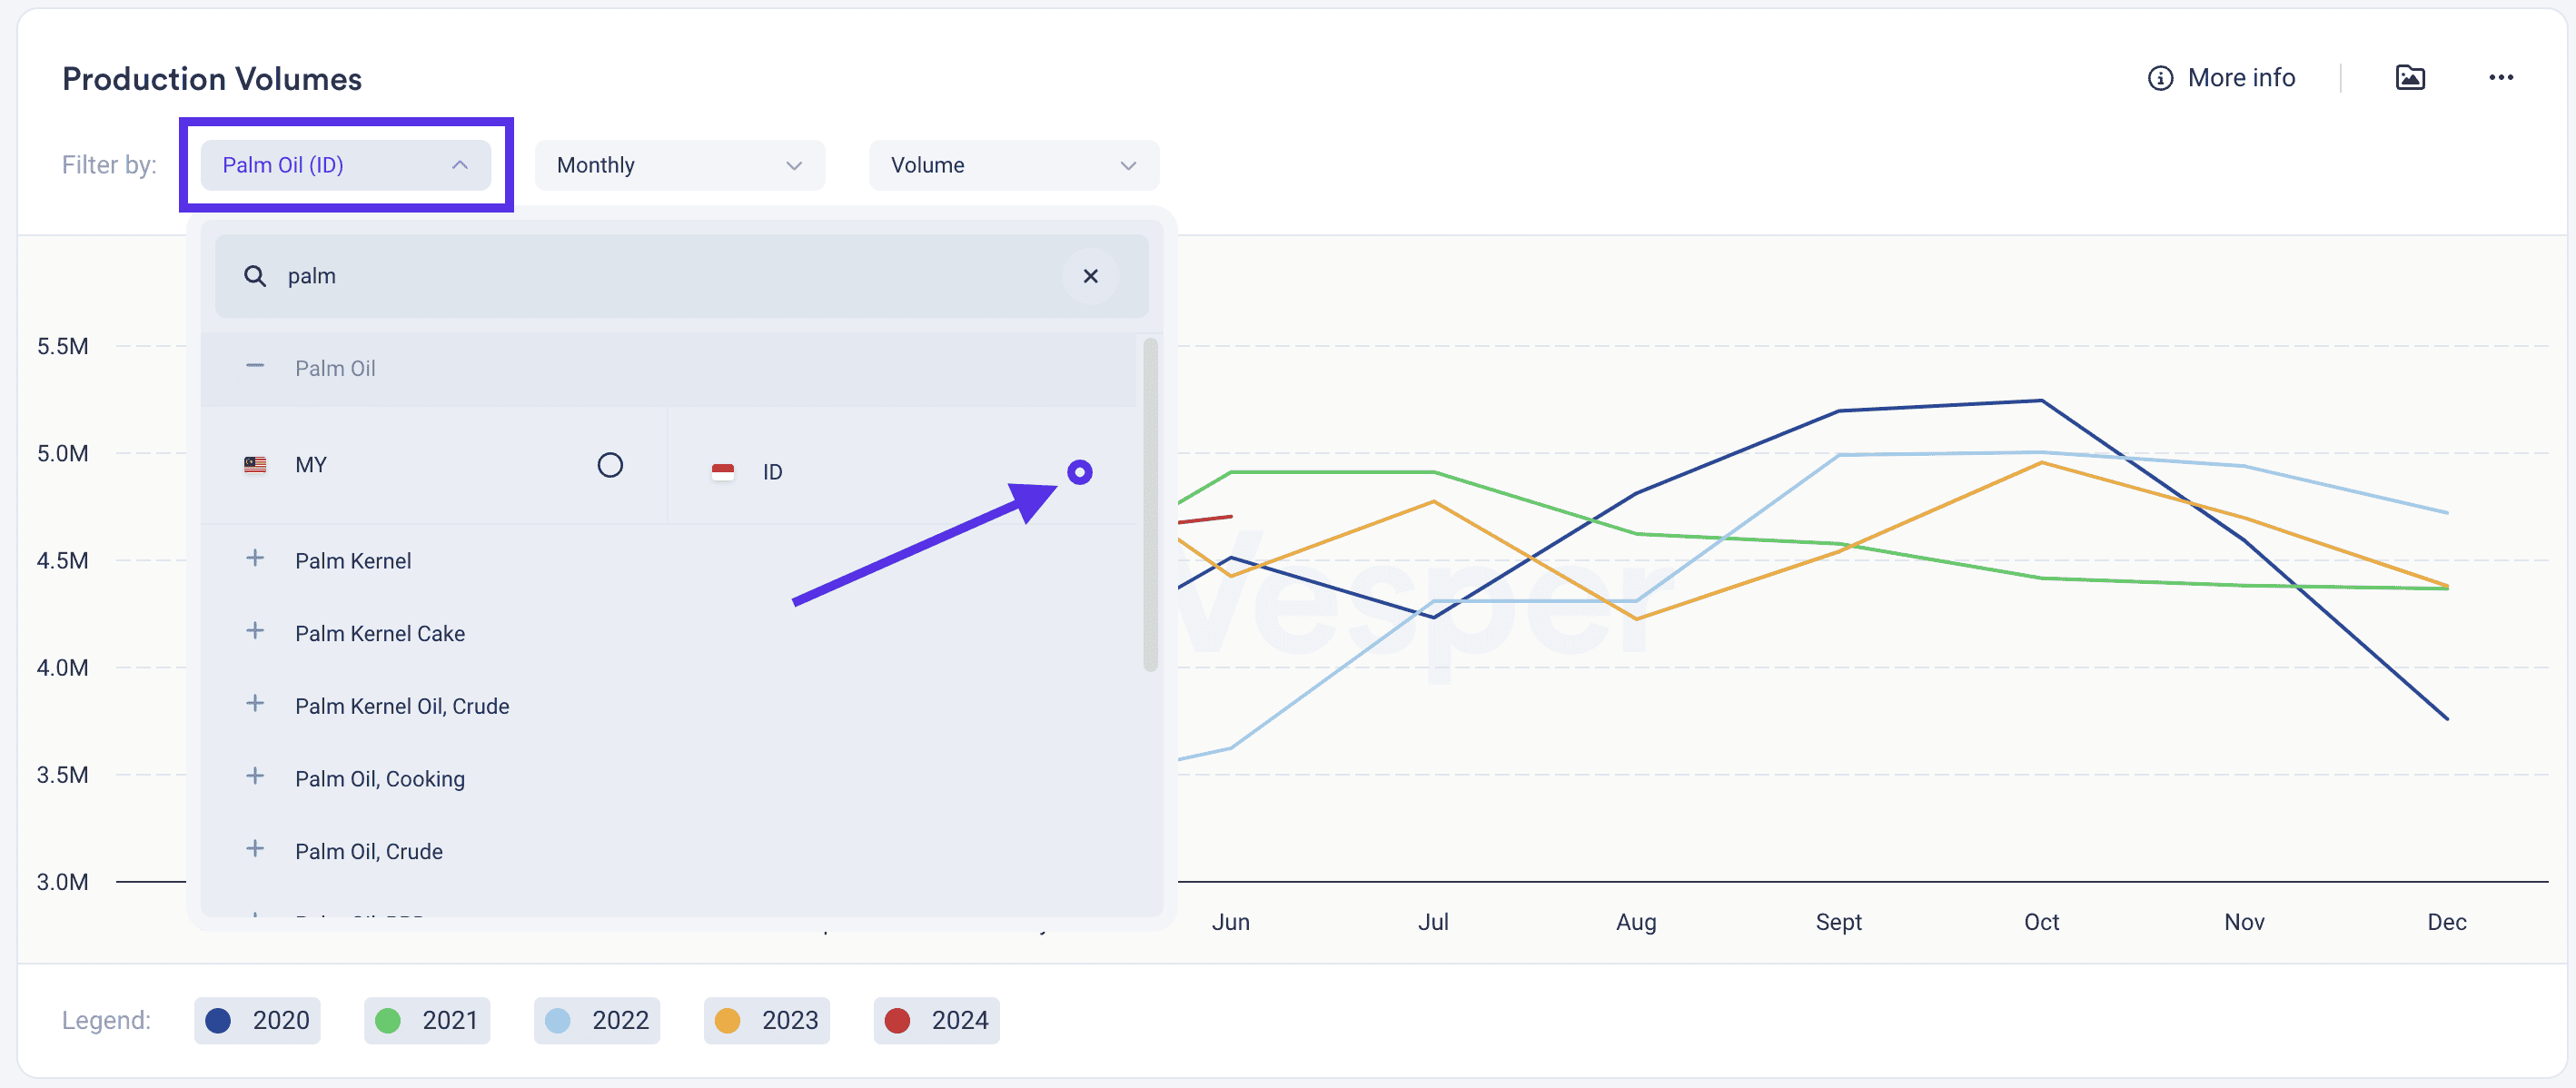
In your production widget, use the filter, as shown in the screenshot below, to select the product of your choice.
In our example, we are looking at Palm Oil in Indonesia.
2. Other filters to analyze the data
You have two options to change the visualisation of the production data in the graph.
You can change the visualisation of the data in the graph by time period:
- Monthly: the total amount of production per month
- YTD: the total production of all the months of the selected year up to that month
You can also change the visualisation of the data by the following metrics:
- Volume: the total amount of production per month
- MOM %: the percentage change compared to the previous month
- YOY %: the percentage change compared to the previous year
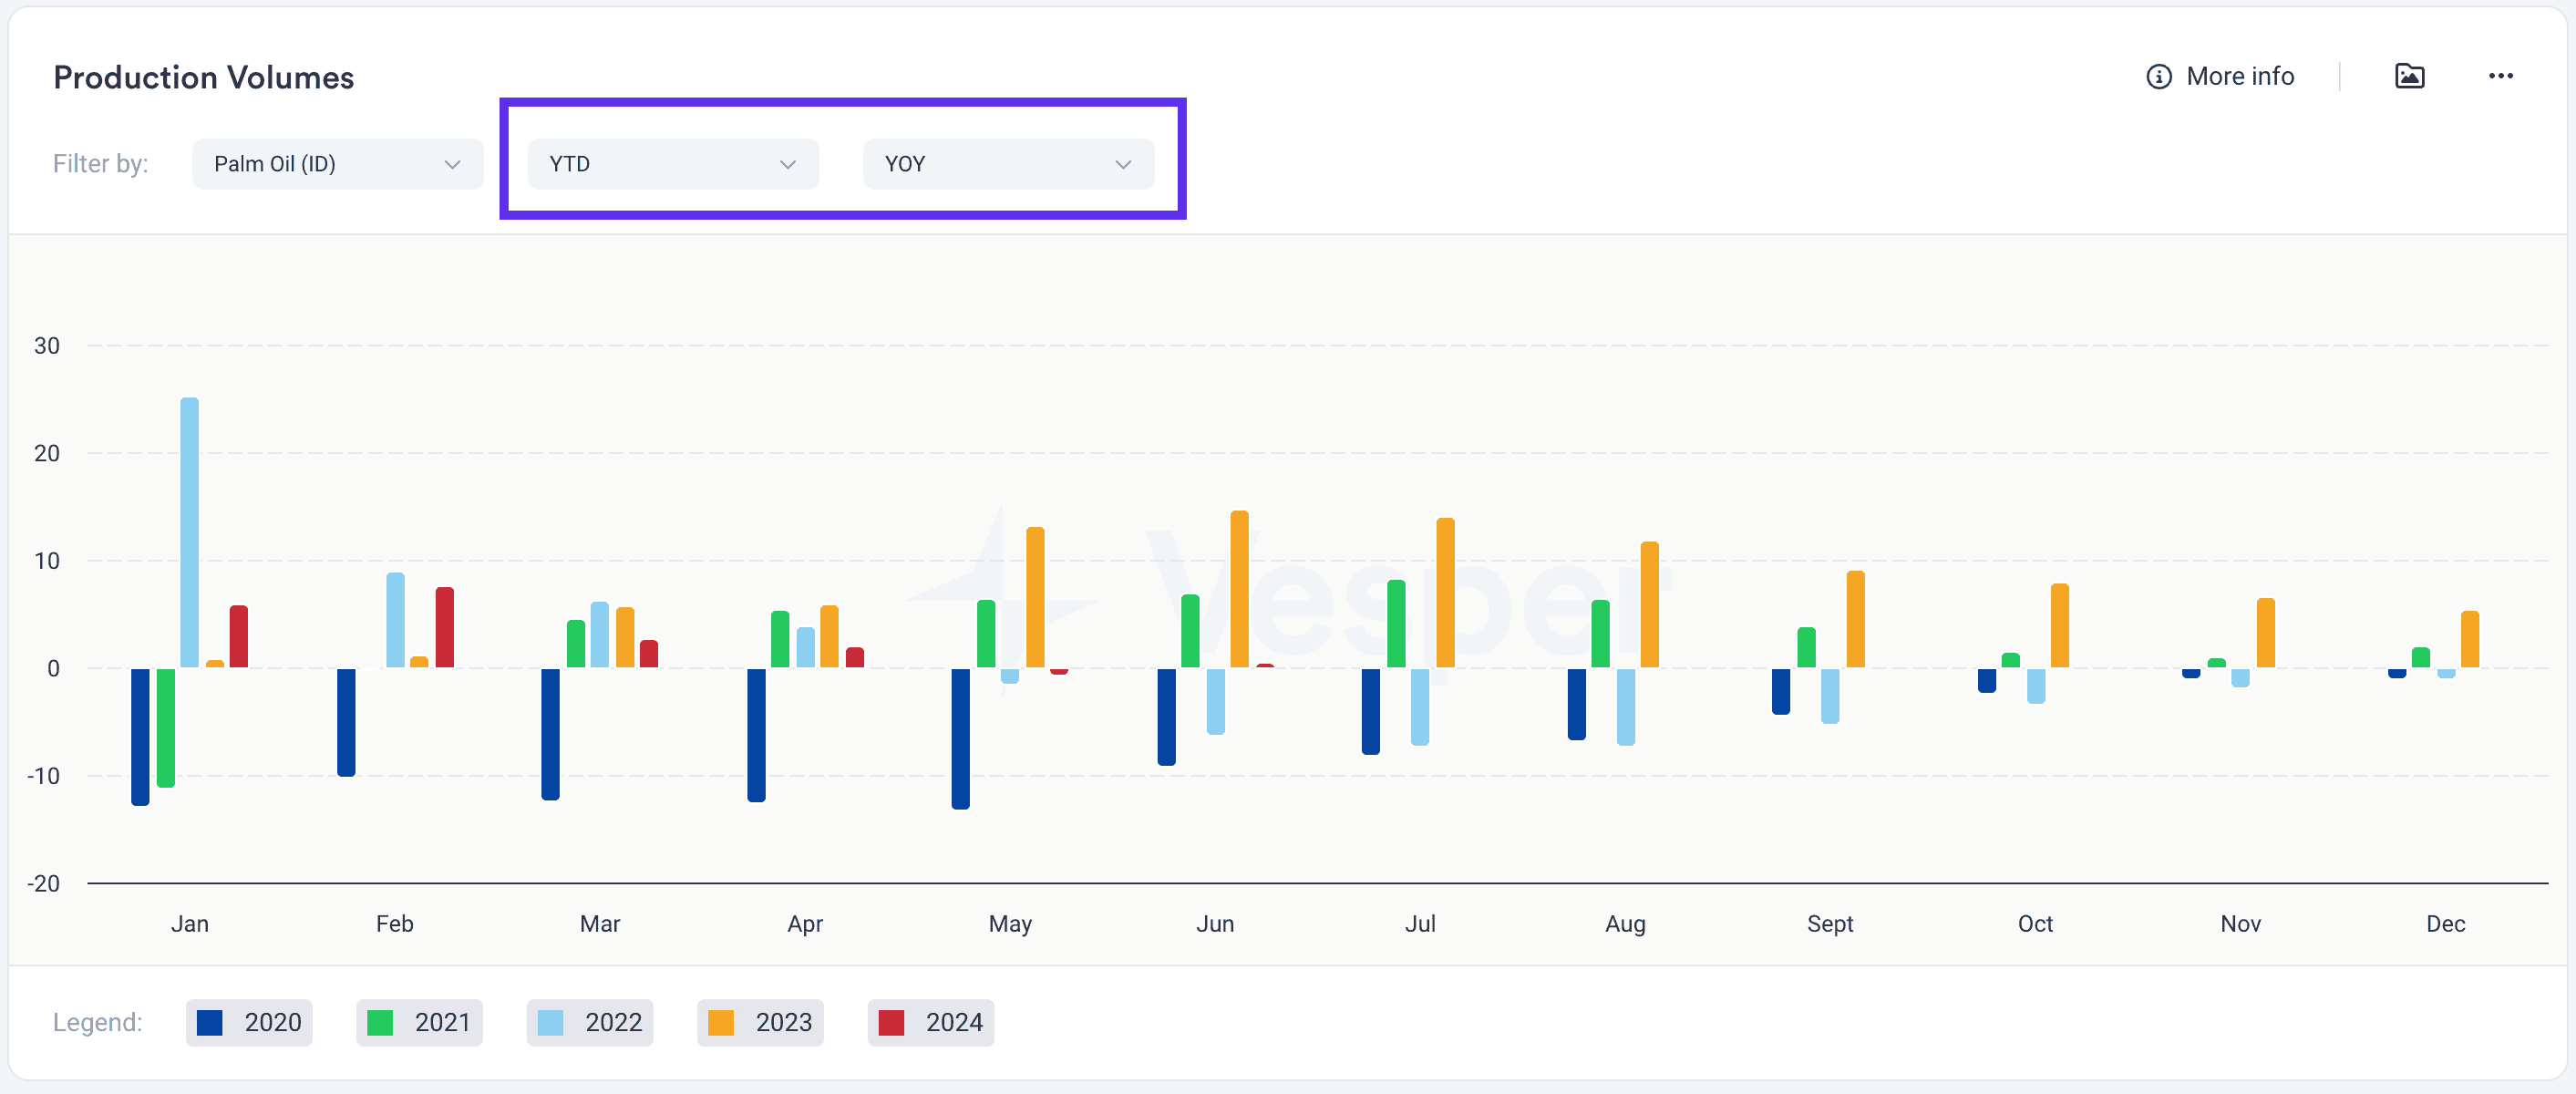
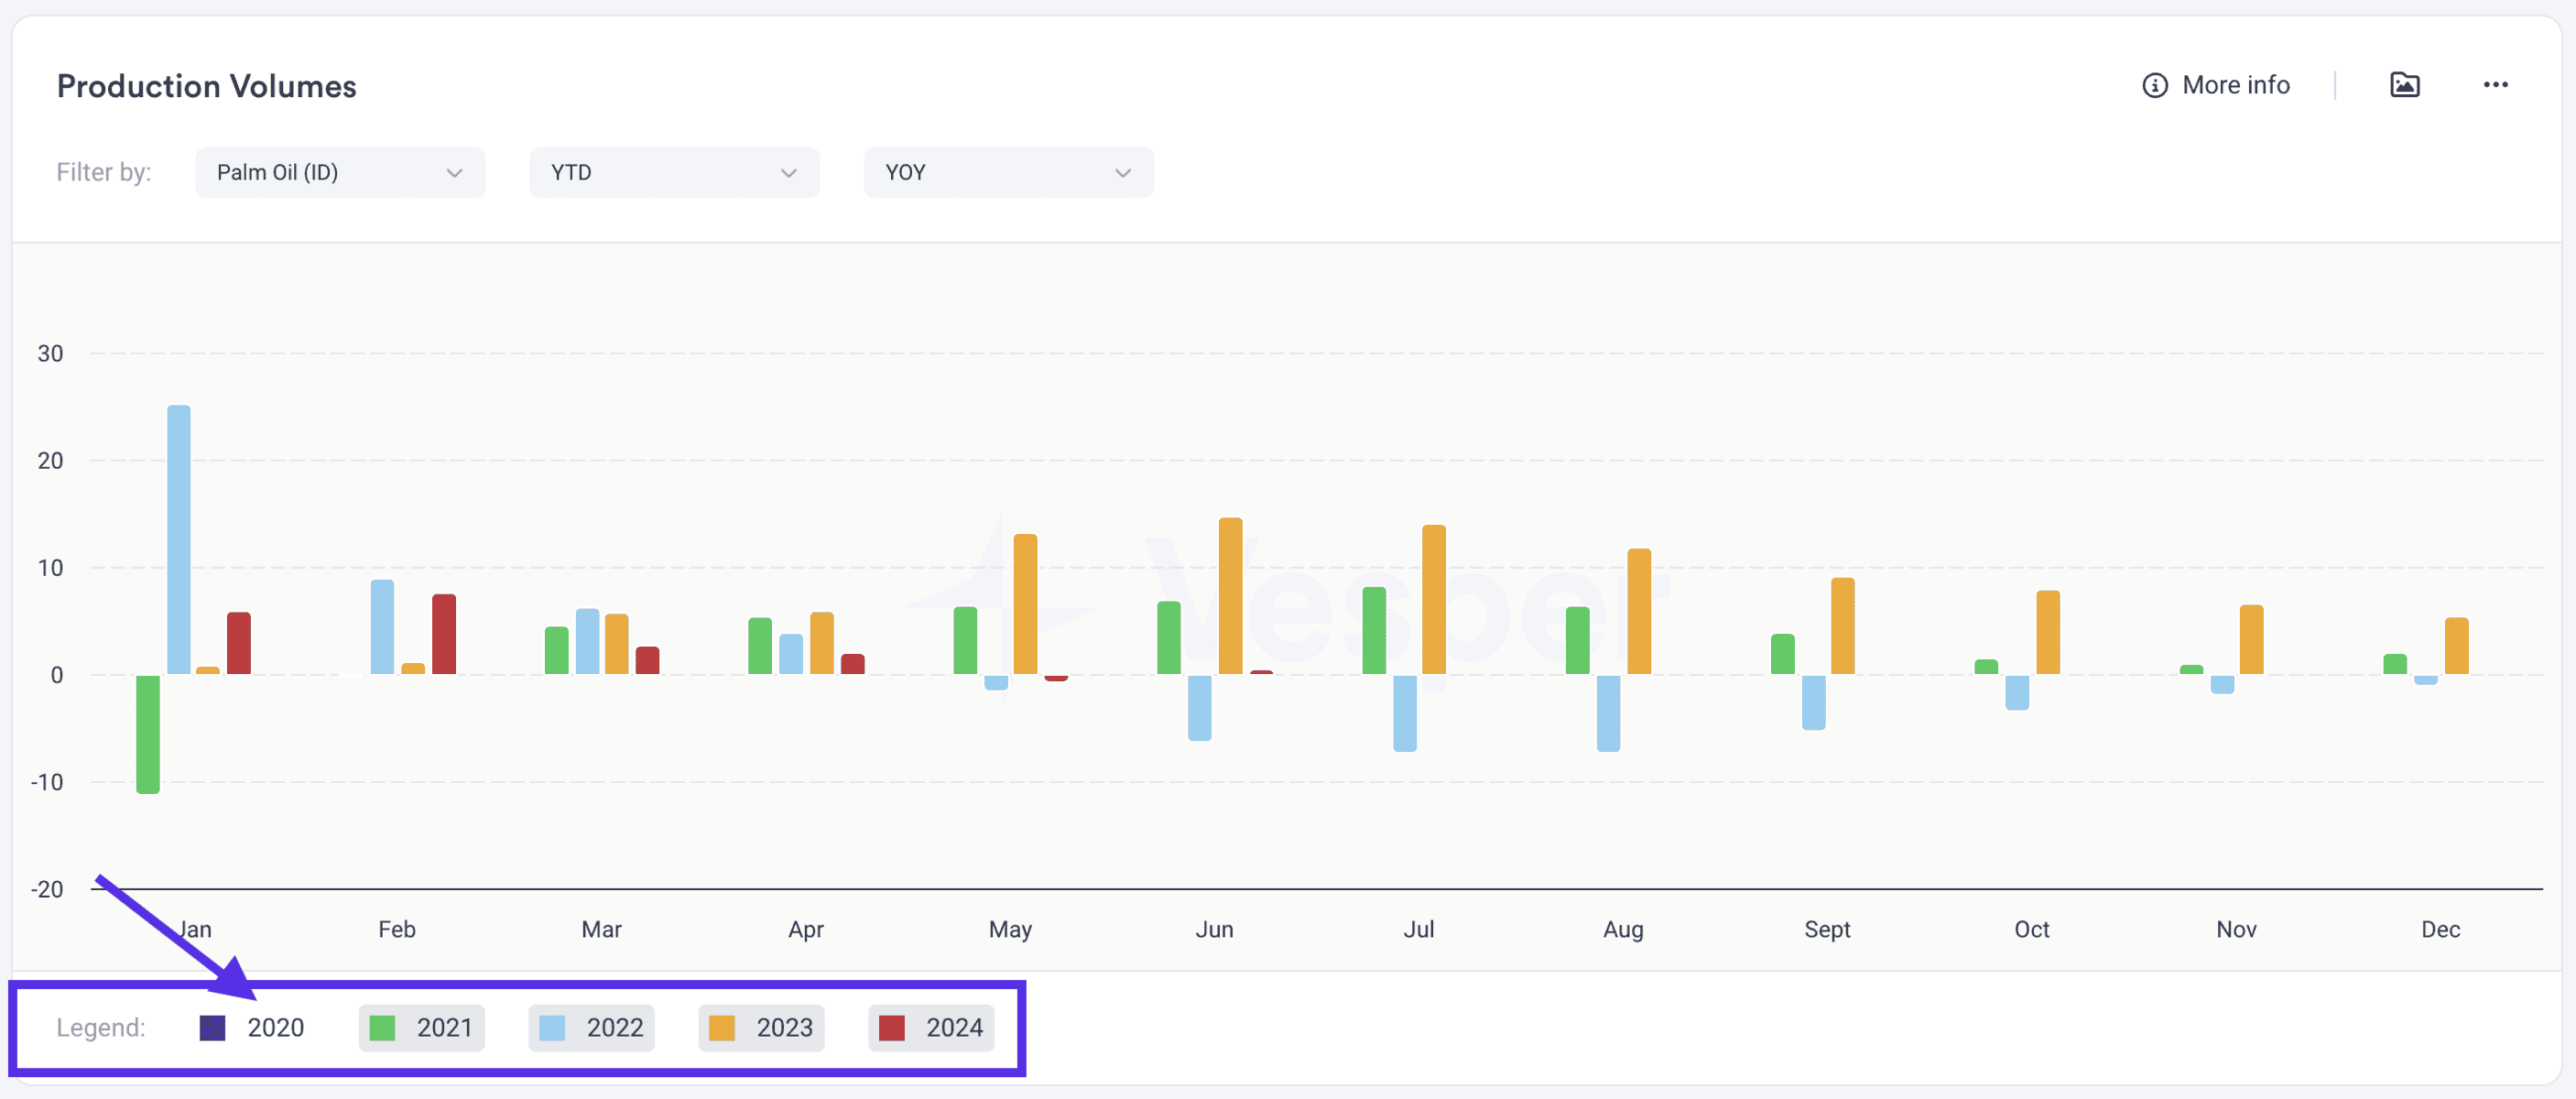
See the screenshot below how you can change the way the data is presented. Here we have selected YTD, YOY:
3. Make use of the legend
The legend allows you to select or deselect specific years.
By clicking on for example 2020, you can remove this year from the chart.
On the screenshot, you can see how the legend is presented:
Use Cases for analyzing production data
Procurement Teams
Procurement teams can use production data to understand the availability and supply levels of commodities. By analysing production trends, they can identify potential shortages or surpluses, enabling them to make informed decisions on sourcing strategies, negotiate better terms with suppliers, and ensure a stable supply of necessary commodities.
Market Analysts
Market analysts can utilise production data to assess the overall market health and predict future market trends. By understanding production levels across different regions and seasonality, they can provide insights on market dynamics, forecast potential price changes, and advise on strategic investments and market entry decisions.
Sales Managers
Sales managers can leverage production data to align their sales strategies with market conditions. By analysing production volumes, they can identify opportunities in markets, and anticipate demand spikes in regions with lower production. This information helps in planning, setting realistic sales targets, and optimising inventory levels.
Frequently asked questions
How does tracking commodity production volumes help a procurement team plan sourcing?
Production volume data shows where and how much of a commodity is being produced, so you can spot potential shortages or surpluses early. That lets procurement teams plan logistics, identify reliable supplying regions, and time purchases or negotiations before supply disruptions hit. It turns raw supply and demand data into concrete sourcing decisions rather than guesswork.
What is the difference between the Monthly and YTD views in the production widget?
Monthly shows the total amount of production recorded in each individual month, which is useful for spotting seasonality and short-term swings. YTD (year-to-date) sums production across all months of the selected year up to that point, so you can compare cumulative output between years. Switching between them helps you read both the rhythm and the running total of a market.
What do the MOM% and YOY% metrics tell me about a commodity's production?
MOM% is the percentage change in production compared with the previous month, highlighting near-term momentum and seasonal ramp-ups or slowdowns. YOY% compares the current period against the same period a year earlier, stripping out seasonality to reveal the underlying trend. Reading them together helps you separate a temporary monthly dip from a genuine structural shift in output.
Can I track production for a specific product and origin, such as palm oil from Indonesia?
Yes. The production widget includes a product filter where you select the specific commodity you want to analyse, and the article uses palm oil in Indonesia as its worked example. You can then adjust the time period and metric, and use the chart legend to add or remove individual years so you compare only the seasons most relevant to your oils and fats sourcing decisions.