

Benefits of Understanding Commodity Supply and Demand
Market Dynamics and Trends Understanding supply and demand dynamics provides a clear picture of market trends. By analysing how supply and demand interact, users can predict price movements and market behaviour, allowing for more informed and strategic decisions.
Strategic Sourcing and Procurement Supply and demand data support strategic sourcing and procurement decisions. By knowing which commodities are in high demand or short supply, procurement teams can negotiate better deals and secure reliable sources, reducing risks and costs.
Market Competitiveness Understanding supply and demand helps businesses stay competitive. By keeping an eye on market shifts and consumer demand, companies can adapt their strategies, optimise their product offerings, and maintain a strong market position.
Get Started with Commodity Supply and Demand Widgets: Step-by-Step
1. Commodity Supply and Demand Graph Widget
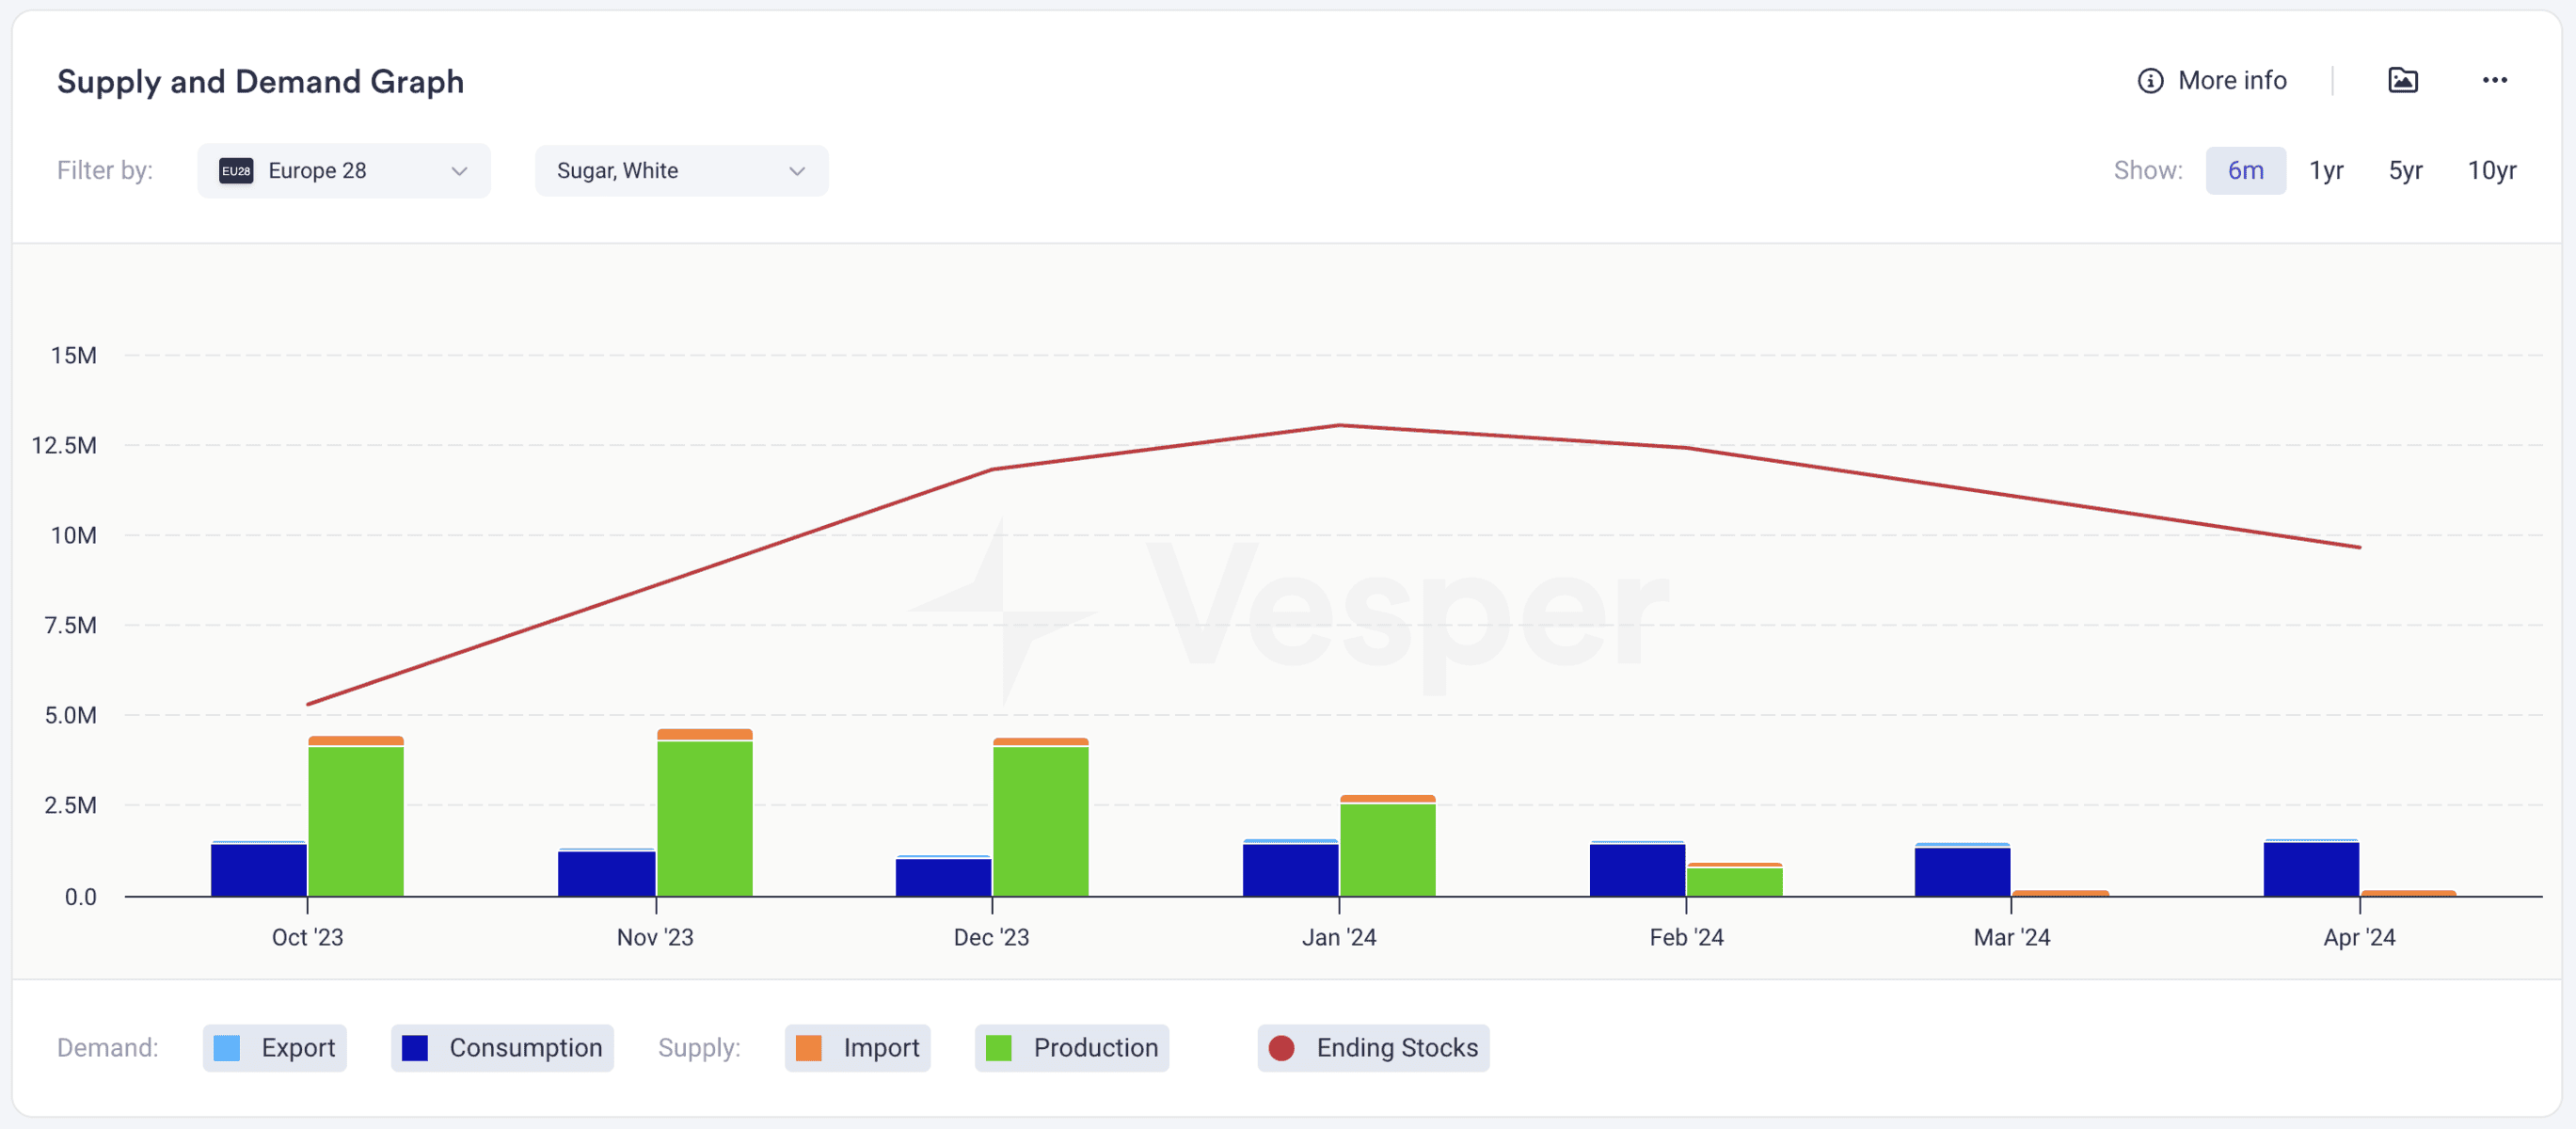
This graph displays the monthly supply and demand of the selected product per country.
- Demand is made up of Export and Consumption
- Supply is made up of Import and Production
- Ending Stocks is the availability of the product
Use the time filter on the right-hand side to view different time periods:
- 6 months
- 1 year
- 5 years
- 10 years
As some of this data is not available, we make our own calculations to provide you with these insights:
- EU countries: Consumption and Ending Stocks are not published for the individual EU countries. For these countries, we use Disappearance with the following formula: Disappearance = Production + Import, Export
- EU-28: As Consumption and Ending Stocks are not published for the EU-28, Vesper has created its own Consumption calculation. From this calculation, we are able to publish the Ending Stocks. The method we use is to calculate the consumption as a share of the Disappearance. The Disappearance in a certain month consists of both Stock Change and Consumption.
- EU-28 stock level estimates: The Vesper team estimates the monthly butter, SMP, and cheese stocks in Europe 28 using machine learning-based forecasting models. This means that, on average, the latest two to three stock-level values for EU28 butter, SMP, and cheese are preliminary.
2. Commodity supply and demand table widget
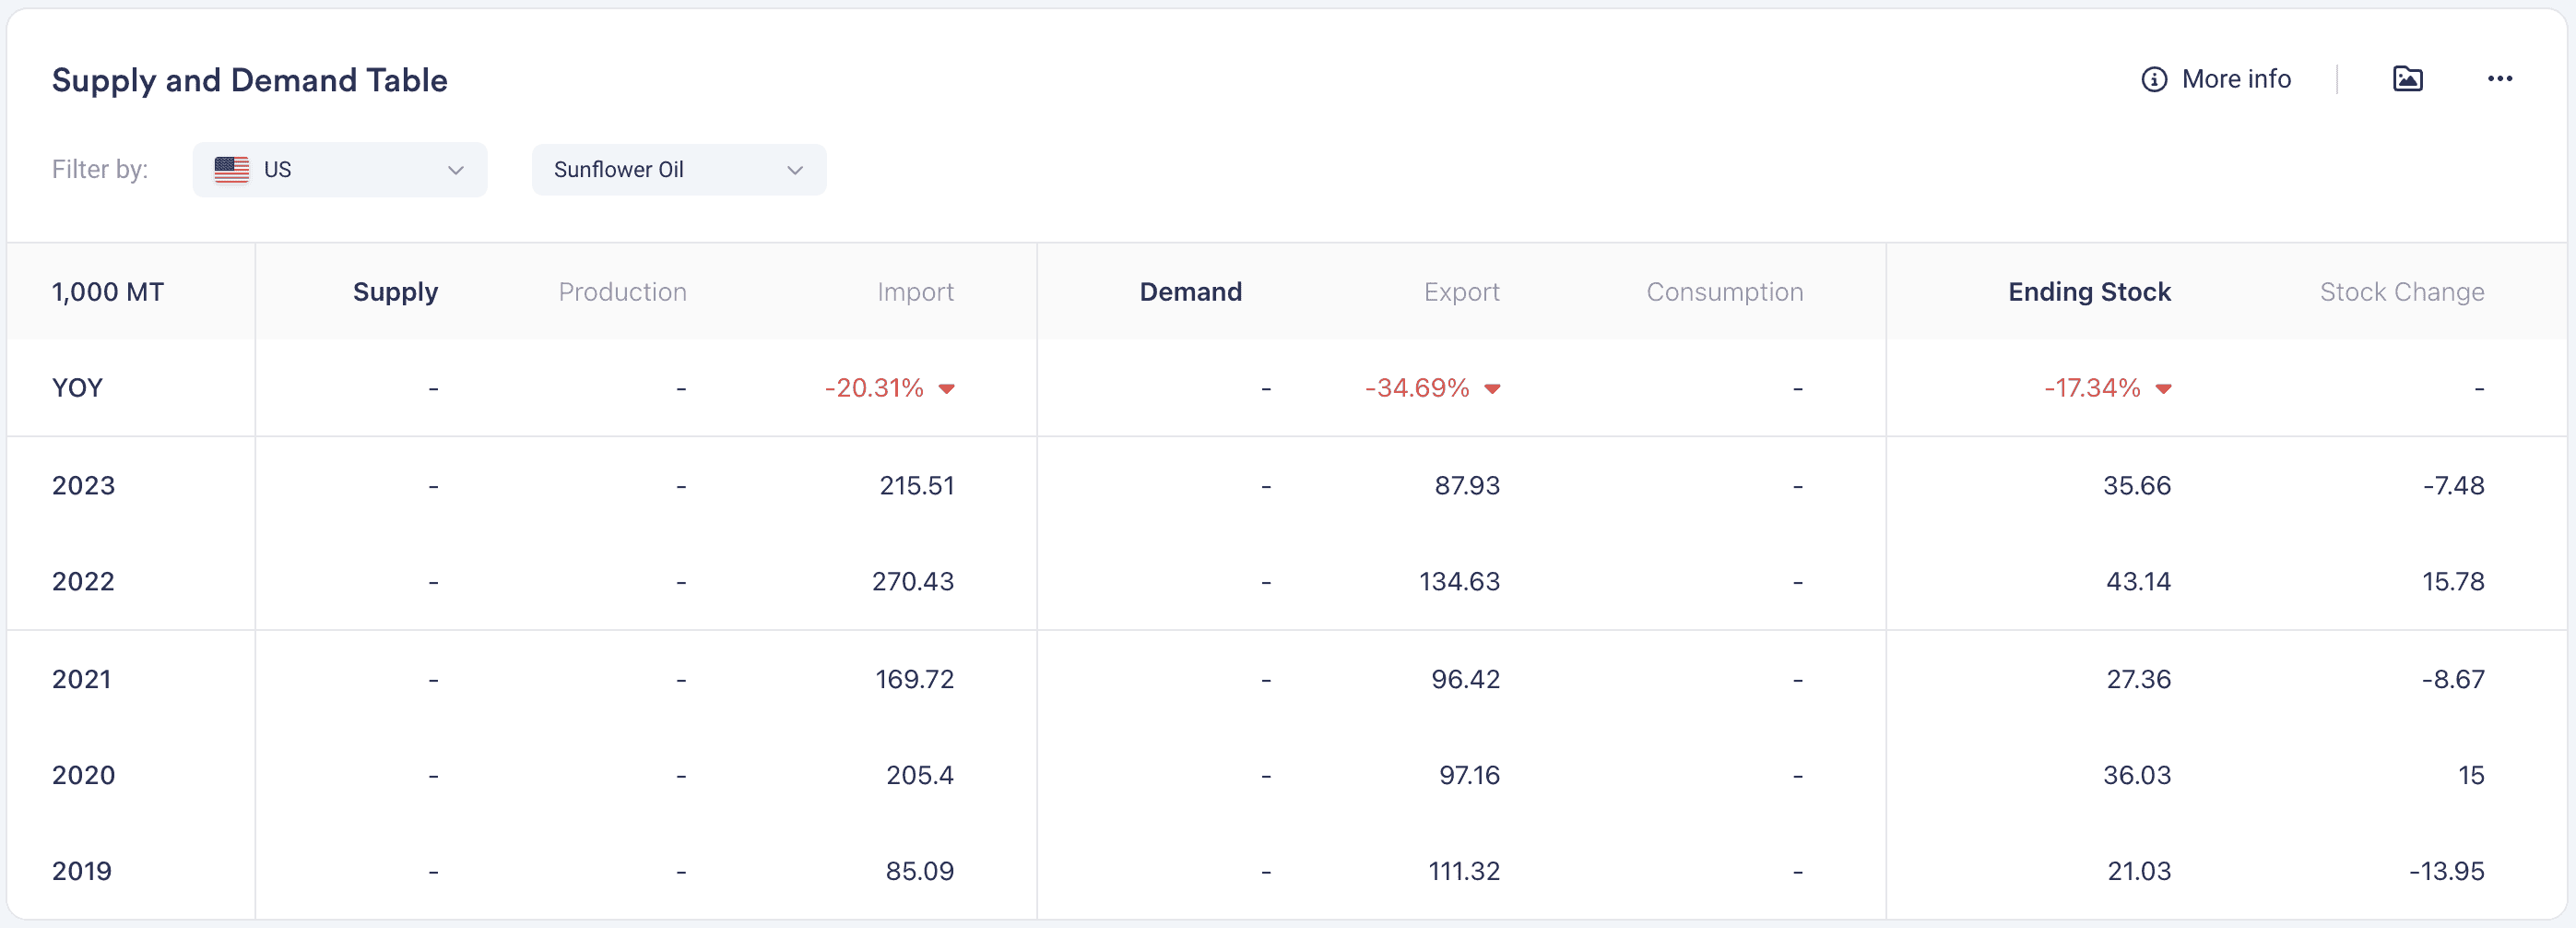
This table displays the annual Supply and Demand of the selected product per country.
The first row displays the YOY percentage change in green for positive changes and red for negative changes, giving you quick overview of yearly differences
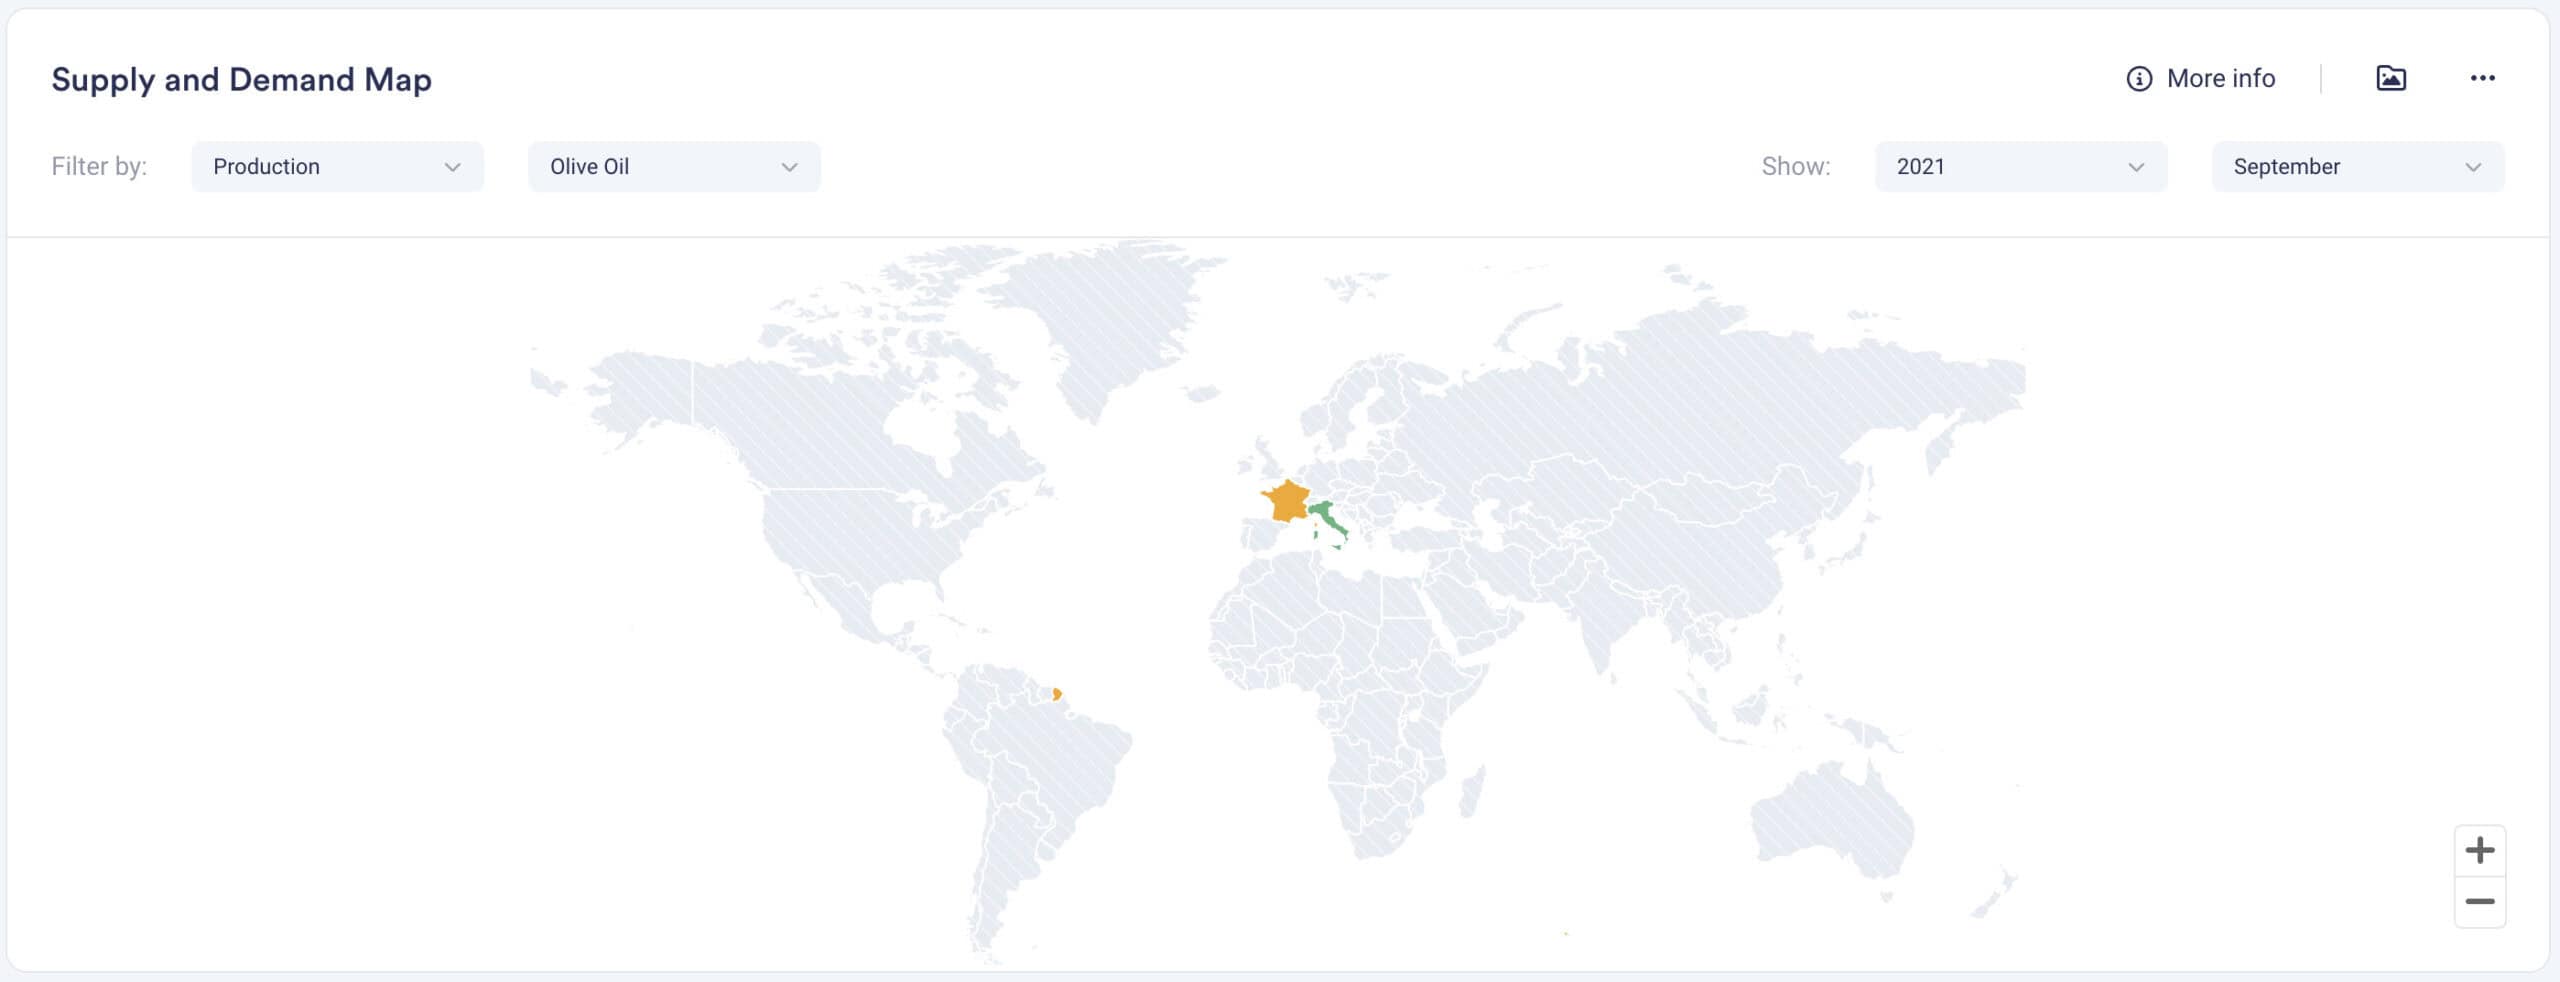
3. Commodity Supply and Demand Map Widget
The Supply and Demand Map displays the monthly supply and demand of the selected product and country.
You can filter by:
- S&D metric (Import, Export, Production, or Stock Levels)
- Product
- Year
- Month
If available, the Ending Stocks are published by public sources, and the Stock Change is the increase or decrease of the stocks for that particular year.
Production Data: Please note, if data is not displayed for a certain country, this does not necessarily mean the country in question does not produce the selected product, but rather this information may not be reported.
Use Cases for working with Supply and Demand data
Procurement Teams
Procurement teams can use supply and demand data to optimise their purchasing strategies. By understanding the current and projected supply and demand dynamics, they can make informed decisions on when to purchase, negotiate better prices, and ensure a cost-effective and reliable supply chain.
Market Analysts
Market analysts can utilise supply and demand data to forecast market trends and provide strategic insights. By analysing this data, they can identify market imbalances and understand market fundamentals, helping in making data-driven decisions and maintaining a competitive edge in the market.
Sales Managers
Sales managers can leverage supply and demand data to tailor their sales strategies and maximise revenue. By understanding where demand is rising or supply is constrained, they can target high-demand regions and adjust pricing strategies. This enables them to capitalise on market opportunities and enhance sales performance.
Frequently asked questions
What components make up supply and demand in commodity markets?
On the demand side, the figures combine export and consumption volumes. On the supply side, they combine import and production. The balance between the two leaves ending stocks, which represent the availability of the product. Tracking how these elements shift month to month helps procurement teams anticipate whether a market is tightening or loosening before prices react.
How can procurement teams use supply and demand data when sourcing?
By seeing which commodities are in short supply or high demand, buyers can time purchases more effectively, negotiate from a stronger position, and secure reliable sources. Understanding current and projected balances helps reduce both cost and supply risk. You can explore this across markets through Vesper's supply and demand data for a cost-effective, resilient supply chain.
Why does Vesper estimate some EU supply and demand figures rather than report them directly?
Consumption and ending stocks are not published for individual EU countries or the EU-28, so Vesper fills the gap with its own calculations. It derives disappearance from production and imports minus exports, then estimates consumption as a share of disappearance. EU-28 butter, SMP, and cheese stock levels are projected using machine-learning models, so the most recent values are preliminary.
What is the difference between the supply and demand graph, table, and map widgets?
The graph shows monthly supply and demand for a selected product by country, with time filters from six months to ten years. The table presents the same data annually with year-on-year percentage changes colour-coded for quick scanning. The map lets you filter by a single metric (import, export, production, or stock levels) across products, years, and months for a geographic view of where balances sit.