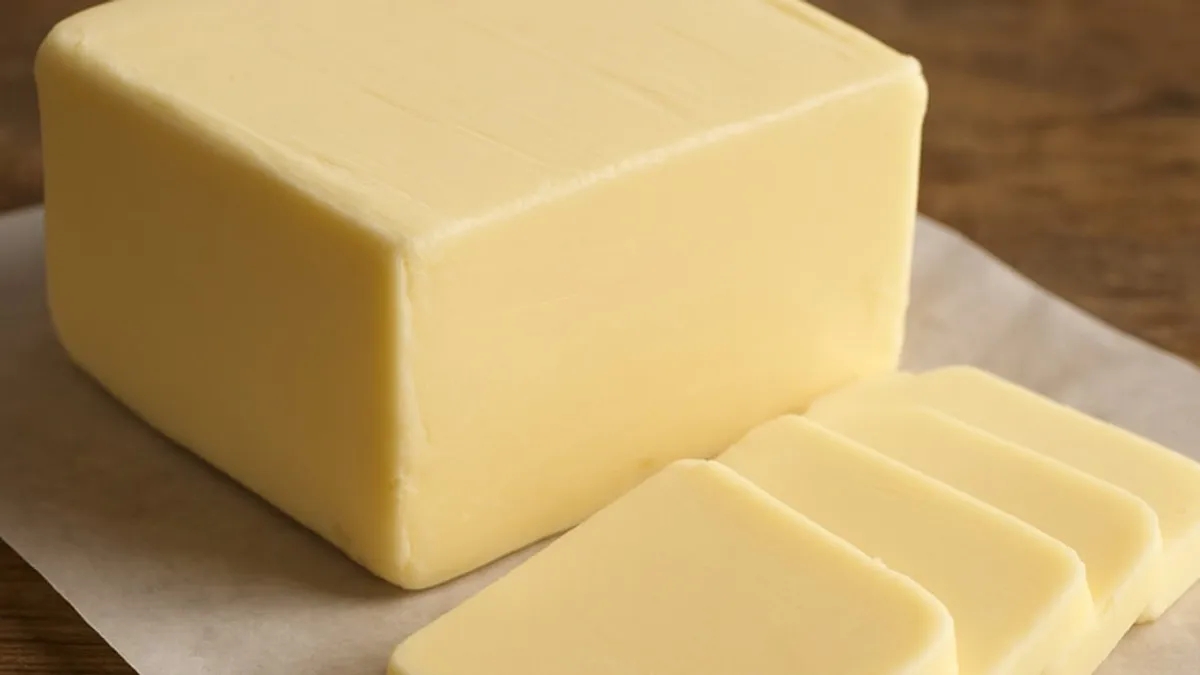


China is importing less dairy overall this year, but the mix of what it buys has shifted. Measured in milk equivalent, which converts the main dairy products back to their weight in liquid milk, Chinese imports fell 3.7% to 12.00 billion lb in January to August 2026, from 12.46 billion lb a year earlier. Within that, SMP and NFDM imports dropped 20.2% to 288.4 million lb, while cheese imports rose 18.0% to 335.3 million lb and butter climbed 18.5% to 186.1 million lb.
The trade figures arrive while US and European dairy prices keep moving on different schedules. NFDM on the CME spot call topped $2.20/lb for the second time this year, while US butter and cheese prices slid again on the week, with supply pushing them to new lows. US butter stocks are now up 10.32% on the year, and cheese stocks are up 2.3%.
The US takes a bigger slice of Southeast Asia’s cheese growth
Southeast Asia shows a different pattern. Across Indonesia, Malaysia, the Philippines, Thailand, Vietnam and Singapore, cheese imports reached 272.4 million lb in January to July 2026, up 12.2% on the same months of 2025. Imports from the US rose 46.7% to 41.4 million lb, lifting the US share of the market from 11.6% to 15.2%, and the US supplied about 45% of the region’s additional cheese imports. New Zealand is still the largest supplier at 84.9 million lb. Its share slipped to 31.2% from 35.3%, mostly because the total market grew while its own volume barely changed. Australia, at 55.4 million lb, remains ahead of the US.
Protein buying splits by destination
High-protein whey, traded under HS code 350220, moved in opposite directions. China’s imports fell 9.2% to 50.0 million lb in January to August, and its imports from the US dropped 34.3%. Japan went the other way, up 13.3% to 44.7 million lb, while Southeast Asian imports fell 11.2% in January to July.
The full US weekly analysis covers the CME moves behind butter, cheese and dry whey, and how cold storage is absorbing the extra US production.