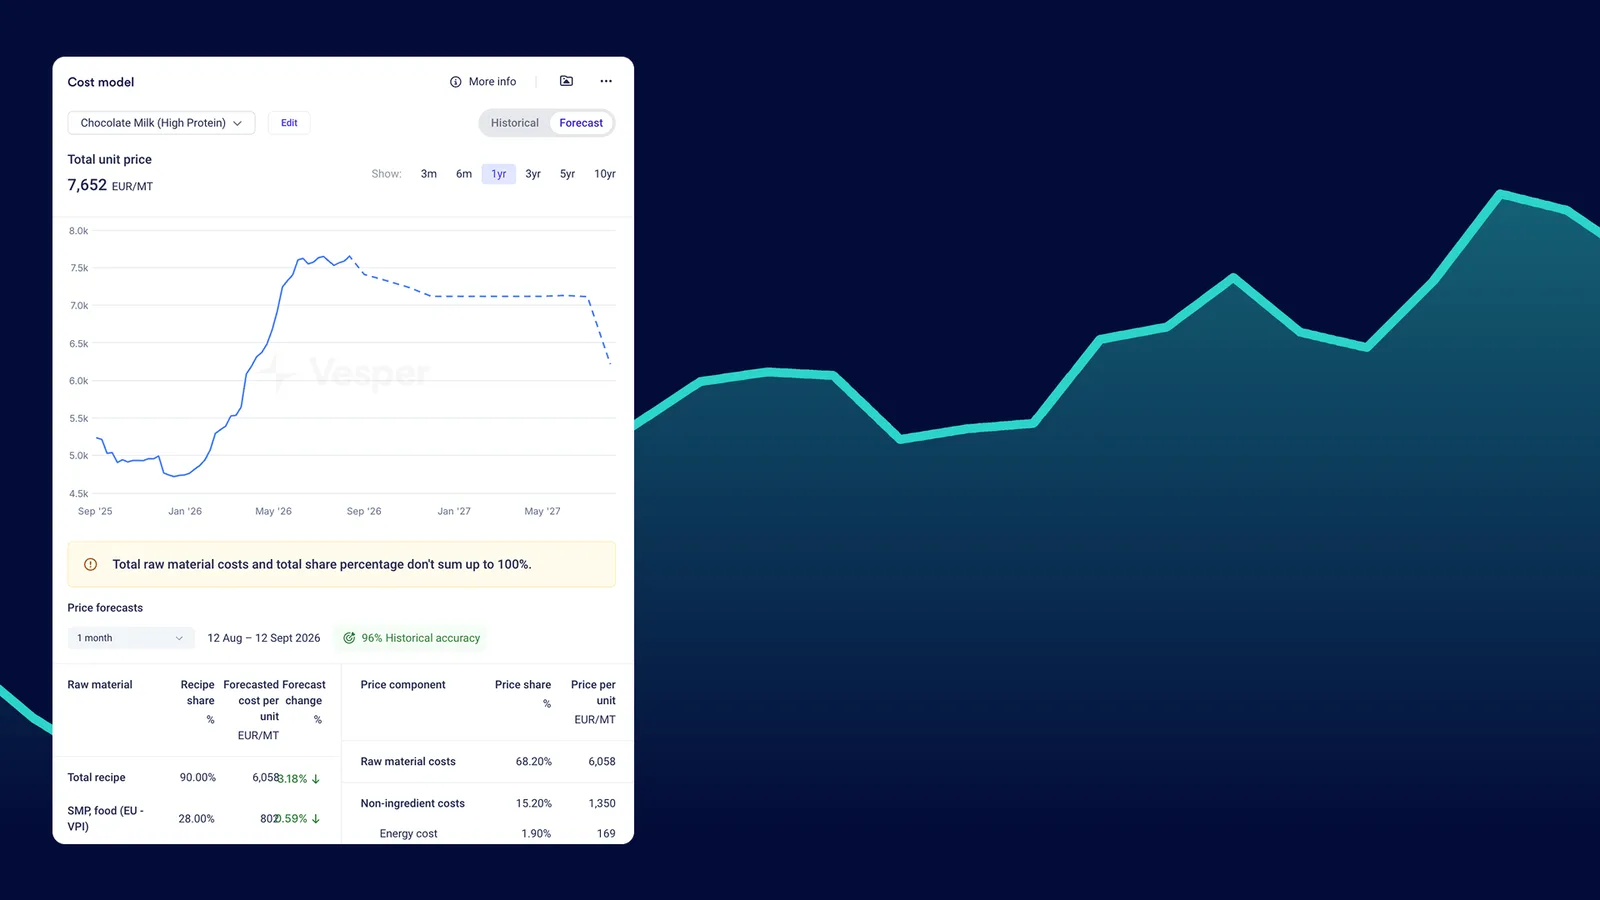


One milk. Two opposite price shocks.
On 7 October 2026, EU skimmed milk powder (Vesper Price Index, EXW) was €3,500/mt. That is 66.7% more than a year earlier.
On the same day, EU butter from the same milk was €3,790/mt. That is 28.6% less.
Your cost lines don’t move together. Your budget assumed they would stay put.
This post is the playbook for that problem. You get a 5-step framework, a volatility table for 18 inputs a food manufacturer typically buys, a list of which ingredients you can actually hedge, and a maturity model to see where your team stands today.
Every number comes from Vesper price data.
What is commodity price risk management?
Commodity price risk management is the process a food manufacturer uses to measure how raw material price volatility hits its costs and margins, decide how much of that risk to keep, and then reduce the rest with contracts, forward cover, hedging, stock or recipe changes, inside a policy that procurement and finance both sign.
In practice, “price risk” is three risks stacked on top of each other:
- Level: the market moves against you.
- Timing: you buy at the wrong moment, or your customer price resets later than your cost does.
- Basis and FX: the benchmark you hedge or index to drifts away from the price you pay, or a USD-priced input moves with the exchange rate.
A good commodity procurement strategy deals with all three. Most teams only plan for the first.
Why raw material price volatility hits food manufacturers so hard
A refinery buys crude. A food manufacturer buys dairy, flour, sugar, cocoa, oils, eggs, packaging and gas, all at once.
Here’s the thing: those markets don’t share a cycle.
Here is the full picture for 18 inputs a food manufacturer typically buys. Prices are in EUR/mt unless noted. “3-yr peak” is the highest print since October 2023.
| Ingredient (Vesper benchmark) | Latest | 12m low | 12m high | YoY | 3-yr peak |
|---|---|---|---|---|---|
| EU butter (VPI, EXW) | €3,790 (7 Oct) | €3,650 (Jun 2026) | €5,310 (Oct 2025) | -28.6% | €8,100 (Sep 2024) |
| EU SMP, food (VPI, EXW) | €3,500 (7 Oct) | €1,980 (Dec 2025) | €3,500 (Oct 2026) | +66.7% | €3,500 (Oct 2026) |
| EU WPC80, instant (VPI, EXW) | €21,000 (7 Oct) | €12,300 (Oct 2025) | €27,900 (Jun 2026) | +70.7% | €27,900 (Jun 2026) |
| EU Gouda (VPI, EXW) | €3,480 (7 Oct) | €2,880 (Oct 2025) | €3,650 (Mar 2026) | +14.1% (calc) | €4,950 (Sep 2024) |
| Cocoa, ICE-linked (EXW Europe) | €5,077.02 (13 Oct) | €2,315.65 (Feb 2026) | €5,595.92 (Jul 2026) | +6.34% | €12,007.46 (Dec 2024) |
| Cocoa butter, West-EU | €8,012.25 (13 Oct) | €4,225.25 (Feb 2026) | €10,685.75 (Nov 2025) | -15.4% | €42,540.75 (Dec 2024) |
| White sugar, ICE No.5-linked | €502.72 (13 Oct) | €316.61 (Feb 2026) | €502.72 (Oct 2026) | +31.6% | €712.98 (Nov 2023) |
| White sugar, Germany (VPI, DAP) | €610 (14 Oct) | €430 (Jan 2026) | €615 (Sep 2026) | +9.9% | €740 (Feb 2024, series start) |
| Milling wheat, Euronext-linked | €245.75 (13 Oct) | €180 (May 2026) | €247.5 (Oct 2026) | +30.0% | €269 (May 2024) |
| Arabica coffee, ICE-linked | €5,773.30 (13 Oct) | €5,233.88 (Sep 2026) | €8,065.94 (Nov 2025) | -21.0% | €9,300.22 (Feb 2025) |
| Crude palm oil, Malaysia (VPI) | €981.47 (14 Oct) | €825.15 (Dec 2025) | €1,029.16 (Apr 2026) | +8.6% | €1,158.07 (Dec 2024) |
| Crude sunflower oil, West-EU (VPI) | €1,267.08 (12 Oct) | €1,134.54 (Dec 2025) | €1,392.46 (Jun 2026) | +8.0% | €1,392.46 (Jun 2026) |
| Refined rapeseed oil, Hamburg | €1,344.25 (14 Oct) | €1,075.00 (Oct 2025) | €1,432.00 (May 2026) | +22.8% | €1,432.00 (May 2026) |
| Extra virgin olive oil, Spain (VPI) | €3,400 (14 Oct) | €3,275 (Oct 2026) | €4,862.5 (Nov 2025) | -25.8% | €9,475 (Jan 2024) |
| Eggs, class A caged, Europe (VPI) | €1,600 (8 Oct) | €1,325 (Jul 2026) | €2,820 (Oct 2025) | -39.8% | €2,820 (Oct 2025) |
| Processing potatoes, NL (fries) | €270 (12 Oct) | €37.5 (Apr 2026) | €280 (Aug 2026) | +260.0% | €675 (Jul 2024) |
| European gas, THE hub (EEX), EUR/MWh | €70.58 (13 Oct) | €29.25 (Dec 2025) | €70.58 (Sep 2026) | +115.3% | €70.58 (Sep 2026) |
| rPET clear pellets, West-EU (monthly) | €1,530 (Sep 2026) | €1,120 (Jan 2026) | €1,750 (Jun 2026) | +27.5% | €1,750 (Jun 2026) |
Source: Vesper, data as of 14 Oct 2026. ICE-linked and Euronext-linked rows are Vesper’s daily EXW price series for those markets, not futures front-month history. Gouda YoY is our calculation (€3,480 vs €3,050).
Three things jump out.
First, the year-on-year number hides most of the ride. Cocoa is up only 6.34% on the year. But the ICE-linked price went from €2,315.65 on 27 February 2026 to €5,595.92 on 9 July 2026. It more than doubled in about four months.
Second, related products split apart. SMP and butter both come from milk, yet one is at a three-year high and the other is down 28.6%. The cocoa price rose while cocoa butter prices fell 15.4%.
Third, the “small” lines bite. Processing potatoes went from €37.5/mt in April to €270/mt in October. Gas more than doubled.
Add the retail side. Customer prices are often agreed months ahead, so cost moves hit your margin first and your price list much later.
The 5-step commodity price risk management framework
Each step below ends with one output you can show your CFO.
Step #1: Map your exposure by spend and volatility
You can’t manage every ingredient with equal effort. So rank them by two numbers:
- Spend share: what percent of your cost (or of the cost of a key product) it represents.
- Volatility: how far its price can move in a year. A simple measure is the 12-month swing: the 12-month high divided by the 12-month low, minus one.
A big line that barely moves is less risky than a medium line that doubles.
Let me show you. Here is an example cost structure for a butter biscuit, the kind of product a bakery manufacturer sells. The shares are illustrative. Use your own supplier’s breakdown.
The biggest ingredient by spend, butter, lowered the cost. The energy line, at only 8% of cost, drove more than all of the increase.
Exposure is spend multiplied by volatility, and the answer often surprises you.
Anthony Britton saw the same thing when he set up commodity risk at Migros:
When you aggregate it, you may sometimes be surprised at where the exposures are. And some of them you can operationally find a way to manage, and some of them you can’t.
Once you have the numbers, sort every input into four buckets:
| Bucket | Example (12-month swing, our calc) | Default response |
|---|---|---|
| 1. Big spend, high volatility | Cocoa for a chocolate maker (141.7%); WPC80 for a protein bar brand (126.8%) | Written cover policy, layered buying, futures where they exist |
| 2. Big spend, lower volatility | Sunflower oil for a fryer (22.7%); palm oil (24.7%) | Index-linked contracts, quarterly price reviews |
| 3. Small spend, high volatility | Eggs for a biscuit maker (112.8%); gas for any plant (141.3%) | Supplier contracts, pass-through clauses, a watch list |
| 4. Small spend, low volatility | Coated GC1 cartonboard (0% YoY, €1,120/mt Sep 2026) | Annual tender, no active management |
12-month swing = 12m high ÷ 12m low − 1, from the volatility table above. Cartonboard: Vesper, Partner Price, DAP Europe.
Bucket 1 gets most of your time. Bucket 4 gets almost none.
Step #2: Set risk appetite and split ownership between procurement and finance
Commodity risk tends to fall between two teams. Procurement sees the market. Finance sees the margin. Nobody owns the gap until a spike hits the P&L.
Fix that with a one-page risk policy that answers four questions:
- How much margin variance can we live with? Finance sets this.
- How much cover do we hold, and how far ahead? For example, a rolling ladder: 100% of this quarter, 75% of next quarter, 50% of the one after, 25% of the quarter after that. That is exactly the layer our backtest below uses.
- Who can decide what? Buyers act inside the cover bands. Going outside them needs a named approver.
- When do we review? Monthly, with procurement, finance and sales. Sales has to be there, because pass-through is one of your tools.
| Decision | Owner | Signs off |
|---|---|---|
| Market view and buying timing | Procurement | Head of procurement |
| Budget rate per ingredient | Finance, with procurement input | CFO |
| Cover bands and approval limits | Finance | CFO and head of procurement |
| Futures and options trades | Finance or treasury | CFO |
| Customer price changes | Sales | Commercial director |
| Monthly variance report | Finance | Shared |
Procurement owns the decisions in the market; finance owns the limits and the scorecard.
The policy is not there to make you right. It is there so the business knows what happens when you’re wrong. Nestlé’s head of price risk puts it this way:
You need a framework to test your assumptions and build contingency plans. It’s not about being right 100% of the time. It’s about preparing the business to respond when markets shift.
Step #3: Set budget rates you can defend
The budget rate is the price per tonne you plug into next year’s plan. Get it wrong and every month of the year looks like a buying failure.
Most teams use one of three sources: today’s spot price, the futures curve, or a forecast. They can disagree a lot.
| Commodity | Spot (date) | 2027 futures avg (calc) | Vesper forecast avg (calc) | Futures vs forecast |
|---|---|---|---|---|
| EU butter (EEX / VPI) | €3,790 (7 Oct) | €4,366 (+15.2%) | €4,556 (+20.2%) | futures 4.2% below |
| EU SMP (EEX / VPI) | €3,500 (7 Oct) | €3,471 (-0.8%) | €3,036 (-13.3%) | futures 14.3% above |
| Cocoa, ICE London (EUR) | €5,077 (13 Oct) | €5,277 (+3.9%) | €4,739 (-6.7%) | futures 11.4% above |
| White sugar No.5 | €502.72 (13 Oct) | €509 (+1.2%) | €514 (+2.2%) | futures 1.0% below |
| Milling wheat, Euronext | €245.75 (13 Oct) | €241 (-1.8%) | €231 (-6.1%) | futures 4.5% above |
Source: Vesper, data as of 14 Oct 2026. Averages are our calculation over the 2027 months where both a futures contract and a Vesper forecast point exist (butter and SMP: Mar, Jun, Sep, Oct; cocoa: Mar, May, Jul, Sep; sugar: Mar, May, Aug, Oct; wheat: Mar, Sep). As at 14 Oct 2026 most Vesper forecasts ran to October 2027; wheat ended in September 2027 and the horizon rolls forward.
Look at SMP. Budget at the futures curve and you plan for €3,471/mt. Budget at the Vesper forecast and you plan for €3,036/mt. That is a 14.3% gap on one ingredient.
Neither number is “right”. A futures price is a price you can lock today. A forecast is a view of where the market will go, and a forecast is not a promise.
The fix is to pick one method, write down why, and show a range. Our guide to setting 2027 commodity budget rates walks through the choice ingredient by ingredient.
General Mills runs its commodity risk on the same idea:
We manage risk by staying ready for a range of outcomes, and knowing how to respond when the unexpected happens.
Step #4: Pick the right tool for each ingredient
There is no single best hedge. Match a tool to each bucket.
| Tool | How it works | Best for | Trade-off | Deep dive |
|---|---|---|---|---|
| Supplier fixed price | One price for a period | Small, steady lines | Risk premium; you miss falls | Responding to a supplier price increase |
| Forward cover and layering | Buy future volume in tranches | Big, volatile lines | Smooths cost, does not beat the market | Forward buying and layered cover |
| Index-linked pricing | Price follows a benchmark plus a fixed fee | Dairy, oils, eggs | No price certainty | Index-linked price adjustment clauses |
| Futures and options | Exchange contracts offset physical price moves | Cocoa, sugar, wheat, butter, SMP, palm oil | Margin calls, basis risk | See the hedge table below |
| Stock | Buy ahead and store | Sugar, powders | Cash, space, shelf life | |
| Reformulation or substitution | Change recipe, grade or origin | One input spikes against a substitute | R&D time, label changes | |
| Pass-through | Move cost changes into customer prices | Contracts with a review clause | Lag; retailers push back |
Layered cover reduces budget surprises. It does not lower cost. We ran a backtest on Vesper quarter-start prices from January 2023 to October 2026. Each quarter’s volume was bought in four equal tranches: one at the start of that quarter and one at the start of each of the three quarters before it. The budget rate each year was the October price of the year before.
The result? Layering roughly halved the average budget miss for butter and sugar and cut it by about a third for cocoa.
It did not make buying cheaper. Over three years, layered butter cost 1.7% more than spot and layered sugar 5.3% more. Cocoa came out 2.1% cheaper. The backtest assumes you bought at the price of the purchase date, with no storage or financing cost.
Index clauses cut both ways. In an illustrative dairy blend priced at a fixed €4,000/mt, a clause indexed 40% to SMP and 25% to butter, with 35% fixed (base Q1 2025) averaged €3,723/mt over eight quarters, 6.9% below the fixed price. Then SMP jumped. In Q4 2026 the indexed price hit €4,152/mt, above the fixed €4,000.
That is the deal you make with an index: you get the market, in both directions.
Step #5: Monitor, re-forecast and split the variance
A risk program without a scorecard drifts. Every month, compare actual cost with budget and split the gap into four parts.
Say you set your 2026 butter budget at the 1 October 2025 quarter-start price, €5,400/mt. At the start of Q3 2026 the market was €3,930/mt. That is a favorable price variance of €1,470 per tonne.
The market produced that saving. Your buyers did not.
If you don’t split the variance, you reward luck and punish bad timing you could not control. A better test of buying skill is to benchmark what you paid against the market index for the same weeks. That is what Vesper’s procurement benchmarking use case is built for.
Set a cadence:
- Weekly: watch prices for Bucket 1 inputs.
- Monthly: re-forecast the rest of the year using the cover you hold plus the latest forward prices or forecast. Run the variance split.
- Quarterly: review the policy itself. Are the cover bands still right? Did a Bucket 3 ingredient move into Bucket 1?
Which ingredients can you hedge with futures?
This is the gap most guides skip. Many food inputs have no exchange contract at all.
Here is what Vesper’s futures coverage shows as of 14 October 2026:
| Ingredient | Exchange futures? | Where | What to do if there are none |
|---|---|---|---|
| Butter | Yes | EEX, SGX-NZX; CME for US butter | |
| SMP | Yes | EEX, SGX-NZX | |
| Whole milk powder | Yes, SGX-NZX only | SGX-NZX | |
| Whey | Feed sweet whey powder only | EEX | Index clause on a whey benchmark |
| WPC80 | No | Index clause on a WPC80 benchmark plus layered supplier cover | |
| Cheese | US cheese only | CME | EU buyers: index clause on an EU cheese benchmark |
| Raw milk | Yes | EEX, SGX; CME Class III | |
| Cocoa beans | Yes | ICE London, ICE US | |
| Cocoa butter | No | Hedge the bean leg on ICE, agree the butter ratio with your supplier | |
| White sugar | Yes | ICE London (No.5) | |
| Raw sugar | Yes | ICE US (No.11) | |
| Milling wheat | Yes | Euronext | Bakers: hedge wheat, fix the milling margin with your miller |
| Coffee | Yes | ICE US (arabica), ICE London (robusta) | |
| Palm oil | Yes | Bursa Malaysia | |
| Sunflower oil | No | Index clause on a sunflower oil benchmark, forward cover | |
| Olive oil | No | Forward cover with packers, index clause | |
| Eggs | No EU futures (China DCE only) | Index-linked contract with your packer, forward cover |
Source: Vesper futures coverage, curve snapshot 14 Oct 2026.
Bottom line: if you buy dairy proteins, sunflower or olive oil, eggs or cocoa butter, your main price-risk tools are contractual.
One change is coming in EU dairy: Euronext listed dairy futures for butter and SMP on 19 October 2026, settling on VPI-B, the BMR-compliant index based on the Vesper Price Index. Read more about the Euronext contracts that will settle on the VPI.
Basis risk: the gap your hedge doesn’t cover
A futures contract protects you only as far as its price moves with the price you actually pay. The difference between the two is the basis.
Take EU SMP. The physical benchmark, the Vesper Price Index, was €3,500/mt on 7 October 2026. The EEX October 2026 SMP future stood at €3,525/mt on the curve read on 14 October. The dates differ, so treat this as an illustration of the idea.
That €25/mt gap is 0.7% (our calculation). Small, because it is the same product in the same region.
The basis gets much wider when you hedge with a proxy. Hedge cocoa butter with cocoa bean futures, or a German sugar contract with ICE London No.5, and you carry the risk that the two prices drift apart.
Before you hedge, check that the futures benchmark tracks the price on your invoice. If it doesn’t, an index-linked contract on the right physical benchmark may protect you better than a futures position on the wrong one.
A commodity risk management maturity model for the food industry
Where does your team sit today?
| Level | How buying works | Budget rate | Tools in use | Review rhythm |
|---|---|---|---|---|
| 1. Reactive | Buy when needed, at spot or the supplier’s quote | Last year’s price plus a guess | Spot, supplier fixed price | When a spike hits the P&L |
| 2. Planned | Cover targets for the top few inputs | October spot price | Fixed prices, some forward cover | Quarterly |
| 3. Managed | Written policy signed by procurement and finance; exposure buckets | One documented method, with a range | Layered cover, index clauses, futures where liquid | Monthly risk meeting with a variance split |
| 4. Data-led | Exposure tracked for every line, by product | Scenario range from futures and forecasts | Full toolkit including options and pass-through clauses | Weekly price monitoring, monthly re-forecast |
The jump that pays most is Level 1 to Level 3. It needs no trading desk. It needs a policy, a budget method and a monthly meeting.
Level 4 is where data matters: daily prices, forward curves and forecasts for every input, in one place.
What big food buyers do differently
Their habits scale down to a mid-size team.
- General Mills plans for a range of outcomes instead of betting on one forecast, and over-communicates its assumptions to the business.
- Fonterra sells more and more of its dairy on index-linked contracts tied to a transparent benchmark, so neither side has to renegotiate every move. See Fonterra’s view on index pricing.
- Migros started its commodity team by mapping exposures, then focused on the few large enough to act on.
- Nestlé hedges with futures and options, and models price risk with Monte Carlo simulations on top of its market intelligence.
Common mistakes to avoid
1. Treating the futures curve as a forecast. For 2027 SMP, futures sit 14.3% above the Vesper forecast. A futures price is a price you can trade today. It tells you little about where the market is likely to go.
2. Judging a strategy on one lucky year. In our backtest, fixing a full year’s cocoa in October 2023 looked brilliant, because it locked in the price before the 2024 spike. Doing the same for sugar locked in a price near the 2023 high. Both outcomes were luck.
3. Ignoring energy and packaging. In the biscuit example, gas at 8% of cost drove more than the entire increase. Gas, cartonboard and rPET belong on the exposure map.
4. Stockpiling perishables. Buying extra eggs or fresh dairy ahead of a rise trades price risk for spoilage risk. Use forward contracts instead.
5. Leaving risk with one team. If procurement owns it alone, finance won’t back the cover policy when it loses money on paper. If finance owns it alone, nobody hears what suppliers are saying.
Next steps
Start with Step #1. Pull last year’s spend by ingredient and add the 12-month swing for each one. That alone shows you where to focus.
Then decide your budget method and write the one-page policy.
When you’re ready to choose instruments, read our guide to which hedging tool fits which ingredient.
To see daily prices, forward curves and Vesper’s price forecasts for every input in your exposure map, book a demo.
Frequently asked questions
What is commodity price risk?
Commodity price risk is the chance that the market price of a raw material moves against you between the moment you plan a cost and the moment you pay it. For a food manufacturer that means ingredients, packaging and energy. It shows up as a gap between budget and actual cost, and as margin you lose when you cannot pass the increase on fast enough.
How do food companies manage commodity price risk?
Most follow the same sequence. They map which ingredients carry the most spend and volatility, agree how much risk the business can carry, set budget rates, then match a tool to each ingredient: fixed prices, layered forward cover, index-linked contracts, futures or options, stock, recipe changes or pass-through to customers. Finally they track actual cost against budget and split the gap into price, volume, FX and mix.
Who should own commodity risk, procurement or finance?
Both, with a clear split. Procurement owns the market view and the buying, because it talks to suppliers every day. Finance owns the budget rate, the risk limits and the reporting, because it carries the margin target. A short written policy that both sign, plus a monthly meeting with sales present for pass-through, stops risk from falling into the gap between the two teams.
Can you hedge ingredients that have no futures market?
Yes, through the physical contract instead of an exchange. Index-linked pricing ties the price to a published benchmark, layered forward cover buys volume in tranches over time, and fixed-price deals move the risk to the supplier for a premium. Where a related market has futures, such as cocoa beans for cocoa butter, you can also hedge the related market and accept the basis risk.
What is basis risk?
Basis risk is the chance that the price you hedge with moves differently from the price you actually pay. A futures contract tracks one exchange benchmark, while your supplier invoices a physical price for a specific product, place and date. If that gap changes during the hedge, part of your protection disappears. Basis risk is usually small for the same product in the same region and large for a proxy.