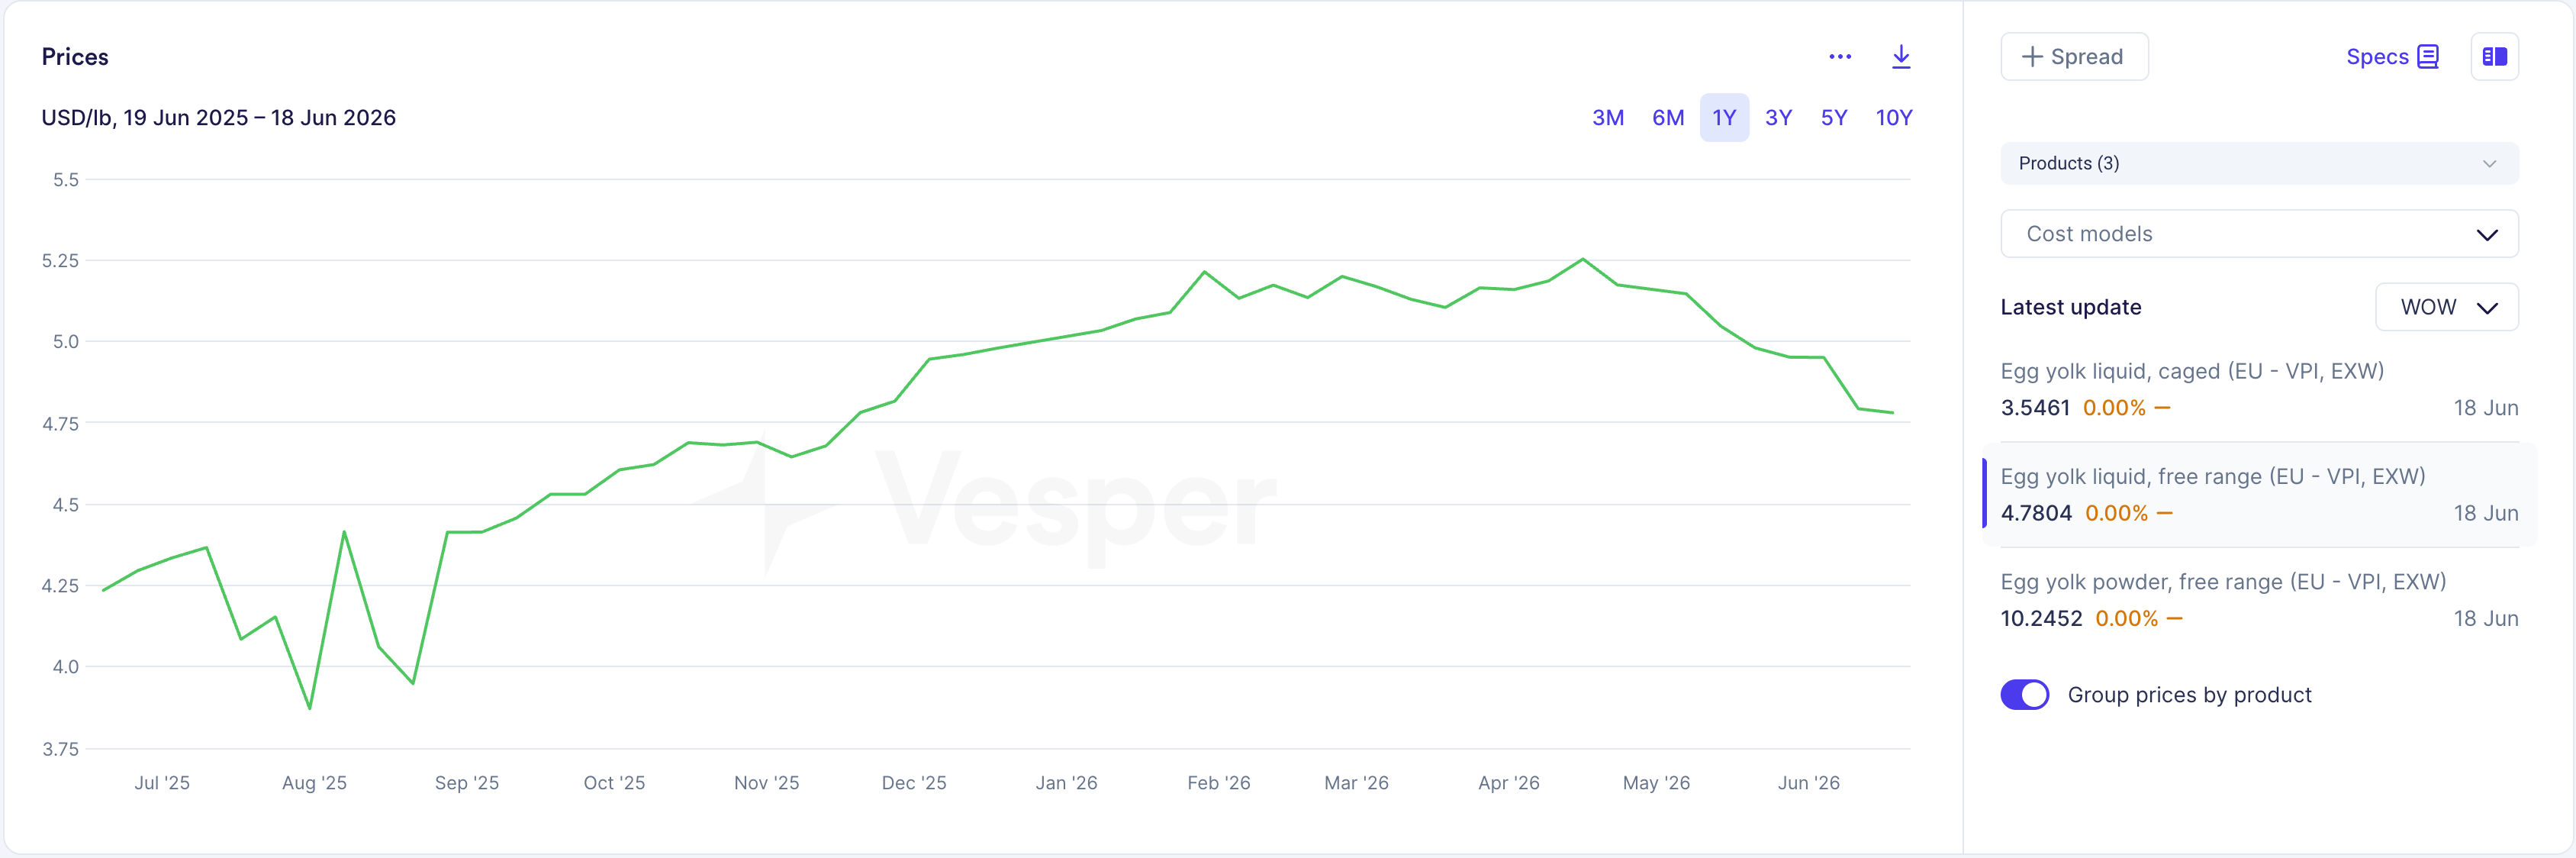

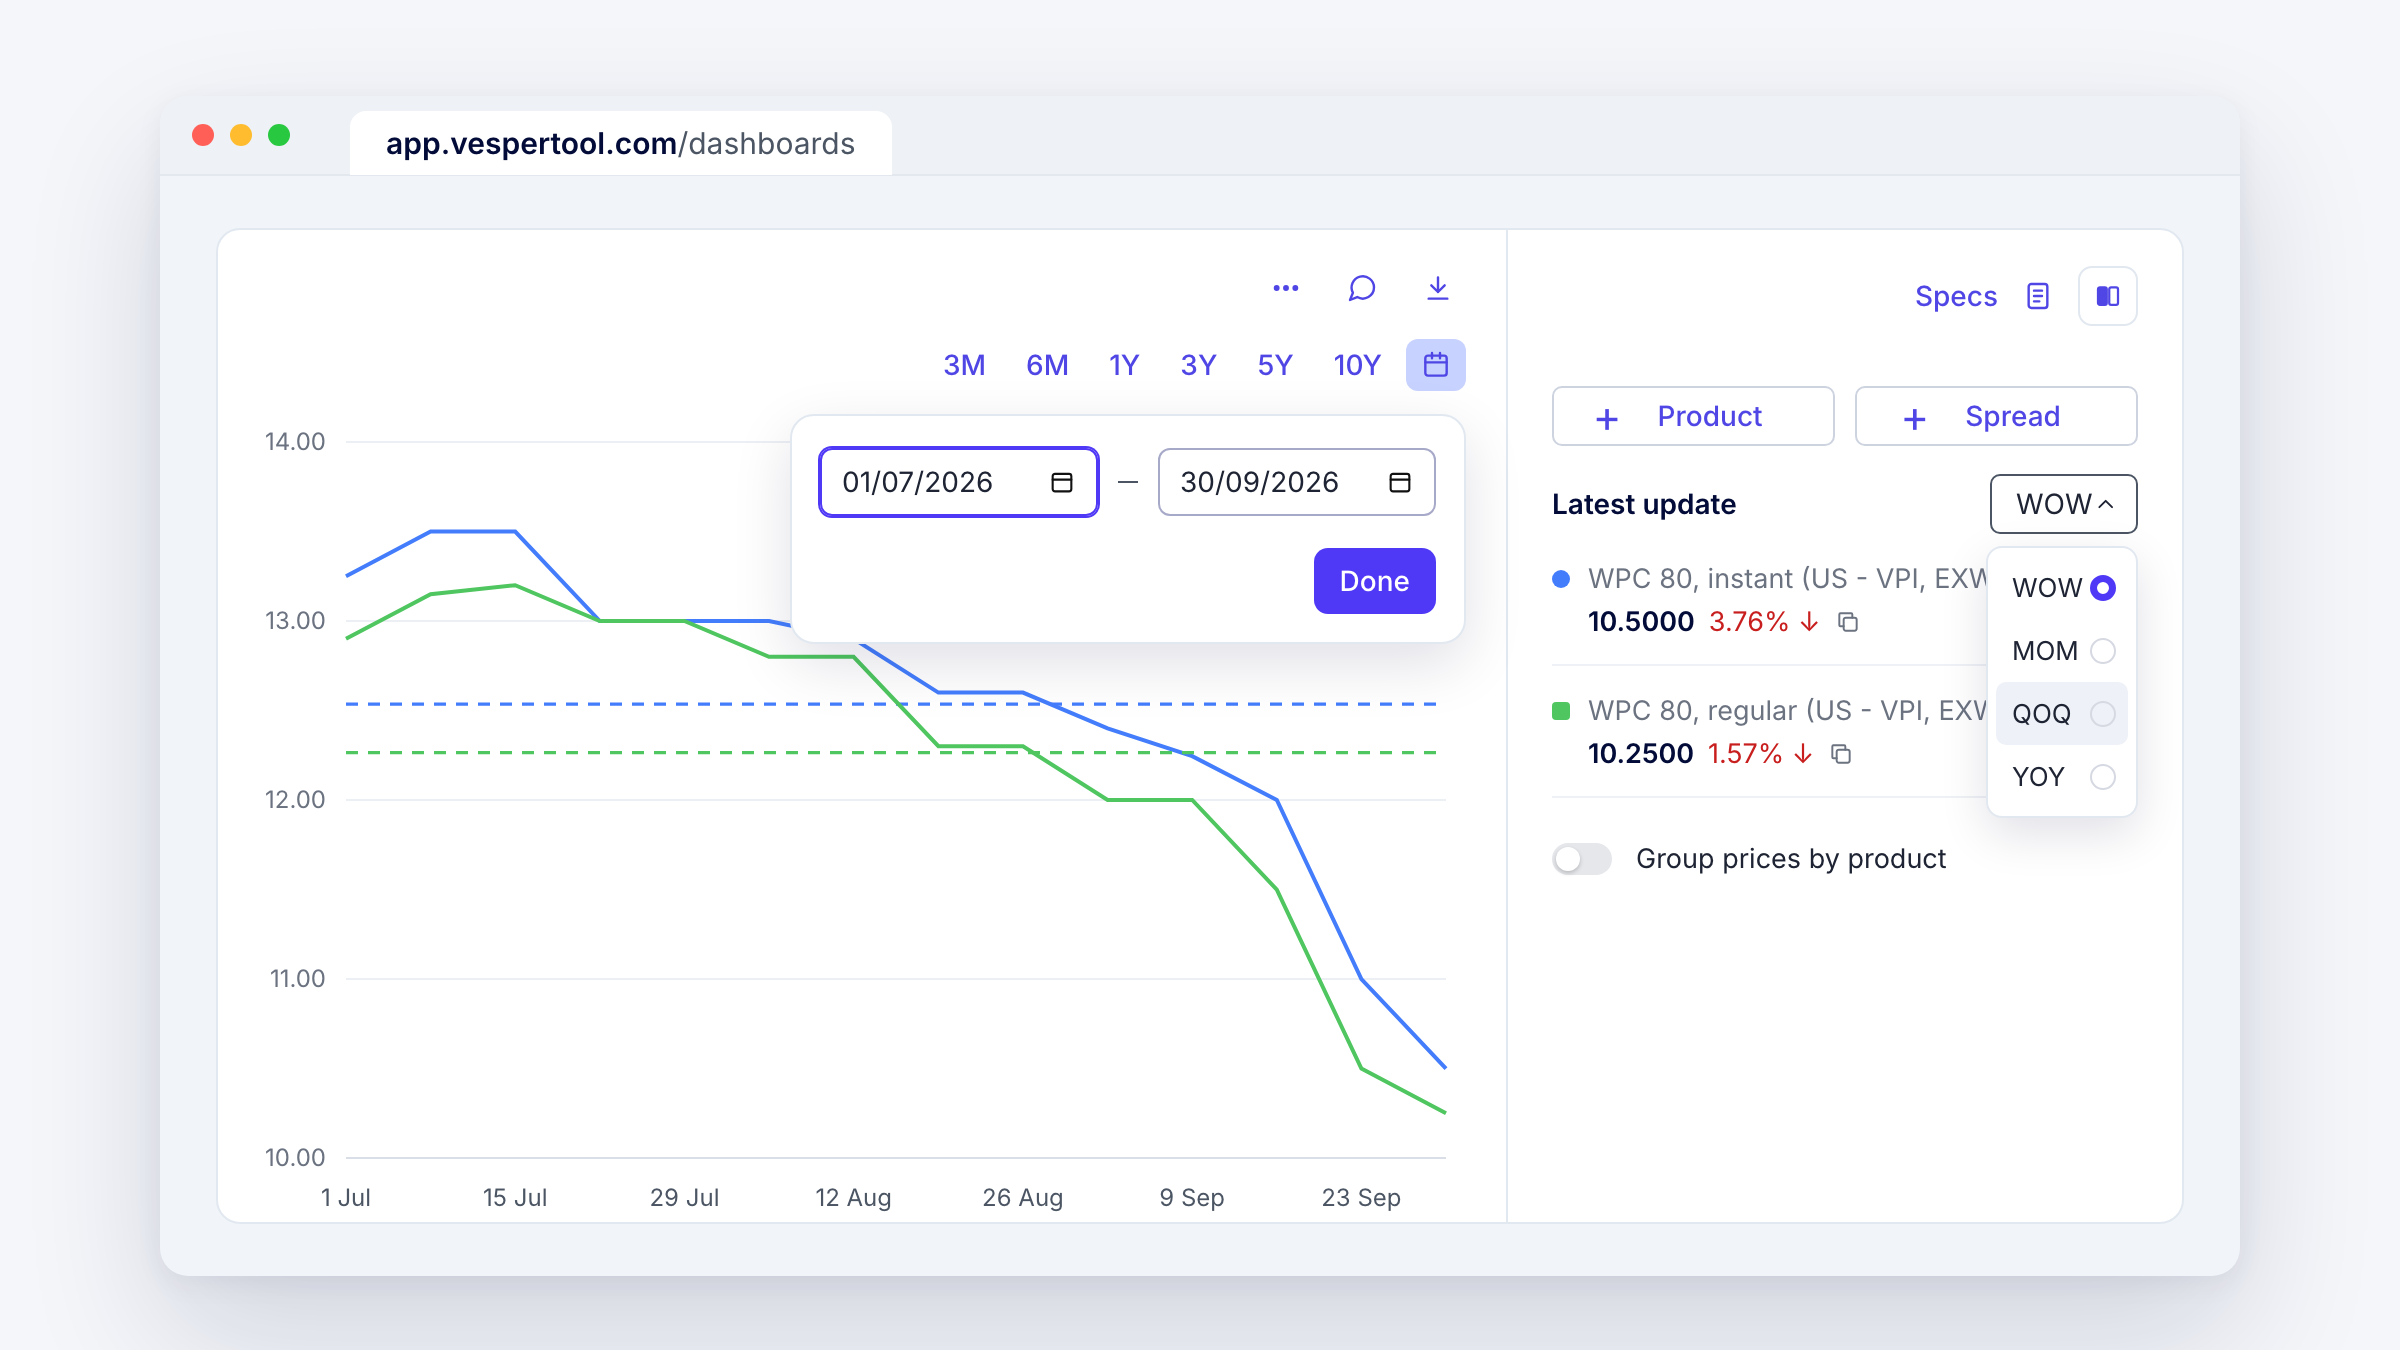
The preset ranges on your charts do not always match the period you need to look at. Graph widgets now have a calendar button next to the 3M, 6M, 1Y, 3Y, 5Y and 10Y presets, so you can set your own start and end date.
What’s new
- Click the calendar button, enter a start and end date and click Done. The graph then shows exactly that period.
- A range can start in 2000 or later and cover up to 10 years.
- It works on the Prices, Forward prices, Futures, Forecast, FX, milk valorization, NZ pasture growth index, Supply & demand, Transportation and Technical analysis widgets.
- In the Prices widget, the Latest update menu now has QOQ next to WOW, MOM and YOY. It sets the period for the price change shown next to each product.
The two settings work separately. The date range decides which dates the graph shows. The Latest update menu decides how far back the price change next to each product looks.
Why this matters
Most buying decisions are tied to a period: a contract year, last season, the quarter before a tender. Setting the chart to exactly that period makes it easier to compare what you paid with what the market did. QOQ gives you the quarterly change that budget and supplier reviews often use.
How to access
Live for all Vesper users. Click the calendar button next to the presets on any of the widgets above, or pick QOQ from the Latest update menu in the Prices widget. Questions? Email support@vespertool.com.