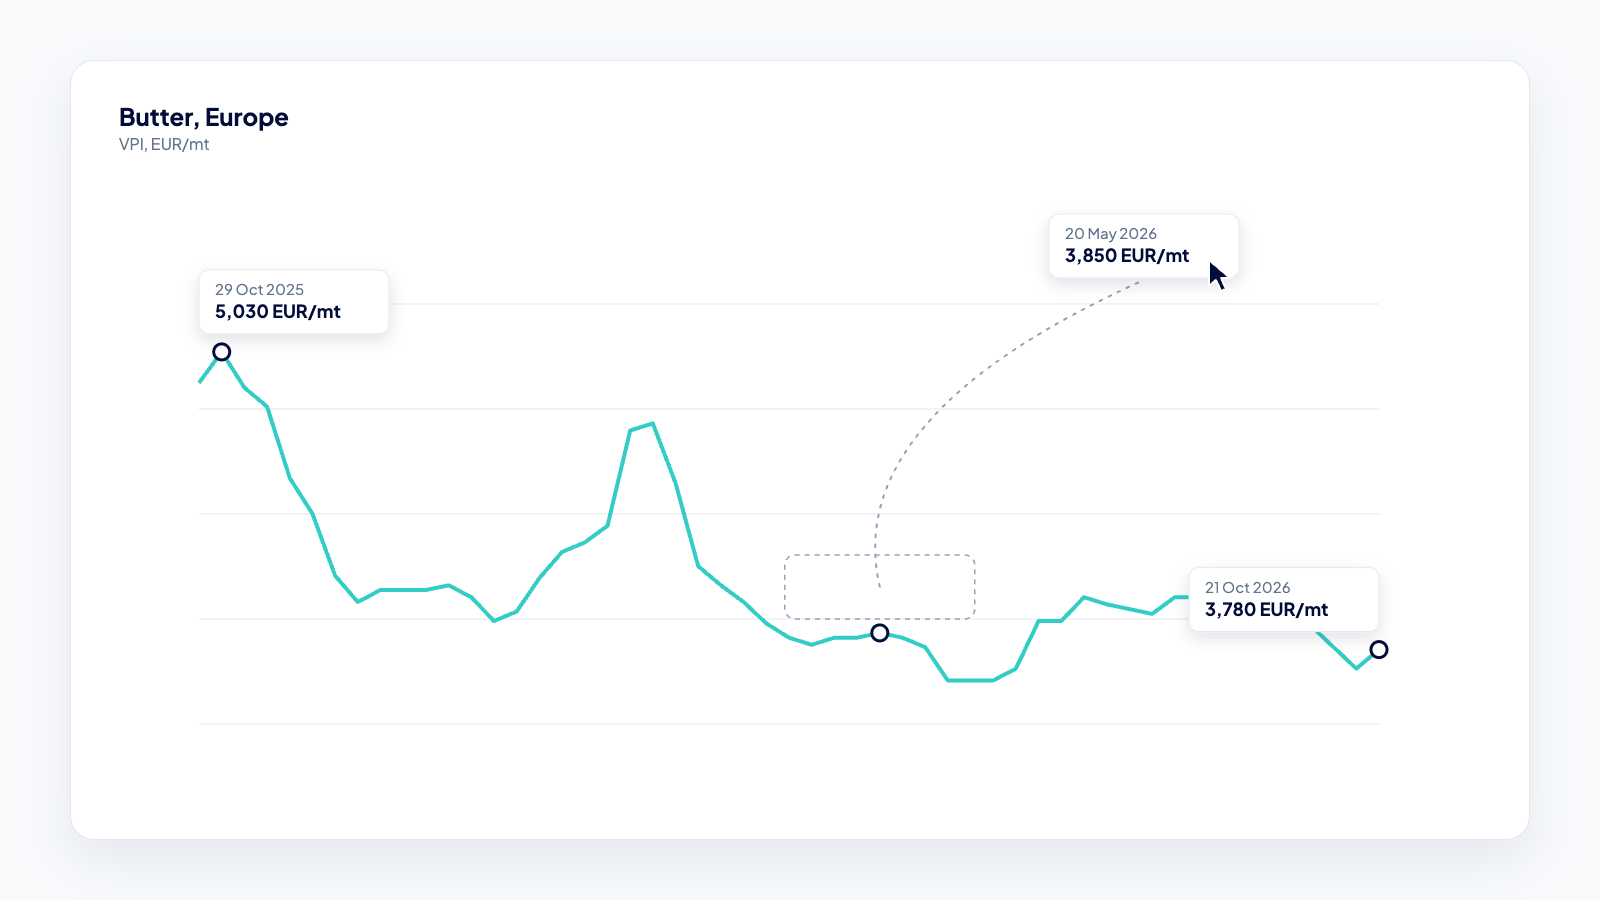
Tooltips on your charts are now draggable. Select several data points, grab a tooltip and drop it wherever it reads best.
Why this matters
With several points selected, tooltips used to overlap and cover the lines you wanted to show. Now you can get a clean chart for a presentation or a screenshot.
How to access
Live for all Vesper users. Select data points on a chart, then drag a tooltip to move it. Questions? Email support@vespertool.com.