The 2026 El Niño is heading for record strength. The Niño-3.4 index averaged +2.1°C in September, and NOAA’s October update put the chance of a historic event, one stronger than any since records began in 1950, at 83% for the October to December season.
In prices, the effect so far has been uneven. Raw sugar prices rose about 46% from their late-July low to their mid-October high, while wheat’s big rally this summer came from the war in the Black Sea.
This guide explains how El Niño reaches commodity prices, why the crop damage tends to arrive months after the weather, how strong the 2026 event is, and what prices have done since it was declared. It is written for procurement and risk teams who buy cocoa, sugar, vegetable oils, coffee or grains.
What is El Niño?
El Niño is the warm phase of a natural climate cycle in the tropical Pacific called the El Niño–Southern Oscillation, or ENSO. During an El Niño, sea surface temperatures across the central and eastern equatorial Pacific run warmer than normal.
That warmth shifts the bands of rising air and rainfall that sit over the ocean. Because the atmosphere is connected, the effects travel far from the Pacific itself, into weather patterns on several continents at once.
The cycle has three phases:
| Phase | What happens in the Pacific | Typical effect on weather |
|---|---|---|
| El Niño | Sea surface runs warmer than normal | Drier and warmer in Southeast Asia, Australia, southern Africa, Central America and parts of India; wetter in the southern US, parts of South America and East Africa |
| La Niña | Sea surface runs cooler than normal | Broadly the reverse of El Niño |
| ENSO-neutral | Sea surface close to its long-run average | No strong pull either way |
Source: NOAA climatology.
Strength is measured by how far Pacific sea surface temperatures climb above normal. NOAA tracks this with the Niño-3.4 index and the three-month Oceanic Niño Index. An event at +2.5°C or more on NOAA’s relative index counts as historic.
How does El Niño affect commodity prices?
El Niño reaches prices through crop yields, and the reason markets care is overlap. The drier, warmer zones it creates sit on top of some of the world’s most important growing regions:
| Region | Typical El Niño weather | Crops in its path |
|---|---|---|
| India and Thailand | Drier, weaker monsoon | Sugar cane |
| Indonesia and Malaysia | Drier and warmer | Palm oil, coconut |
| Philippines | Drier and warmer | Coconut |
| West Africa | Drier and warmer | Cocoa |
| Australia | Drier and warmer | Wheat, canola |
| Central America | Hot and dry | Coffee |
| Argentina and southern Brazil | Wetter | Soybeans, corn |
| Center-South Brazil | Wetter | Sugar cane, coffee |
Source: NOAA climatology; Vesper.
When El Niño is strong, those overlaps can turn into lost yield. When it is weak, or arrives at the wrong point in the crop calendar, the effect can be small. Rain can cut both ways, too: it can help a crop grow and still disrupt the harvest.
Three things decide whether a strong event reaches price:
- Strength. A stronger event widens the dry zones and deepens the rainfall deficit.
- Timing. Weather that hits while a crop is setting does more damage than weather between crops.
- The starting buffer. A market with high stocks can absorb a supply hit that would move a tight market sharply.
The third point is why a strong El Niño does not lift every market at once. Whether it reaches price depends as much on a market’s starting buffer as on the raw strength of the event.
Why does El Niño hit prices months after the weather?
Most crops respond to drought on a delay. A tree crop stressed this season produces less next season, and an annual crop planted into dry soil shows the damage at harvest.
Oil palm is the clearest example: water stress hits its yields six to twelve months later. Coconut runs on a lag of 13 to 14 months.
So the peak of an El Niño in the Pacific is rarely the peak of its effect on supply. For a buyer, the event’s winter peak marks the start of the risk window.
How strong is the 2026 El Niño?
The 2026 event was declared in the middle of the year and has kept strengthening since. NOAA’s October update reported Niño-3.4 at +2.1°C for September, with the regions closer to South America warmer still, and said a strong to very strong El Niño is likely to last through January to March 2027.
Other agencies see it the same way. In September the WMO said the event would keep intensifying and last into at least February 2027, and in late October the UN described it as possibly the strongest in 40 years.
Here is how it compares with recent strong events:
| Event | Peak strength | Ranking |
|---|---|---|
| 2015–16 | About +2.6°C | Largest since 1997–98 |
| 2023–24 | About +2.0°C | Fifth strongest on record |
| 2026–27 | +2.1°C in September, 83% odds of +2.5°C or more | Peak expected December 2026 to February 2027 |
Source: NOAA Climate Prediction Center.
The effects are already visible outside farming. A rainfall deficit linked to the event lowered water levels in the Panama Canal, where authorities reduced the number of vessels allowed through from September.
What has the 2026 El Niño done to prices so far?
The chart below indexes four El Niño-exposed markets to July 2026, the month the event was declared, so you can compare their moves directly.
The moves have been very different from one market to the next:
| Market | Move so far |
|---|---|
| Raw sugar futures | Up about 46% from late July to mid-October; about 30% above a year ago |
| Cocoa futures | Up more than 50% in the month to early July, then held in a range |
| Palm oil futures | Nearby prices lower since August |
| Soybean oil futures | Close to 30% above a year ago, down since July |
| Arabica coffee futures | Spiked in July, now about 31% below a year ago |
| SRW wheat futures | Rallied to late August, then fell back |
| Corn futures | Rallied to September, then eased |
Source: Vesper, as of 4 November 2026.
El Niño is behind some of these moves, and war, energy and biofuel policy are behind others. Separating the two, market by market, is what tells a buyer how much El Niño risk is already in the price and how much is still to come.
What did the 2015–16 El Niño do to commodity prices?
With 2026 likely to reach historic strength, the closest guide is 2015–16, the last event of comparable size. It peaked near +2.6°C, the largest since 1997–98.
The IMF studied its economic footprint. It found that an El Niño shock raises real non-fuel commodity prices by about 5.3% within a year, with food and agriculture the clearest channel.
Our own data shows how unevenly that effect landed across crops:
Sugar and palm oil rallied hard, the grains stayed weak and cocoa moved on its own cycle. The same event, in other words, produced very different price paths depending on where each crop grows and how well supplied its market was going in.
Putting it to work
1. Map your inputs by origin
List each input by where it is grown and check it against the weather table above. Two buyers can face opposite risks from the same El Niño, depending on whether their supply comes from a region that turns drier or one that turns wetter.
2. Look beyond the spot price
Because crop damage arrives on a lag, the El Niño risk in a market can show up in forward contracts long before it shows up in today’s price. Check the forward curve for the months your cover runs into.
3. Follow NOAA’s monthly ENSO updates
They show how strong the event gets and how long it lasts, which decides how far into 2027 the risk window runs.
Get the full El Niño report
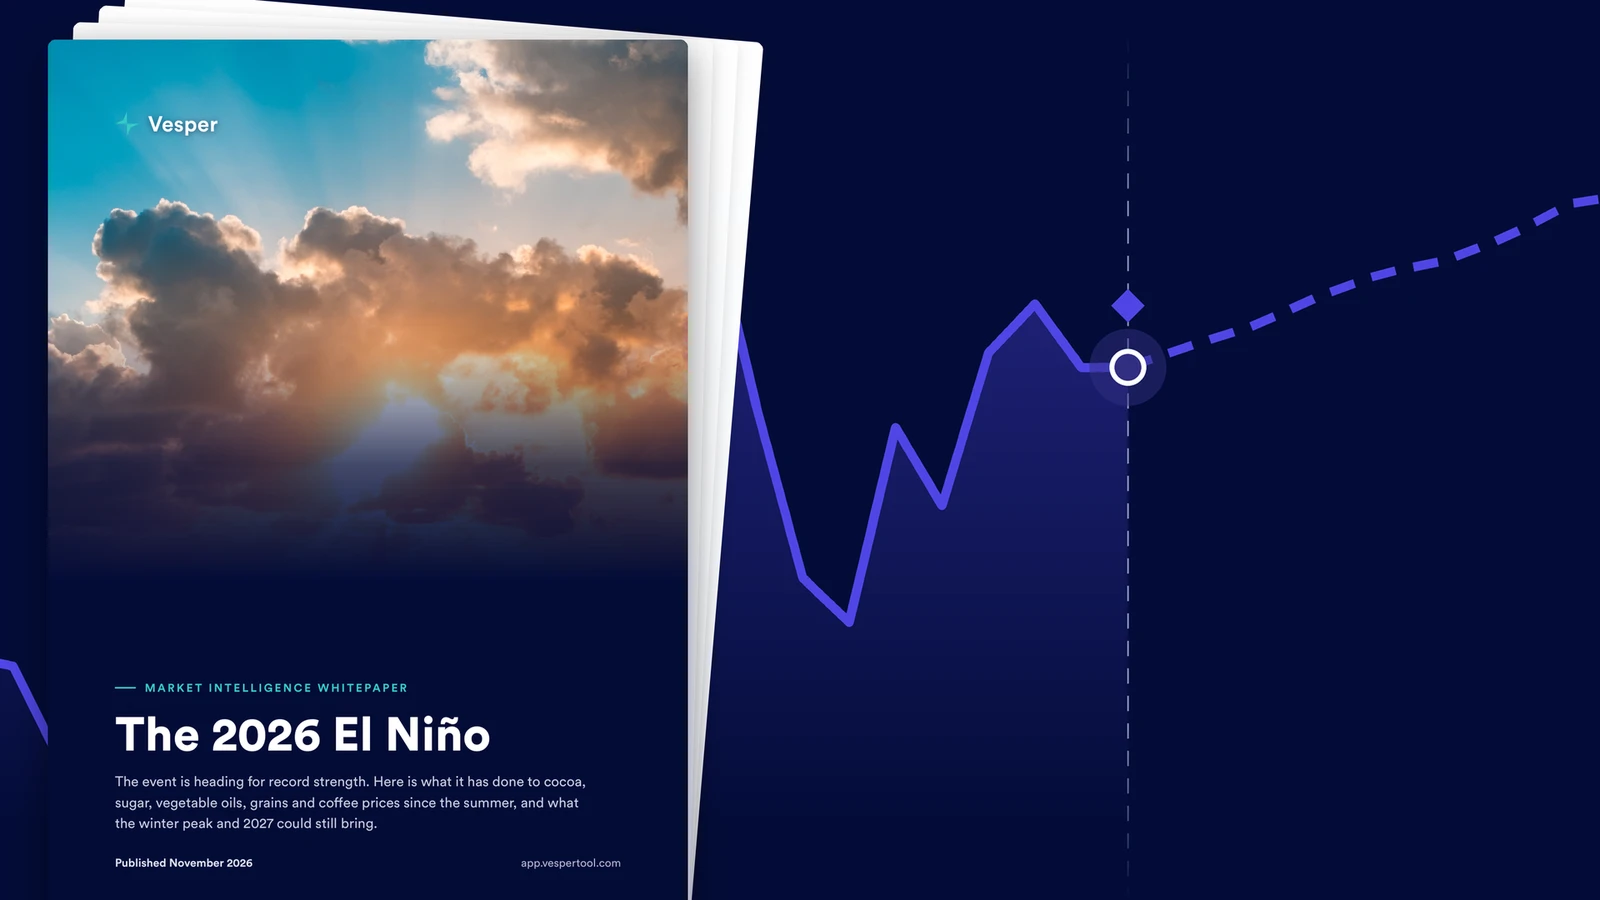
Our report, The 2026 El Niño, goes market by market through cocoa, sugar, palm oil, soybean oil, rapeseed, coffee, wheat and corn. It answers the questions this guide leaves open:
- Which markets have already priced their El Niño risk, and which still carry most of it?
- When is the crop damage expected to land for each market, and which months of 2027 carry the most exposure?
- What the 2015–16 record means for each market in 2026.
- Which inputs face upside price risk, and which could get cheaper.
- The hard signals to track, and what they mean for your sourcing.
Download The 2026 El Niño report to see which of your markets are most exposed, and when.
Frequently asked questions
What is El Niño?
El Niño is the warm phase of a natural climate cycle in the tropical Pacific called the El Niño–Southern Oscillation (ENSO). Sea surface temperatures in the central and eastern equatorial Pacific run warmer than normal, which shifts rainfall patterns around the world. It tends to bring drier, warmer weather to Southeast Asia, Australia, India and West Africa, and wetter weather to parts of South America and the southern United States.
How does El Niño affect commodity prices?
El Niño affects prices through crop yields. Its dry zones overlap with major growing regions for sugar cane, palm oil, coconut, cocoa, wheat and canola, so a strong event can cut supply. The price effect depends on how strong the event is, when it hits the crop calendar, and how much stock the market holds going in. The IMF found an El Niño shock raises real non-fuel commodity prices by about 5.3% within a year.
Which commodities are most exposed to El Niño?
The crops grown in El Niño's dry zones: sugar cane in India and Thailand, palm oil and coconut in Indonesia, Malaysia and the Philippines, cocoa in West Africa, wheat and canola in Australia, and coffee in Central America. Crops in regions that turn wetter, such as Argentina, can benefit instead.
How strong is the 2026 El Niño?
The Niño-3.4 index averaged +2.1°C in September 2026, already above the 2023–24 peak of about +2.0°C. In its October update NOAA put the odds of a historic event, one at +2.5°C or more, at 83% for October to December. The peak is expected between December 2026 and February 2027.
Why does El Niño affect prices months after the weather?
Because crops respond to drought on a delay. A tree crop stressed this season yields less next season: oil palm six to twelve months later, coconut 13 to 14 months later. An annual crop planted into dry soil shows the damage at harvest. So the price effect of an El Niño often arrives well after the event itself peaks.