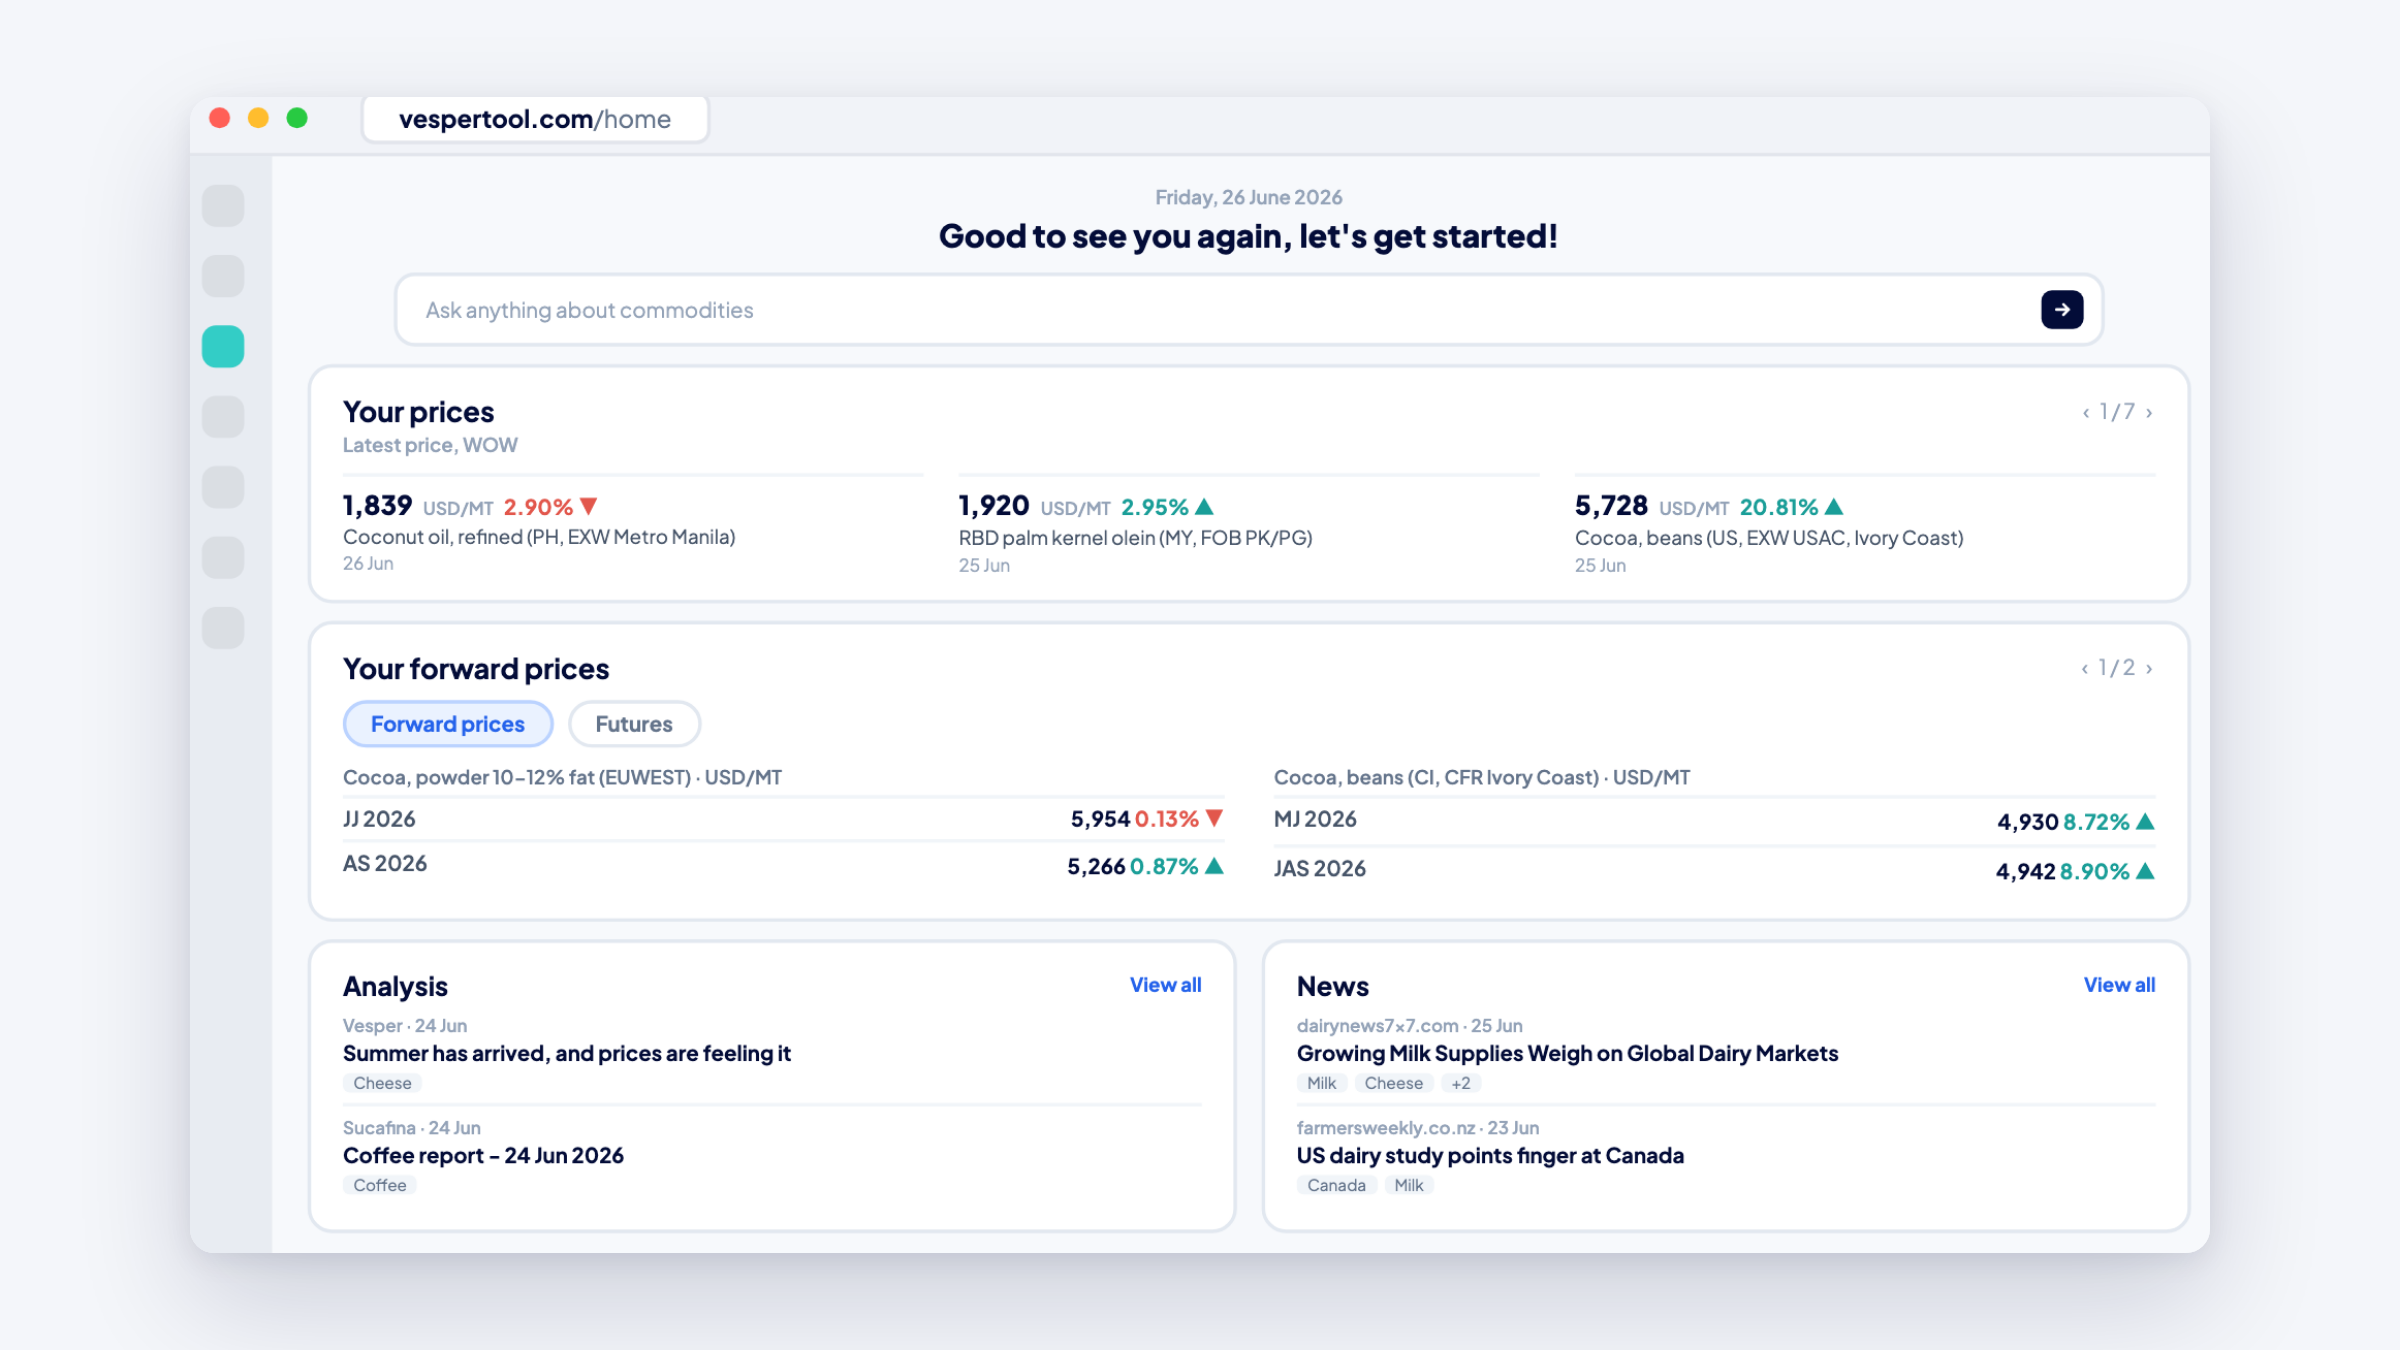

Knowing what comes next in a market, and being able to explain it, is one of the biggest challenges our users face. The answer can lie in a whole range of market drivers. So we made it easier than ever to bring them together: one overview that interprets the drivers for you and sorts every argument into bulls and bears. Click a product on your Homefeed to open the overview report, and open the full analysis for a quarter-by-quarter outlook.
What’s new
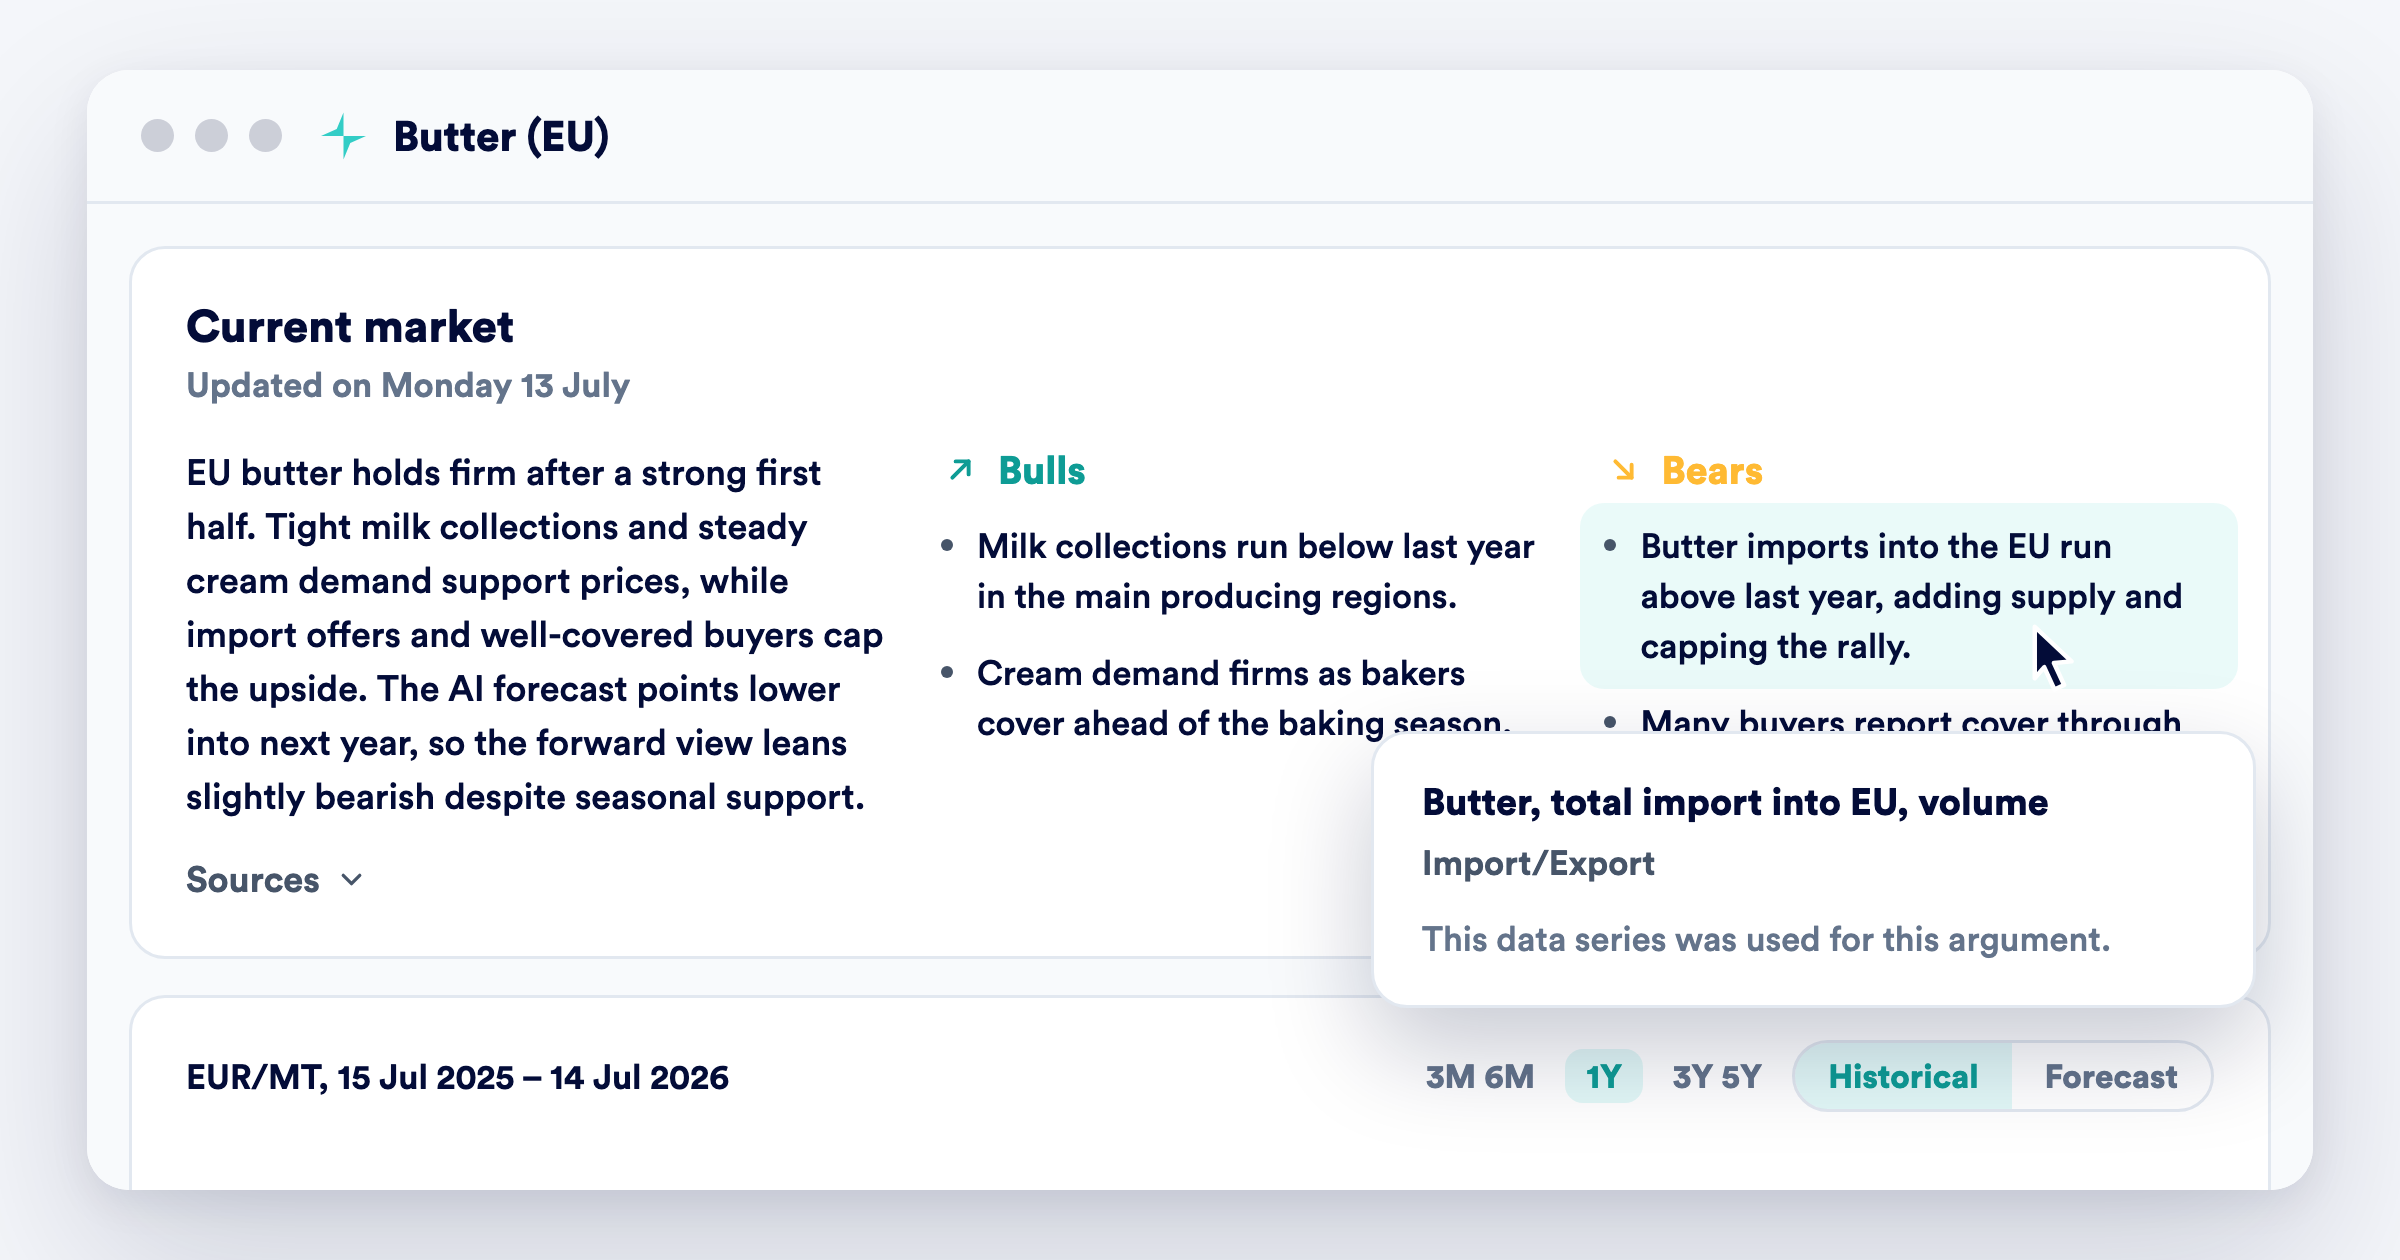
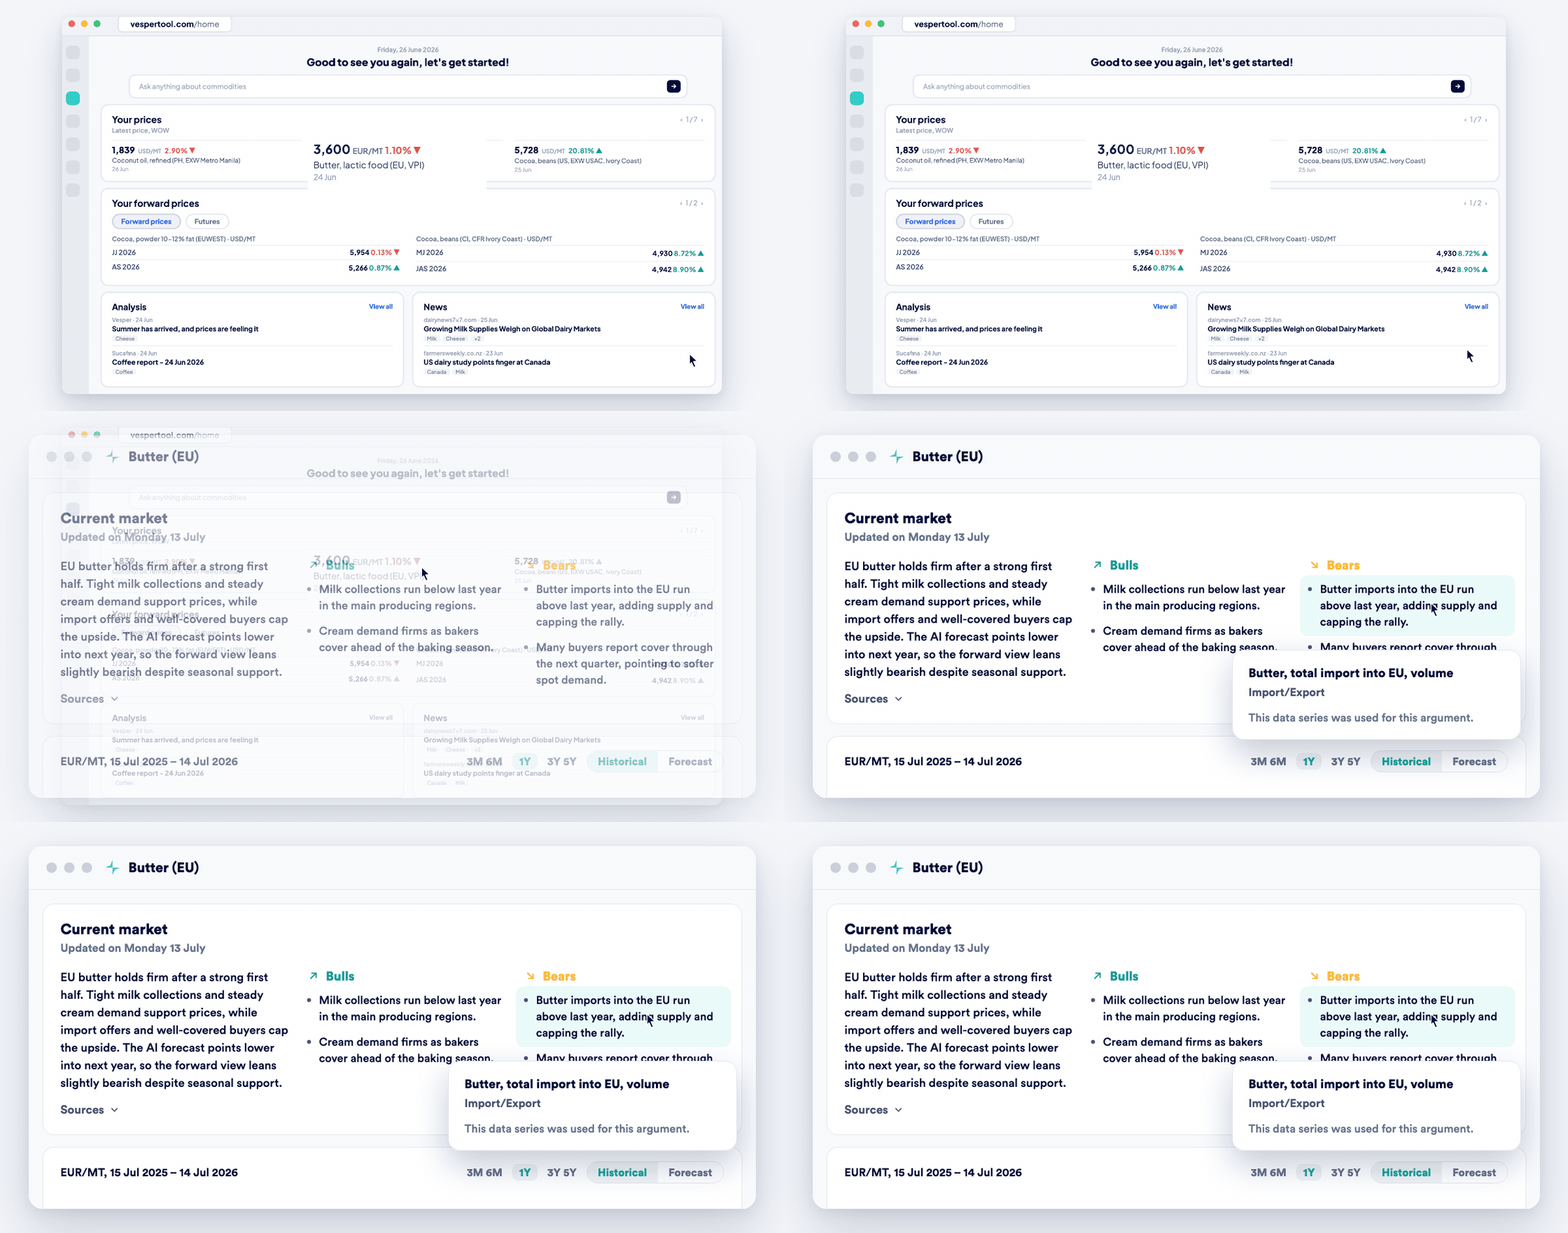
- A market outlook, one click from your Homefeed. Click any price in your list and the outlook for that product opens, starting with a market summary: what is driving the market right now, with the date it was last updated.
- Bulls and Bears. The arguments for a higher price and the arguments for a lower one, side by side. Each argument comes from the reports, news and data already on the platform.
- Every argument traces back to its source. Hover over any bull or bear and Vesper shows where it came from: the report, who published it, the date, and the exact line. From there you can open the full article.
- A forward read on the chart. A quarter-by-quarter view of how the months ahead look for this market.
- View full analysis. The complete outlook on one page, with every source listed underneath.
Why this matters
It is never just one driver that moves a market. Connect the Dots lets you track them all on one screen: the expertise of our human analysts, the depth of the fundamental data on the platform, technical indicators, and the same AI that drives our forecasts. Every perspective on the market sits in one place, and the outlook helps you weigh them properly.
That gives you a clear view of where the price could head, plus the arguments behind it. Those arguments are what you need when you explain your choices, inside your own company and to the stakeholders you deal with outside it.
And every argument carries its source, which makes it a starting point rather than a conclusion. Open the source material, read the original reporting, and form your own view. You stay the human in the loop, and every source you follow strengthens your own argumentation and the decision behind it.
How to access
Connect the Dots is available on Premium and Pro. Open your Homefeed and click any price in your list.
Every outlook shows the date it was last updated. Outlooks rebuild every Sunday night, so for a move that happened this morning, check the price chart directly.
It covers over 90% of the products our users track today. If a product you follow is missing, email support@vespertool.com and we’ll add it.