A tub of whey protein powder is about as close to a raw commodity as a branded food gets. Most of what is inside is one dairy ingredient, bought by the tonne, and the factory step that turns it into a tub is short and cheap. So when whey protein moves, the cost of the tub moves almost with it.
This post takes a typical 1 kg tub of chocolate whey protein apart. It shows what each layer of cost is, how big it is, what happened to it over the past year, and which levers actually change the result. It is one worked example of should-cost analysis: estimating what a product ought to cost from its inputs, rather than taking the quoted price as given.
It is written for procurement and finance teams at sports nutrition brands, for private-label buyers, and for contract manufacturers pricing a powder for a client. If you want the method for costing a single whey protein input, our Knowledge Hub shows how to calculate product cost from whey protein concentrate prices. This post covers the whole tub.
What does it cost to make whey protein powder?
The cost of making whey protein powder is mostly the cost of the whey protein. In our illustrative model, the protein (WPC80 with a little whey protein isolate) makes up 67% of the cost of a 1 kg tub. The cocoa, flavours, sweetener, thickener and lecithin add another 7%, packaging 7%, energy 1%, and labour, quality testing, overhead, logistics and margin the remaining 18%.
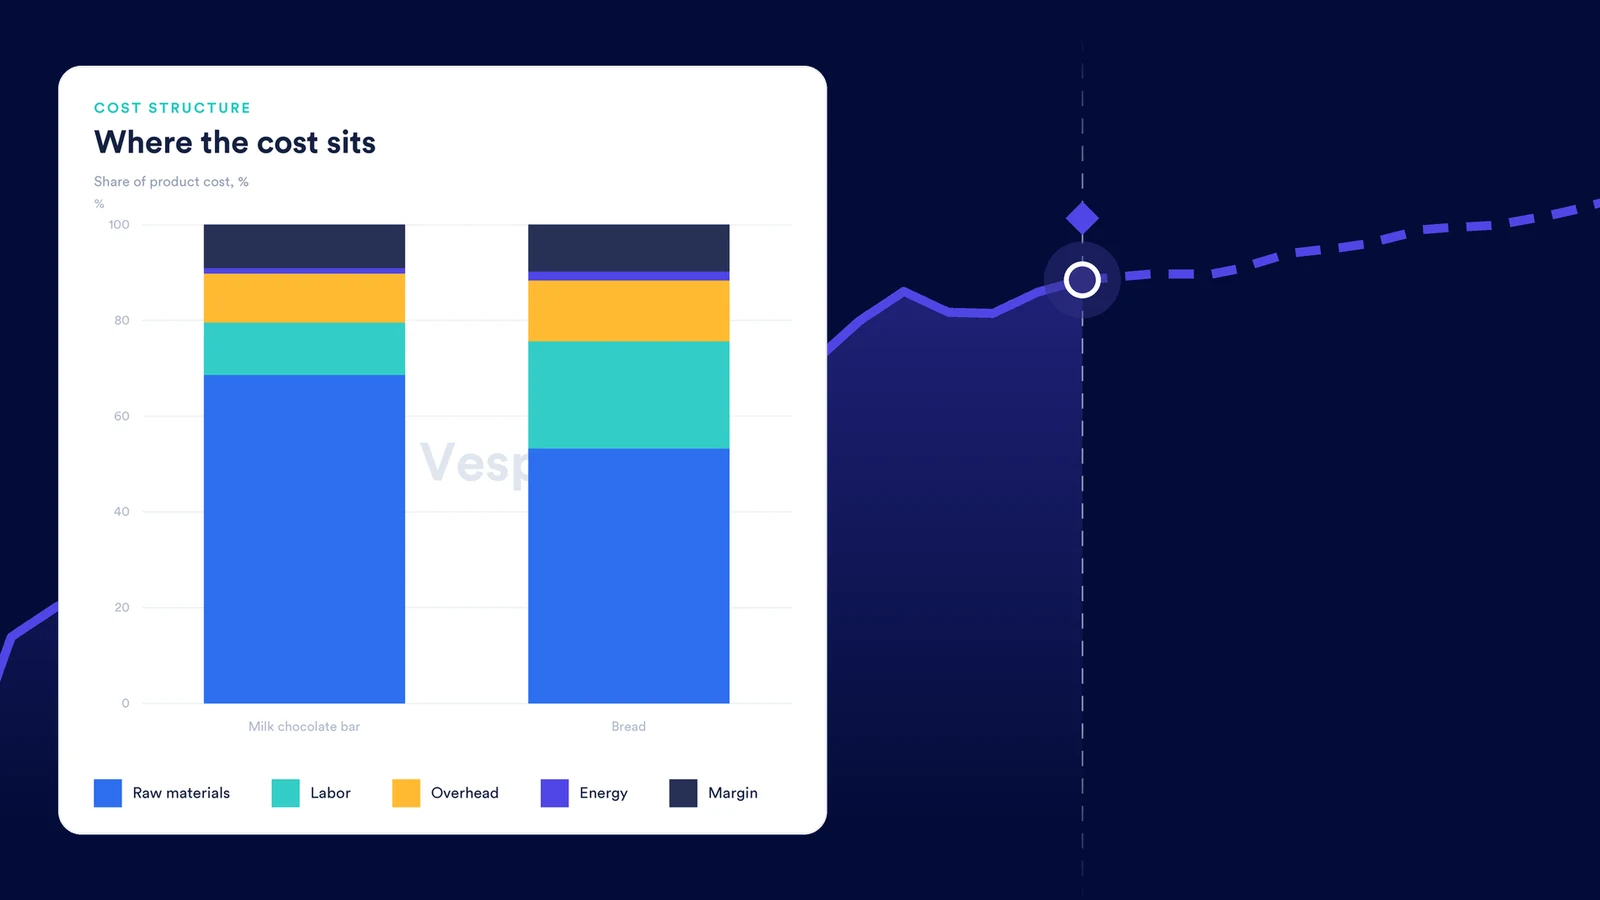
That is a much steeper profile than other products in this series. In our protein bar cost breakdown the dairy protein blend is 32% of unit cost, because a bar also carries syrups, fats, a coating and a lot of packaging per gram. A powder is almost all protein, so it follows the whey market first and everything else a distant second.
These shares are our estimate, built from a typical recipe (below) and typical ingredient price relationships at November 2025. They are an assumption for teaching, not a measured industry average. They describe the cost to make a tub, ex works, including the contract manufacturer’s margin. The shelf price adds the brand’s own costs and margin, the retailer’s margin and VAT on top. Replace the shares with your own supplier’s breakdown as soon as you have it.
The cost stack of a 1 kg tub
| Cost layer | Share of unit cost (illustrative) | What sits in it |
|---|---|---|
| WPC80 (instant) | 60% | WPC at 80% protein, lecithinated so it mixes in a shaker |
| Whey protein isolate | 7% | WPI, about 90% protein, to lift protein per scoop |
| Cocoa powder | 2% | Fat-reduced cocoa for the chocolate flavour |
| Flavour, sweetener, thickener | 5% | Flavourings, sucralose or stevia, xanthan gum, salt, extra lecithin |
| Tub and lid | 4% | Injection-moulded HDPE or PP tub and lid |
| Scoop, label, seal | 2% | Measuring scoop, label, induction seal |
| Shipping case | 1% | Corrugated case and pallet share |
| Energy | 1% | Power for blending, sieving, filling and sealing |
| Labour, testing, overhead, margin | 18% | Line staff, cleaning, lab tests, depreciation, logistics and the maker’s margin |
| Total | 100% |
Our estimate for a 1 kg tub of chocolate whey protein powder, rounded to the nearest whole percent. Your recipe and contracts will give different shares.
Three things stand out.
Protein is two thirds of the bill. A price move in the protein passes into unit cost in proportion to that share: a 10% rise in WPC80 alone adds about 6 points. There is no other line large enough to offset it.
Energy is tiny, because the energy is in the whey. The heavy energy use in whey protein happens upstream, at the dairy, where liquid whey is filtered, concentrated and spray dried. That cost is already inside the WPC80 price. The plant that makes the tub only mixes dry powders and fills them.
Conversion is short but not free. Blending and filling are quick, but every batch needs testing, every flavour change needs a clean-down, and allergen and contaminant controls add lab cost. On a product with few process steps, that testing and cleaning makes up a real part of the 18%.
The recipe: what goes into a tub
A chocolate whey protein powder is a dry blend. The ingredient list on most tubs in the category reads much the same: WPC (and sometimes isolate), fat-reduced cocoa powder, flavourings, a thickener such as xanthan gum, an emulsifier (lecithin), a sweetener such as sucralose or steviol glycosides, and salt. Our illustrative recipe:
| Ingredient | Share of tub weight (illustrative) | Job in the powder |
|---|---|---|
| WPC80, instant | 84% | Main protein source, taste, mixability |
| Whey protein isolate | 8% | More protein per scoop, less lactose and fat |
| Fat-reduced cocoa powder | 5% | Chocolate flavour and colour |
| Flavourings | 2% | Taste, masking dairy notes |
| Xanthan gum, salt, sweetener | 1% | Body in the shake, flavour balance, sweetness |
Our assumption, based on typical ingredient lists. Sweeteners are used at a fraction of a percent.
That recipe gives about 73 g of protein per 100 g of powder, or about 22 g in a 30 g scoop (our calculation, at typical protein contents of about 77% as sold for WPC80 and 88% for WPI). That is in the usual range for the category.
How it is made
Making a tub of whey protein powder is a short process. The plant receives WPC80 and the other ingredients in bags, weighs them, mixes them in a ribbon or tumble blender, sieves the blend and runs it past a metal detector. An auger filler doses each tub by weight, a scoop goes in, the tub is induction sealed, capped and labelled, and the tubs go into cases.
The “instant” in instant WPC80 means the dairy has already coated the powder with a little lecithin so it wets and disperses in a shaker without clumping. That costs a little more than regular WPC80, and it is why a separate lecithin line in the recipe is often small.
Where WPC80 comes from
WPC80 is a by-product of cheese. When milk is made into cheese, the liquid whey that drains off is filtered to concentrate the protein, and the retentate is dried into WPC80. The lactose that passes through the filter becomes permeate or lactose market supply, and whey that is not fractionated is dried as sweet whey powder.
So a whey processor chooses what to make from the same stream, and the prices of those products move together but not in step. In the year to 11 November 2026, European sweet whey powder rose 94.4% and lactose 36.8% on the Vesper Price Index (EXW), against 26.4% for WPC80. For a protein powder buyer, that means the whey protein price is set by the cheese and whey markets, not by what it costs to make a tub.
Our guide to dairy protein grades covers how WPC80, WPI and milk protein concentrates differ in specification and use.
What moved in the last 12 months
Here is how the main whey protein powder inputs moved over roughly the past year, using the latest available price against the nearest observation about a year earlier:
The protein story first. On the Vesper Price Index (EXW):
- European WPC80 prices (instant) rose 26.4% between 12 November 2025 and 11 November 2026. Over two years, from November 2024, the rise is 46.3%.
- The European whey protein isolate market rose 22.0% between 19 November 2025 and 11 November 2026.
- US WPC80 (instant) rose 33.3% over the same period, measured in EUR.
- The European MPC 85 market rose 101.3%. It roughly doubled.
A 12-month figure hides most of what happened in between. European WPC80 more than doubled in the first half of 2026, peaked on 1 July, and has fallen 43.4% since. Whey protein isolate rose much less, peaked later, on 12 August, and is down 21.9% from that peak.
Two Dutch sports nutrition brands, XXL Nutrition and Upfront, told their customers in March why whey prices were going up in 2026. The rise kept going for three more months after that. Since September the market has turned: our analysts reported in early November that WPC80 has fallen level with MPC85, with producers pushing to sell before year end and buyers delaying their first-quarter cover.
The rest of the basket is small, but it moved too:
- Flavour system. West-EU cocoa powder 10-12% fat quotations (partner prices, EXW Amsterdam, Rotterdam and Hamburg) fell 6.6% between 17 November 2025 and 16 November 2026. Central-EU sucralose price data (partner prices, EXW) shows a 20.8% fall between 18 November 2025 and 5 November 2026. EU lecithin import prices (Eurostat, CIF) rose 3.5% between December 2025 and September 2026.
- Packaging. West-EU HDPE resin prices (partner prices, EXW) rose 46.2% between December 2025 and October 2026. Recycled testliner prices (West-EU, partner prices, EXW), our proxy for the shipping case, rose 21.6% over the same months.
- Energy. German power prices (base month, EEX) rose 127.1% between 17 November 2025 and 16 November 2026.
What that did to unit cost
To turn price moves into a cost change, weight each one by its share of unit cost and add the results. A 26.4% rise in an input that is 60% of cost adds about 16 points. A 127% rise in an input that is 1% of cost adds about 1.3.
Using the illustrative stack from above, over the year to November 2026:
| Input | Share of unit cost | 12-month move | Effect on unit cost |
|---|---|---|---|
| WPC80 instant (Europe) | 60% | +26.4% | +15.84 points |
| WPI (Europe) | 7% | +22.0% | +1.54 points |
| Cocoa powder 10-12% fat | 2% | -6.6% | -0.13 points |
| Flavour, sweetener, thickener | 5% | held flat | 0 points |
| Tub and lid: resin (HDPE), half the line | 2% | +46.2% | +0.92 points |
| Tub and lid: moulding, half the line | 2% | held flat | 0 points |
| Scoop, label, seal | 2% | held flat | 0 points |
| Shipping case (testliner) | 1% | +21.6% | +0.22 points |
| Energy (German power as proxy) | 1% | +127.1% | +1.27 points |
| Labour, testing, overhead, logistics, margin | 18% | held flat | 0 points |
| Total | 100% | +19.7% |
Our calculation from Vesper, Eurostat and EEX price changes to November 2026. Cost shares are illustrative. We hold the flavour line flat because flavourings, its largest part, have no market price; the fall in sucralose would lower it slightly.
The protein adds 17.38 points on its own, almost nine tenths of the total. Packaging adds about 1.1 points, almost all of it from resin. Energy more than doubled in price but adds only 1.3 points, because so little of it is used at the blending plant. Cheaper cocoa barely registers.
The base date decides the answer
The last figure in that grid is the one to remember. Measured from November 2025 to mid-July 2026, European WPC80 was up 119.2% and WPI 53.7%. Weighted by the same shares, protein alone had added about 75 points to the cost of a tub (our calculation). By November that had come back to about 17 points.
To put it in money: for every €1.00 our illustrative tub cost to make in November 2025, protein alone added about 75 cents by mid-July 2026. By November 2026 it added about 17 cents.
So the same tub, with the same recipe, could justify an increase of around three quarters or of under a fifth, depending only on which month a supplier measures to. That is also why the formula uses the shares at the base date. At the July high, protein was over three quarters of unit cost in our example (our calculation). A supplier who applies that share to the full rise counts part of it twice.
Three honest limits on this example:
- The protein blend drives everything. A WPI-heavy powder saw a smaller rise and a smaller fall than a WPC80 powder. A blend with MPC follows that market, and MPC85 roughly doubled this year.
- Packaging and energy are proxies. A moulded tub is resin plus a moulder’s conversion and margin, so we let only half the tub line follow resin. A plant on a fixed power contract will not have seen the full exchange move. If energy held flat, the total is about +18.4%.
- Forward cover changes the timing. Contract manufacturers often buy protein months ahead. A maker that covered in late 2025 felt little of the spike. One that bought in May or June is now carrying expensive stock into a falling market, and may ask for a price that reflects its stock, not today’s market.
If you want to run this as a model every month, here is how to build a should-cost model from scratch, and how to use the same arithmetic to respond to a supplier price increase.
The levers: what changes your exposure
Price is only one input. These recipe, format and buying choices change how much each whey move reaches the cost of a tub.
Lever 1: when the protein is bought
In a product where protein is two thirds of cost, the buying date is the biggest lever of all. This year, cover bought in late 2025 or early 2026 was worth tens of points of unit cost against cover bought in May or June. Cover bought into the peak is now the expensive kind.
Looking ahead, the Vesper forecast for European WPC80 points lower over the next six months, and our analysts did not yet see a bottom in early November. That is a direction, not a promise, and how our WPC80 forecasts work explains what goes into it. For a buyer, it argues for buying in layers rather than all at once: our guide to forward buying with layered cover shows how.
Lever 2: WPC80 or isolate
Isolate costs more per tonne than WPC80, but it carries more protein per gram, and this year it was the calmer market. Between November 2025 and mid-July 2026 European WPI rose 53.7% while WPC80 rose 119.2%. Over the full year the two ended close together, at +22.0% and +26.4%.
Compare the two on cost per gram of protein, at the shares in your own recipe, and recheck the comparison every quarter. Our Knowledge Hub explains the trade-off between whey protein concentrate and isolate in more detail.
Lever 3: MPC or plant protein
The usual swaps did not pay this year. MPC85 roughly doubled, rising faster than WPC80 over the year, and at the start of November WPC80 had fallen level with MPC85, so there is no price reason left to switch. Plant protein brings its own markets, flavour masking and a different amino acid profile, and our post on plant-based protein powders and whey covers that trade-off. A switch is a product decision with a cost case, not a cost decision on its own.
Lever 4: where the whey comes from
US WPC80 rose 33.3% in the year to November, measured in EUR, against 26.4% for the European series. At a 60% share, buying US rather than European WPC80 would have added about 4 more points to unit cost in our example (our calculation). Our analysts also reported that European WPC80 now trades below US product. Origin is worth rechecking each time you buy, because the gap moves.
Lever 5: the protein claim
The number on the front of the tub decides how much protein goes in. Under the EU’s nutrition and health claims regulation, “high protein” needs only 20% of energy from protein, which any whey protein powder clears easily. The real constraint is the per-scoop figure brands compete on.
EU guidance on labelling tolerances allows a measured protein value up to 8 g per 100 g either side of the declared figure, for foods above 40 g per 100 g. Makers still formulate at or slightly above the claim, because the declared figure is what retailers and testers check. In our recipe, each extra gram of protein per 100 g of powder needs about 1.3 g more WPC80, which adds about 0.9 points of unit cost (our calculation). A claim set a few grams higher than the product needs is a permanent cost.
Lever 6: flavour and the number of flavours
Unflavoured powder skips the cocoa and most of the flavouring, so it is the cheapest tub to make. Chocolate needs cocoa powder, and the West-EU cocoa powder market fell 6.6% this year. Sucralose fell 20.8%, though at a fraction of a percent of the recipe that hardly matters.
The bigger flavour cost is in the factory, not the recipe. Every flavour change on a powder line needs a clean-down to avoid carry-over, and every flavour is its own batch to test. A range of twelve flavours costs more per tonne to make than a range of four.
Lever 7: tub, pouch and tub size
Packaging is 7% of cost, and the rigid tub is the biggest part of it. HDPE resin rose 46.2% between December 2025 and October 2026, so plastic weight per kilo of product now matters more. A flexible pouch typically uses less plastic by weight than a rigid tub, and a larger tub spreads the lid, scoop, seal and label over more powder. Both are product decisions, since shoppers judge a tub differently from a pouch, but both lower packaging cost per kilo.
Lever 8: yield and giveaway
Powder lines lose material in dust, at start-up and changeover, and in rejected fills. An auger filler that overfills each 1 kg tub by 1% gives away about 0.7 points of unit cost on ingredients alone (our calculation, 74% ingredient share). Cutting powder losses from 2% to 1% saves about the same.
Neither shows up in a commodity price. Both show up in the cost of every tub.
What this means for your next supplier conversation
For a brand using a contract manufacturer, or a private-label buyer, the useful question is not “did whey go up?”. It is “which proteins, at what share of this tub’s cost, from which base date, bought when?”.
Before you accept or push back on a protein powder price change, get:
- The supplier’s cost shares for WPC80, WPI, other ingredients, packaging and energy, in %, at the base date of your last agreement.
- The protein grades in the recipe and their origin: European or US WPC80, isolate, any MPC or casein.
- When the protein was bought, and how much of it was bought forward.
- The base month and the end month for each price move they quote.
Then run the share × move sum yourself. Measured to July, a whey-heavy tub could justify a very large increase. Measured to November, it justifies much less, and if the market keeps falling, a price agreed at the peak is the one worth reopening.
Putting it to work
A whey protein powder’s cost is a weighted sum with one weight that dominates everything. Once you know your protein share, your blend and when you buy, every WPC80 or isolate move turns into points of unit cost you can check.
Pick your two highest-volume tubs and fill in the share table above with your own recipe and contract prices. Then decide which lever is worth pulling: the buying calendar, the blend, the protein claim, the flavour range or the pack.
To keep the calculation live, Vesper Cost Models link each ingredient in your recipe to a Vesper price series, add labour, overhead and margin for your country and industry, and update automatically when prices move. You see what your tub should cost today and which input moved it.
Frequently asked questions
How much does it cost to make 1 kg of whey protein powder?
It depends mostly on the price of the whey protein you buy, so the useful answer is the cost structure. In our illustrative 1 kg tub of chocolate whey protein powder, the protein (WPC80 with a little whey protein isolate) is 67% of the cost to make it. Other ingredients are 7%, packaging 7%, energy 1%, and labour, testing, overhead, logistics and the maker's margin 18%. Replace these shares with your own supplier's breakdown when you have it.
What is the biggest cost in whey protein powder?
The whey protein itself. A tub is mostly WPC80, sometimes blended with whey protein isolate, and blending and filling powder is cheap compared with baking or cooking. In our example protein is about two thirds of unit cost, so a 10% move in WPC80 changes the cost of a tub by about 6 points.
Why did whey protein powder cost so much more in 2026?
Because whey protein prices more than doubled in the first half of the year. On the Vesper Price Index, European WPC80 (instant, EXW) was 119% above its 12 November 2025 level by mid-July 2026. It has fallen 43.4% from its 1 July peak since, and on 11 November 2026 it was 26.4% above a year earlier. In our illustrative tub, that year-on-year move adds about 17 points to unit cost on its own.
Is whey protein isolate or WPC80 cheaper to use in protein powder?
WPC80 costs less per tonne, but compare the two on cost per gram of protein, because isolate carries about 90% protein against about 80% for WPC80. This year isolate was also the calmer input: European WPI rose 22.0% in the year to 11 November 2026 against 26.4% for WPC80, and it peaked well below WPC80's mid-year high.
How can a brand check a contract manufacturer's price increase on protein powder?
Ask for the cost shares by input at the base date of your last price agreement, and for the date the protein was actually bought. Multiply each share by that input's price change from an independent index over the same period and add the results. With whey protein moving this fast, the base date can change the answer by tens of points, so agree it before you discuss the number.