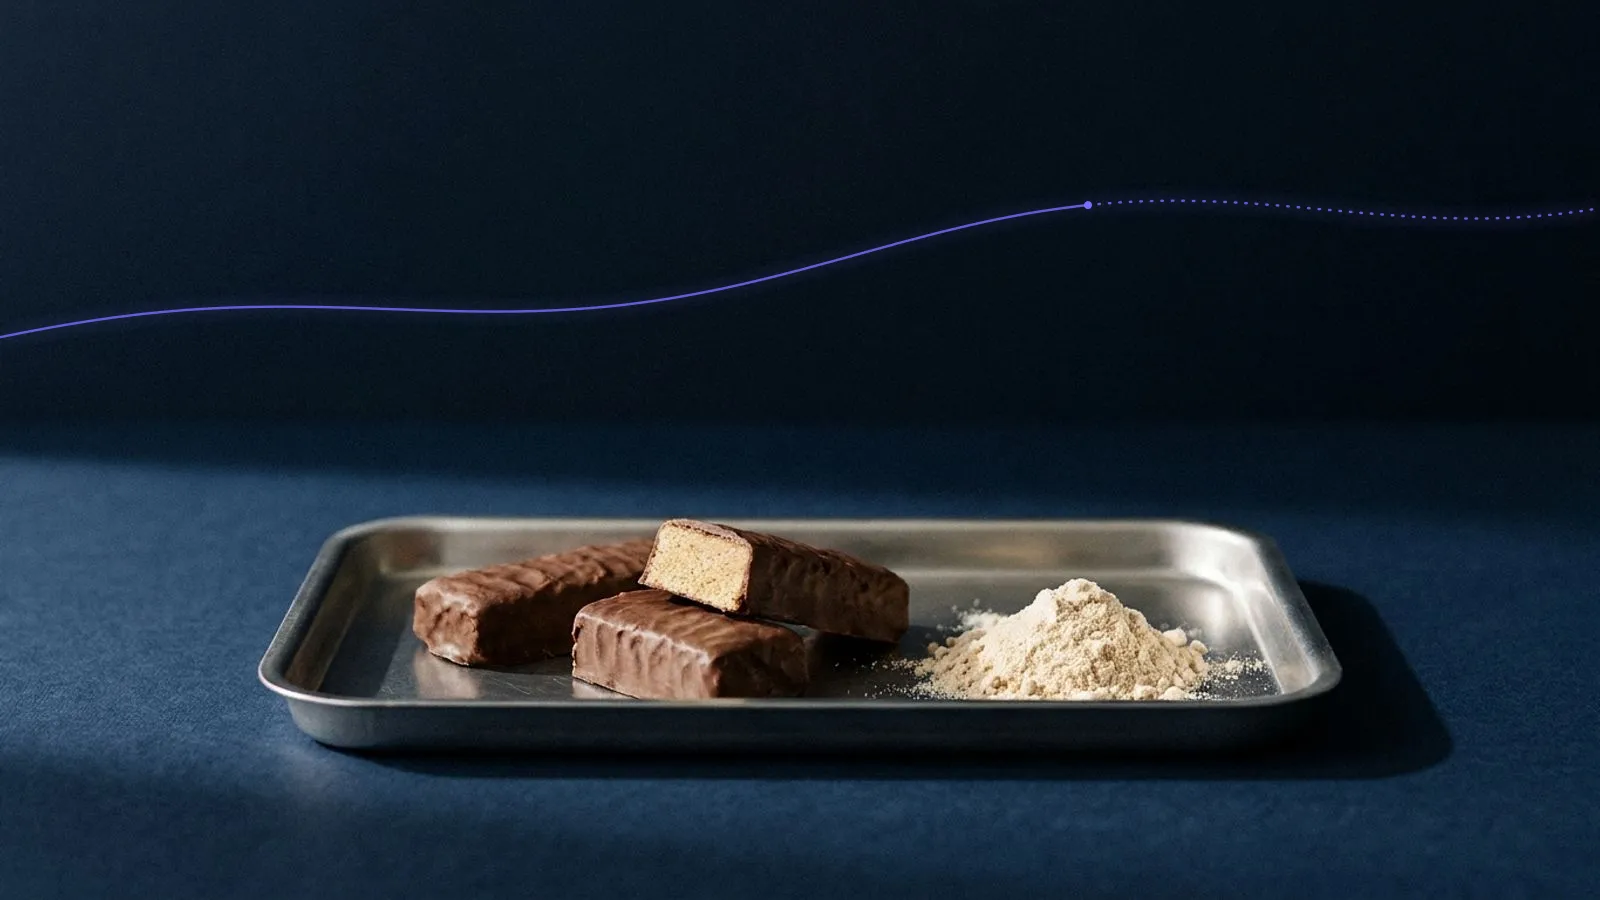
A protein bar looks like a snack and costs like a dairy product. Most of its cost sits in a few grams of dairy protein, and in the 12 months to October 2026 those grams got a lot more expensive.
This post takes a typical coated whey protein bar apart. It shows what each layer of cost is, how big it is, what happened to it over the past year, and which levers actually change the result. It is one worked example of should-cost analysis: estimating what a product ought to cost from its inputs, rather than taking the quoted price as given.
It is written for procurement and finance teams at sports nutrition brands, for private-label buyers, and for contract manufacturers pricing a bar for a client. It is about what a bar costs to make, not what a bar line costs to build.
What does it cost to make a protein bar?
The cost of making a protein bar is mostly the cost of its protein. In our illustrative model, the dairy protein blend (WPC80, MPC and a little whey protein isolate) makes up 32% of unit cost. The coating, syrups, fats and other ingredients add another 27%, packaging 12%, energy 3%, and labour, overhead, logistics and margin the remaining 26%.
So a protein bar follows the whey market first, then packaging, and only then sugar and cocoa. A cereal bar is different: there, oats and syrups carry much more of the bill.
These shares are our estimate, built from a public recipe (below) and typical ingredient price relationships. They are an assumption for teaching, not a measured industry average. Replace them with your own supplier’s breakdown as soon as you have it.
The cost stack of a protein bar
| Cost layer | Share of unit cost (illustrative) | What sits in it |
|---|---|---|
| Dairy protein blend | 32% | WPC80, MPC and some WPI, partly as protein crisps |
| Coating | 10% | Compound or milk chocolate: cocoa, coating fat, sugar |
| Syrups, polyols, fibre | 8% | Glucose syrup, sugar alcohols, oligosaccharides, the binder |
| Fats and nut butters | 4% | Vegetable oil, nut or seed butter for softness |
| Other ingredients | 5% | Humectant, flavour, sweetener, inclusions, vitamins |
| Packaging | 12% | Flow-wrap film, display carton, shipping case |
| Energy | 3% | Power for mixing, extrusion, cooling tunnels and enrobing |
| Labour, overhead, margin | 26% | Line staff, maintenance, depreciation, logistics and the maker’s margin |
| Total | 100% |
Our estimate for a 60 g coated whey protein bar, rounded to the nearest whole percent. Your recipe and contracts will give different shares.
Three things stand out.
Protein carries the bill. The protein blend is a bit over a third of the bar’s weight but costs more than everything else in the recipe combined. A price move in the protein blend passes into unit cost in proportion to that share: a 10% rise in the blend adds about 3.2 points.
Packaging is a big line for a small product. A 60 g bar is wrapped individually, packed into a display carton, then into a case. Per kilo of product, that is far more packaging than a family pack of biscuits. The smaller the bar, the bigger the share.
Energy is small. Most protein bars are not baked. The dough is mixed, extruded or slabbed, cooled until it sets, cut and often enrobed. That uses power for motors and cooling, but nothing like the gas a biscuit oven burns. Our butter biscuit cost breakdown has energy at 8% of cost; here it is 3%.
The recipe: what goes into a protein bar
A protein bar is a low-moisture dough held together by syrups and fat. A concept card from ingredient distributor Univar Solutions and NZMP gives this basic recipe for a 60 g bar with 18 g of protein:
| Ingredient | Share of bar weight | Job in the bar |
|---|---|---|
| Whey protein concentrate | 20% | Main protein source, softness |
| Milk protein concentrate | 12% | Protein and firmer structure |
| Isomalto-oligosaccharides | 20% | Binder, sweetness, fibre |
| Almond butter | 20% | Fat, flavour, cohesion |
| Glycerin | 18% | Keeps the bar soft and water activity low |
| Whey protein crisps | 10% | Crunch and more protein |
| Flavour and sweetener | as required | Taste without added sugar |
Source: Univar Solutions, Protein Bars concept card (2019). A representative formulation, not a commercial product.
The same card lists the usual building blocks of the category: a protein source, a filler such as glucose syrup, fat or a humectant, a sweetener such as sugar alcohols or glucose syrup, a fibre, a chocolate or yoghurt coating, and inclusions. It puts typical protein content at 15 to 20 g per bar.
Commercial bars vary a lot around this. Many replace some of the syrup with polyols (sugar alcohols) to cut sugar, many add a chocolate or compound coating that can be a fifth of the bar’s weight, and many swap nut butter for cheaper vegetable fat. Our cost stack assumes a coated bar with a blend of WPC80 and MPC, glucose syrup and polyols as binders, and a compound coating.
The protein level is a cost decision
The number on the front of the pack decides how much protein goes in. Under the EU’s nutrition and health claims regulation, a food can say “high protein” only if at least 20% of its energy comes from protein. The Univar bar clears that easily: 18 g of protein is about 72 kcal out of 220, or roughly a third of the energy (our calculation).
Most sports bars go well beyond the legal floor, because the protein number is what they compete on. Every extra gram per bar is more of the most expensive ingredient. In our illustrative stack, a bar that moves from 18 g to 20 g of protein needs about 11% more protein blend, which adds about 3.6 points to unit cost before anything else changes (our calculation).
Shelf life and hardening
Protein bars get harder as they age, and that is a cost problem as well as a quality one. Researchers at Massey University stored a model protein bar made with MPC for 50 days and found it hardened steadily. They concluded that physical changes, such as moisture moving within the bar, mattered more than chemical reactions, which played little part in the hardening (Loveday et al., Food Research International, 2009).
Ingredient suppliers say the same. FrieslandCampina Ingredients told FoodNavigator in December 2025 that bars with 30 to 40% protein tend to harden over time, and Lactalis Ingredients called hardening “a well-known technical issue”. The usual fixes, such as hydrolysed whey or specialised protein grades, tend to cost more per kilo than standard WPC80, as the Univar card notes for its hydrolysed whey.
So the recipe is a trade-off between protein level, texture over shelf life and cost. A buyer who asks for a higher protein claim or a longer shelf life is also asking for a more expensive protein blend.
What moved in the last 12 months
Here is how the main protein bar inputs moved over roughly the past year, using the latest available price against the nearest observation a year earlier:
The protein story first. On the Vesper Price Index (EXW), between 29 October 2025 and 21 October 2026:
- European WPC80 prices (instant) rose 45.2%. Over two years, from October 2024, the rise is 63.6%.
- The European MPC 85 market rose 102.5%. It more than doubled.
- The European whey protein isolate market rose 40.0%.
- US WPC80 (instant) rose 57.7%, measured in EUR.
That is not a one-off. Two Dutch sports nutrition brands told their customers in March why whey prices were going up in 2026, and prices are still far above their level of a year ago, although European WPC80 has eased by about 10% since April. European skimmed milk powder prices rose 79.6% over the same 12 months, as our ice cream cost breakdown shows: dairy protein in every form got dearer.
The rest of the basket moved in both directions:
- Sweeteners. The West-EU white sugar benchmark (VPI, DAP) rose 13.2% between 22 Oct 2025 and 21 Oct 2026. European glucose syrup price data (VPI, DAP, monthly) shows a 17.5% fall between 1 Sep 2025 and 1 Sep 2026, the latest monthly print.
- Coating. West-EU cocoa powder 10-12% fat quotations (partner prices, EXW Amsterdam, Rotterdam and Hamburg) fell 9.2% between 27 Oct 2025 and 26 Oct 2026, and the cocoa butter market on the same basis fell 23.6%. The coating fat in a compound coating is usually lauric: Malaysian RBD palm kernel oil (VPI, FOB) was almost flat, down 0.8% between 27 Oct 2025 and 27 Oct 2026.
- Fats. The West-EU crude sunflower oil market (VPI, FOB 6 ports) rose 13.5% between 21 Oct 2025 and 21 Oct 2026. We use it as the proxy for liquid vegetable fat in the dough.
- Packaging. West-EU OPP film price data (15 micron, partner prices, EXW) shows a 17.3% rise between 1 Oct 2025 and 1 Oct 2026. Our partner FBB boxboard series (280 gsm, West-EU) fell 3.3% from October 2025 to October 2026.
- Energy. German THE natural gas futures (front month, EEX) rose 115.3% between 13 Oct 2025 and 13 Oct 2026.
We have no like-for-like European price move for the polyols in this recipe. Maltitol is a common polyol in bars, and our maltitol price data covers China, not Europe. So below we split the syrups line in half. Glucose syrup takes the glucose syrup move, and polyols and fibre are held flat.
What that did to unit cost
To turn price moves into a cost change, weight each one by its share of unit cost and add the results. A 45.2% rise in an input that is 20% of cost adds about 9 points. A 102.5% rise in an input that is 8% of cost adds about 8.
Using the illustrative stack from above:
| Input | Share of unit cost | 12-month move | Effect on unit cost |
|---|---|---|---|
| WPC80 (Europe) | 20% | +45.2% | +9.04 points |
| MPC85 (Europe) | 8% | +102.5% | +8.20 points |
| WPI (Europe) | 4% | +40.0% | +1.60 points |
| Coating: RBD palm kernel oil | 4% | -0.8% | -0.03 points |
| Coating: cocoa powder 10-12% fat | 3% | -9.2% | -0.28 points |
| Coating: white sugar | 3% | +13.2% | +0.40 points |
| Glucose syrup (half of the syrups line) | 4% | -17.5% | -0.70 points |
| Polyols and fibre (other half of the syrups line) | 4% | held flat | 0 points |
| Fats (crude sunflower oil as proxy) | 4% | +13.5% | +0.54 points |
| Other ingredients | 5% | held flat | 0 points |
| Flow-wrap film (OPP) | 8% | +17.3% | +1.38 points |
| Cartons and cases (FBB) | 4% | -3.3% | -0.13 points |
| Energy (THE gas as proxy) | 3% | +115.3% | +3.46 points |
| Labour, overhead, logistics, margin | 26% | held flat | 0 points |
| Total | 100% | +23.5% |
Our calculation from Vesper and EEX price changes to October 2026. Cost shares are illustrative.
The protein blend adds 18.84 points on its own, about four fifths of the total. The coating, syrups and fats net to almost nothing: cheaper glucose syrup and cocoa offset dearer sugar and vegetable oil. Packaging adds about 1.3 points, mostly film. Energy adds 3.5 points, much less than in a baked product, because the share is small.
The last figure is easy to miss. At the start of the period protein was 32% of unit cost in our example. After a year of these moves it is about 41% (our calculation). That is why the formula uses the shares at the base date: a supplier who applies today’s protein share to the full year’s price rise counts part of the increase twice.
To put it in money: for every €1.00 the bar cost to make a year ago, the same recipe now costs about €1.23. Protein accounts for about 19 cents of that increase.
Three honest limits on this example:
- The protein grades drive everything. A bar built mainly on WPC80 and WPI saw a smaller rise than one with a lot of MPC. A plant protein bar follows different markets again.
- Energy is a proxy. A cold-formed bar line runs mostly on power, not gas. If only half of the energy line followed gas and the rest held flat, energy adds about 1.7 points and the total is closer to +22%.
- Forward cover changes the timing. Contract manufacturers often buy protein months ahead. A supplier that bought WPC80 forward in late 2025 felt this rise later, and a buyer should ask when the cost actually landed.
If you want to run this as a model every month, here is how to build a should-cost model from scratch, and how to use the same arithmetic to respond to a supplier price increase.
The levers: what changes your exposure
Price is only one input. These recipe, format and buying choices change how much each market move reaches the cost of a bar.
Lever 1: the protein blend
The blend is the biggest lever because it is the biggest line. WPC80 gives a soft bar and a clean taste, MPC builds structure and has usually cost less per tonne than WPC80, and WPI gives the most protein per gram but tends to harden. The Univar card says as much: WPC is the best single base, but cost is the challenge if it is used alone.
This year turned the usual saving upside down. MPC85 more than doubled while WPC80 rose 45.2%. In our illustrative recipe, the same 32% protein share built only from WPC80 and WPI, with no MPC, would have added about 14.3 points instead of 18.8 (our calculation). A blend that looked cheapest a year ago was the most exposed.
Our Knowledge Hub explains the trade-off between whey protein concentrate and isolate in more detail. The rule for buyers: compare protein options on cost per gram of protein delivered, at the shares in your own recipe, and recheck the comparison every quarter.
Lever 2: dairy or plant protein
Plant protein is the obvious hedge against whey. XXL Nutrition, one of the Dutch brands above, pointed its customers to plant-based alternatives when it explained its whey price increase. But it was not a refuge this year: European pea protein isolate price data (80%, partner prices, FOB) shows a 37.8% rise between August 2025 and August 2026, not far below WPC80.
Plant protein also brings its own costs. It often needs flavour masking, it changes the texture, and a bar may need more of it to reach the same protein claim. A switch is a product decision with a cost case, not a cost decision on its own.
Lever 3: where the protein comes from
US WPC80 rose 57.7% over the same period, measured in EUR, against 45.2% for the European series. Some of that gap is currency and some is the US market itself, where demand for high-protein drinks has been reported as strong, including from GLP-1 users. For a European bar maker, the origin of the whey changed the cost increase by about 2.5 points of unit cost in our example (our calculation, WPC80 share 20%).
Lever 4: the coating
The coating is about 10% of cost in our example. Real milk chocolate uses cocoa butter; a compound coating uses a lauric fat such as RBD palm kernel oil with cocoa.
If your bars moved from chocolate to compound during the 2024 cocoa spike, the case for that switch has weakened. Cocoa butter fell 23.6% in the last 12 months and about 70% since October 2024 (partner prices, West-EU), while the lauric coating fat was flat this year. A coating decision priced in 2024 is worth repricing, and a “chocolate” claim on the pack may cost less to make than it did.
Lever 5: sweeteners and the sugar claim
Glucose syrup fell 17.5% and white sugar rose 13.2% over the periods above. Low-sugar bars use polyols such as maltitol instead, which change the cost and the label. Under the EU’s food information regulation, a food with more than 10% added polyols must carry the warning “excessive consumption may produce laxative effects”. That caps how far polyols can replace syrup before the pack changes.
Lever 6: pack format and film
Packaging is 12% of cost, and two thirds of it in our example is the flow wrap. OPP film rose 17.3% this year, so film use per bar matters: wrapper size, film gauge, and whether a metallised barrier layer is needed for the shelf life you promise. Multipacks spread carton cost over more bars; single bars in display cartons carry the most.
Lever 7: yield and giveaway
Bar lines lose material at the cutter, at start-up and changeover, and in rejects from the enrober. If you bring losses from 5% to 3% of dough, you need about 2% less material per sellable bar. On a 59% ingredient share, that is about 1.2 points off unit cost (our calculation, illustrative loss rates). Overfilling every 60 g bar by 2% costs about the same.
Neither shows up in a commodity price. Both show up in the cost of every bar.
What this means for your next supplier conversation
For a private-label buyer or a brand using a contract manufacturer, the useful question is not “did whey go up?”. It is “which proteins, at what share of this bar’s cost, from which base date?”.
Before you accept or push back on a protein bar price change, get:
- The supplier’s cost shares for each protein, the coating, binders, fats, packaging and energy, in %, at the base date of your last agreement.
- The protein grades in the recipe: WPC80, MPC, WPI, crisps, plant protein.
- How much protein the supplier had bought forward, and at what point the higher cost actually landed.
- The base month for each price move they quote.
Then run the share × move sum yourself. A WPC80-heavy bar and an MPC-heavy bar from the same plant could justify very different increases this year.
For retail buyers with a protein range, that also means a single “protein surcharge” across every bar is worth questioning. Our Knowledge Hub walks through calculating product cost from whey protein concentrate prices line by line, if you want the method for a single protein input.
Putting it to work
A protein bar’s cost is a weighted sum, and one weight dominates. Once you know your protein share and your blend, every whey or MPC move turns into points of unit cost you can check.
Pick your two highest-volume bars and fill in the share table above with your own recipe and contract prices. Then decide which lever is worth pulling: the blend, the protein claim, the coating or the pack.
To keep the calculation live, Vesper Cost Models start from industry templates (protein bars included), link each ingredient in your recipe to a Vesper price series, add labour, overhead and margin for your country and industry, and update automatically when prices move. You see what your bar should cost today and which input moved it.
Frequently asked questions
How much does it cost to make a protein bar?
It depends on the protein level, the coating, the pack and the plant, so the useful answer is the cost structure. In our illustrative coated whey bar, ingredients are 59% of unit cost, with the dairy protein blend alone at 32%. Packaging is 12%, energy 3%, and labour, overhead, logistics and margin 26%. Replace these shares with your own supplier's breakdown when you have it.
What is the most expensive ingredient in a protein bar?
The protein. In a dairy-based bar that means whey protein concentrate (usually WPC80), milk protein concentrate and sometimes whey protein isolate. In our illustrative recipe they make up about a third of unit cost, more than the coating, the syrups and the fats put together.
Why did protein bar production costs rise so much in 2026?
Because dairy protein prices rose sharply. Between 29 October 2025 and 21 October 2026, European WPC80 rose 45.2% and European MPC85 rose 102.5% on the Vesper Price Index. In our illustrative recipe, the protein blend alone added about 18.8 points to unit cost, while sugar, syrups, fats and cocoa nearly cancelled each other out. Packaging added about 1.3 points and gas about 3.5, for a total of about +23.5%.
Is pea protein cheaper to use than whey in protein bars?
It was not a refuge this year. European pea protein isolate 80% rose 37.8% between August 2025 and August 2026, not far below WPC80's 45.2%. Plant protein also changes taste, texture and the amino acid profile, and a bar may need more of it to hit the same protein claim. Compare options on cost per gram of protein, not cost per tonne.
How can a buyer check a protein bar supplier's price increase?
Ask for the supplier's cost shares by input, from the base date of the last price agreement. Multiply each share by that input's price change from an independent index over the same period and add the results. Compare that figure with the increase asked, and check which protein grades and how much forward cover the supplier had.