

What is the Vesper Price Index (VPI)
Understanding Vesper’s Commodity Price Index
The Commodity Price Index is a critical metric in the world of commodities, reflecting market prices for commodities. It provides invaluable insights for businesses, procurement teams, finance and risk managers and stakeholders dealing with commodities. On the Vesper platform, the Commodity Price Index is represented through the Vesper Price Index (VPI), a proprietary benchmark, created by Vesper.
The Vesper Price Index is a proprietary and independent pricing benchmark created and published by Vesper. We aim to bring transparency to the market by gathering price inputs from a range of trusted industry players, including buyers, sellers, traders and brokers, and publishing prices that are representative of the market. The Vesper Price Index offers unique insights, including presenting previously unseen market prices and enhancing existing benchmarks. The Vesper Price Index is a powerful tool that strengthens negotiation power, providing trusted and reliable market prices. This combination of transparency, accuracy, and unique market insights makes the Vesper Price Index invaluable to market participants, increasing their negotiation power.
Benefits of Using the Vesper Price Index (VPI)
Comprehensive Insights Gain a thorough and accurate reflection of market trends with the Vesper Price Index. Covering commodities across Dairy, Oils & Fats, and Sugar, VPI benchmarks prices from regions and countries worldwide.
Informed Decision-Making Reliable, up-to-date commodity price benchmarks help you make informed decisions. Accurate price indices allow you to benchmark your own pricing and understand the current market landscape thoroughly.
Increased Negotiation Power With precise, up-to-date price benchmarks, you can negotiate better terms with suppliers and buyers. Independent data strengthens your position, enabling more favourable deals and contracts.
Market Transparency The Vesper Price Index enhances market transparency by providing a clear view of market movements. This clarity builds trust with stakeholders and partners, ensuring all parties have access to accurate information.
Start using a commodity price index: step-by-step
1. Find and select your commodity
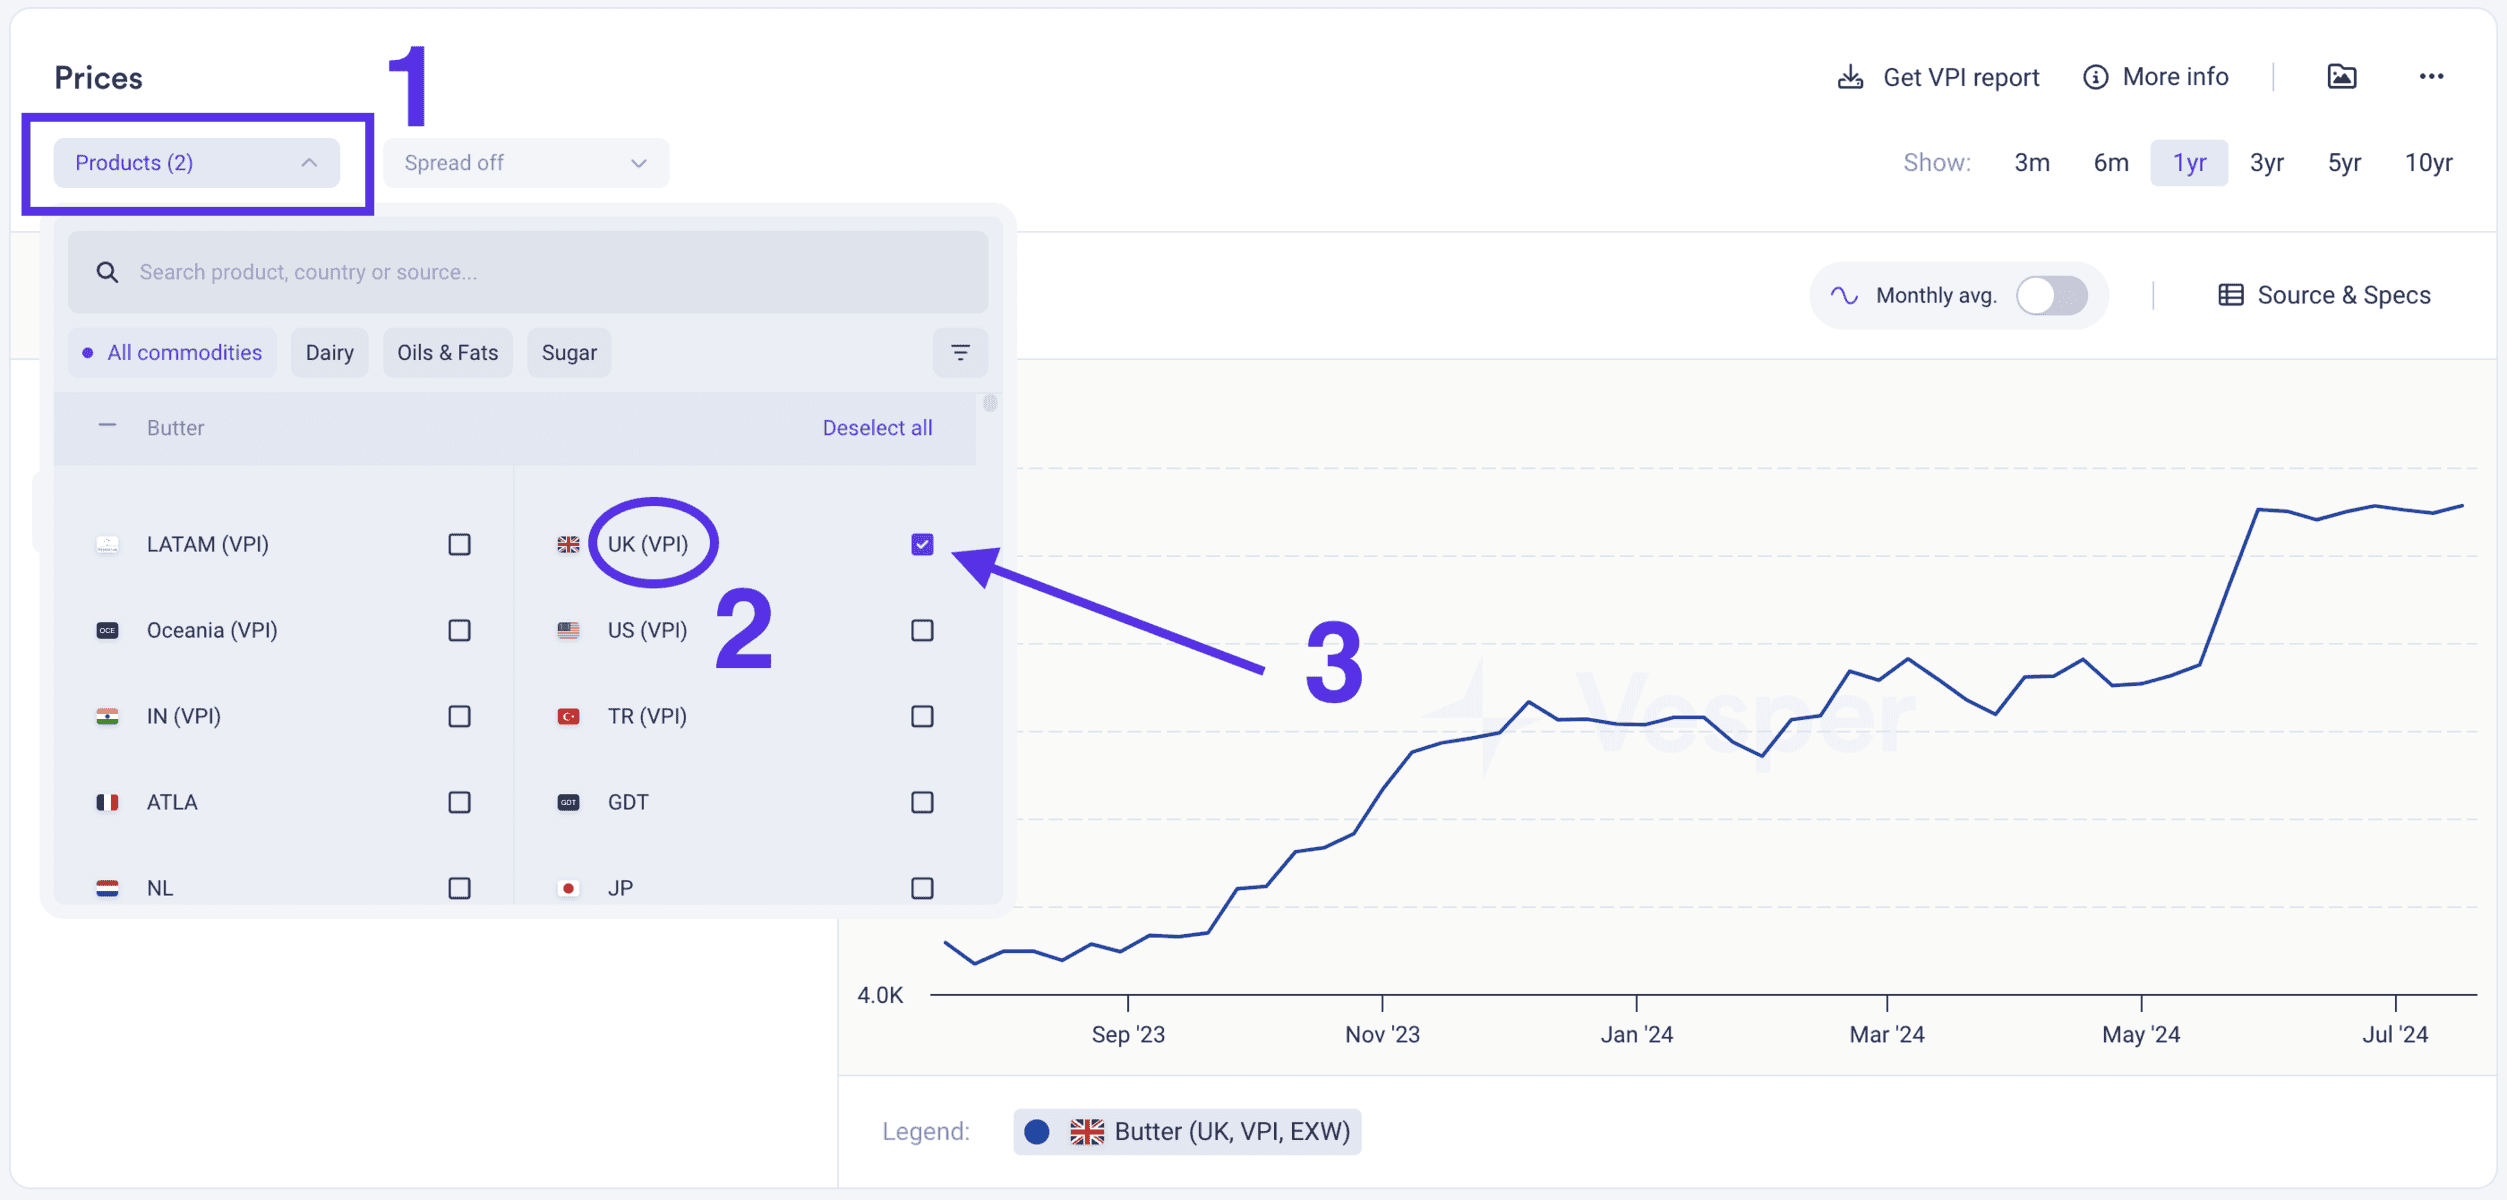
Go to one of the pricing widgets (Prices, Price Comparison, or Forward Prices). In our example, we will use Prices.
- Click on the Products dropdown.
- To ensure you are using our proprietary pricing index, check for commodities with (VPI).
- Select for example the butter UK VPI as seen in the screenshot below:
2. Hover over any price point
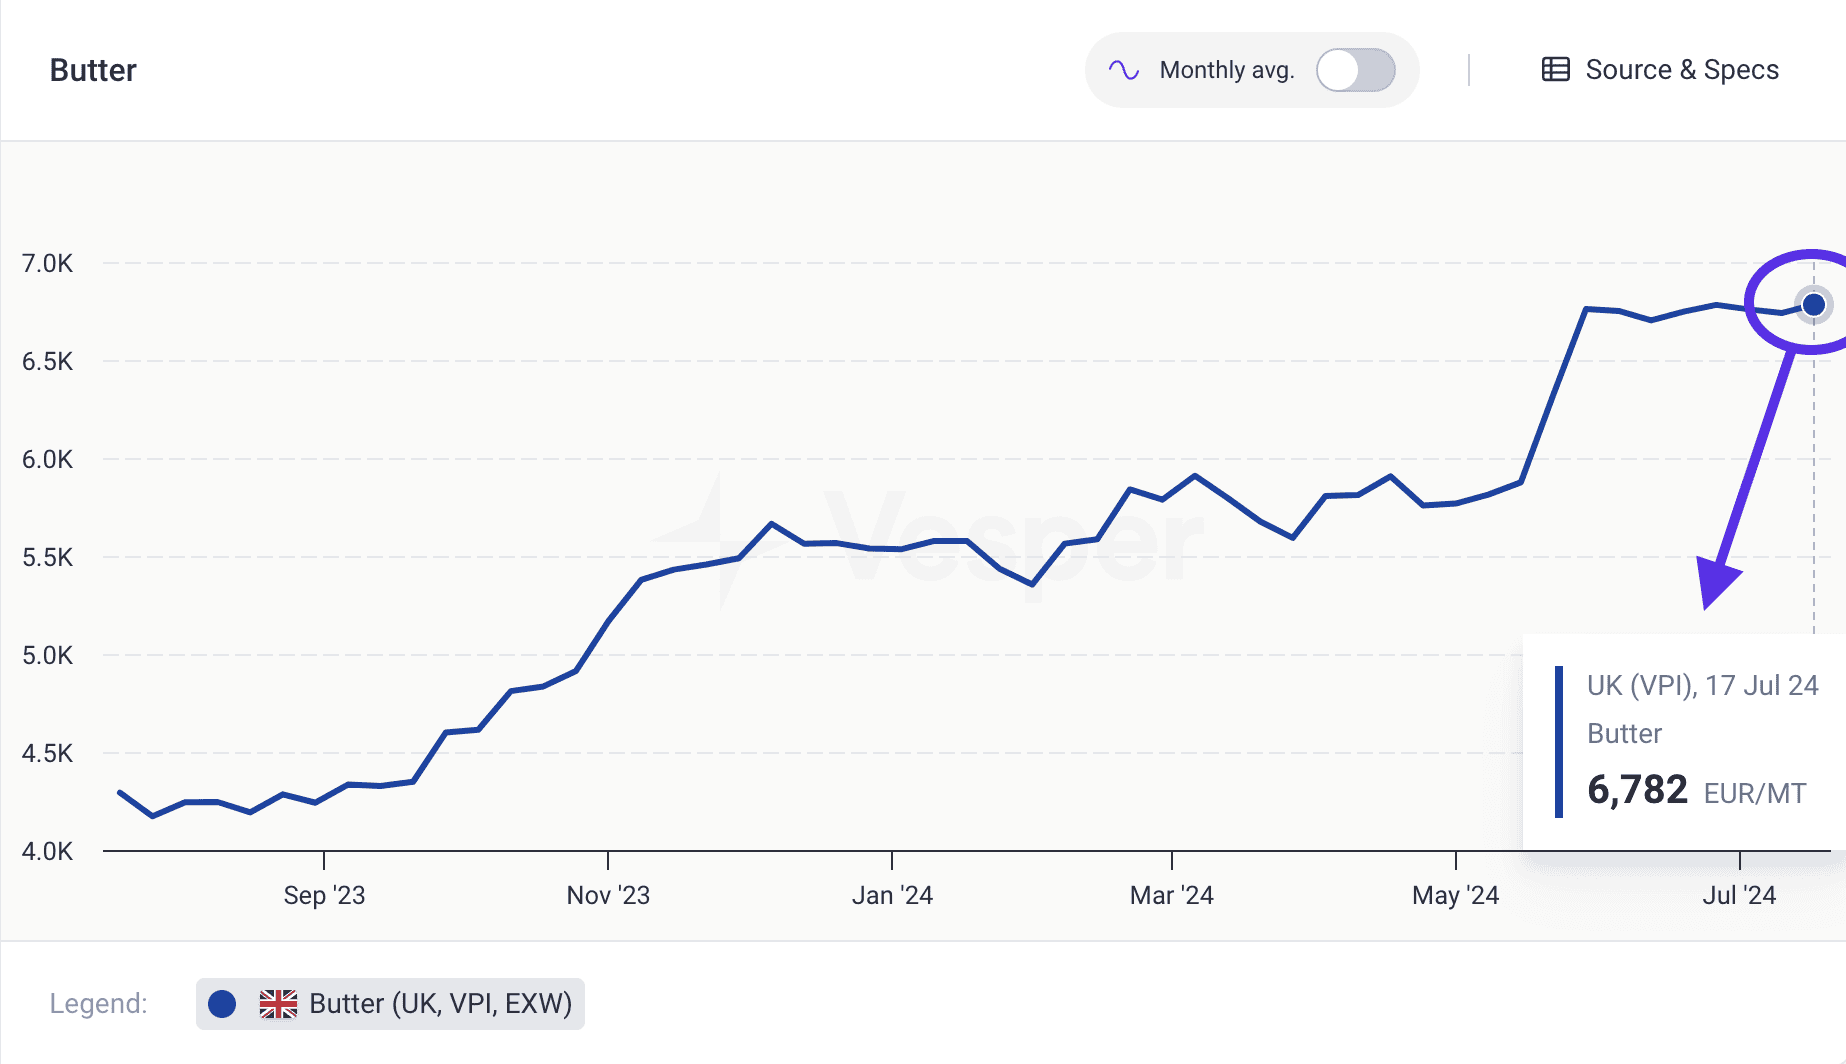
Hover with your mouse over any price point.
A small info card will open. You can then easily scan what the exact price is.
In the screenshot below, you can see that we are highlighting the UK VPI for 17 July, 2024.
3. Download VPI reports
One great feature is that you can also download VPI reports.
- Follow step 1 on the screenshot: Get VPI Report.
- Choose the commodity of choice (step 2).
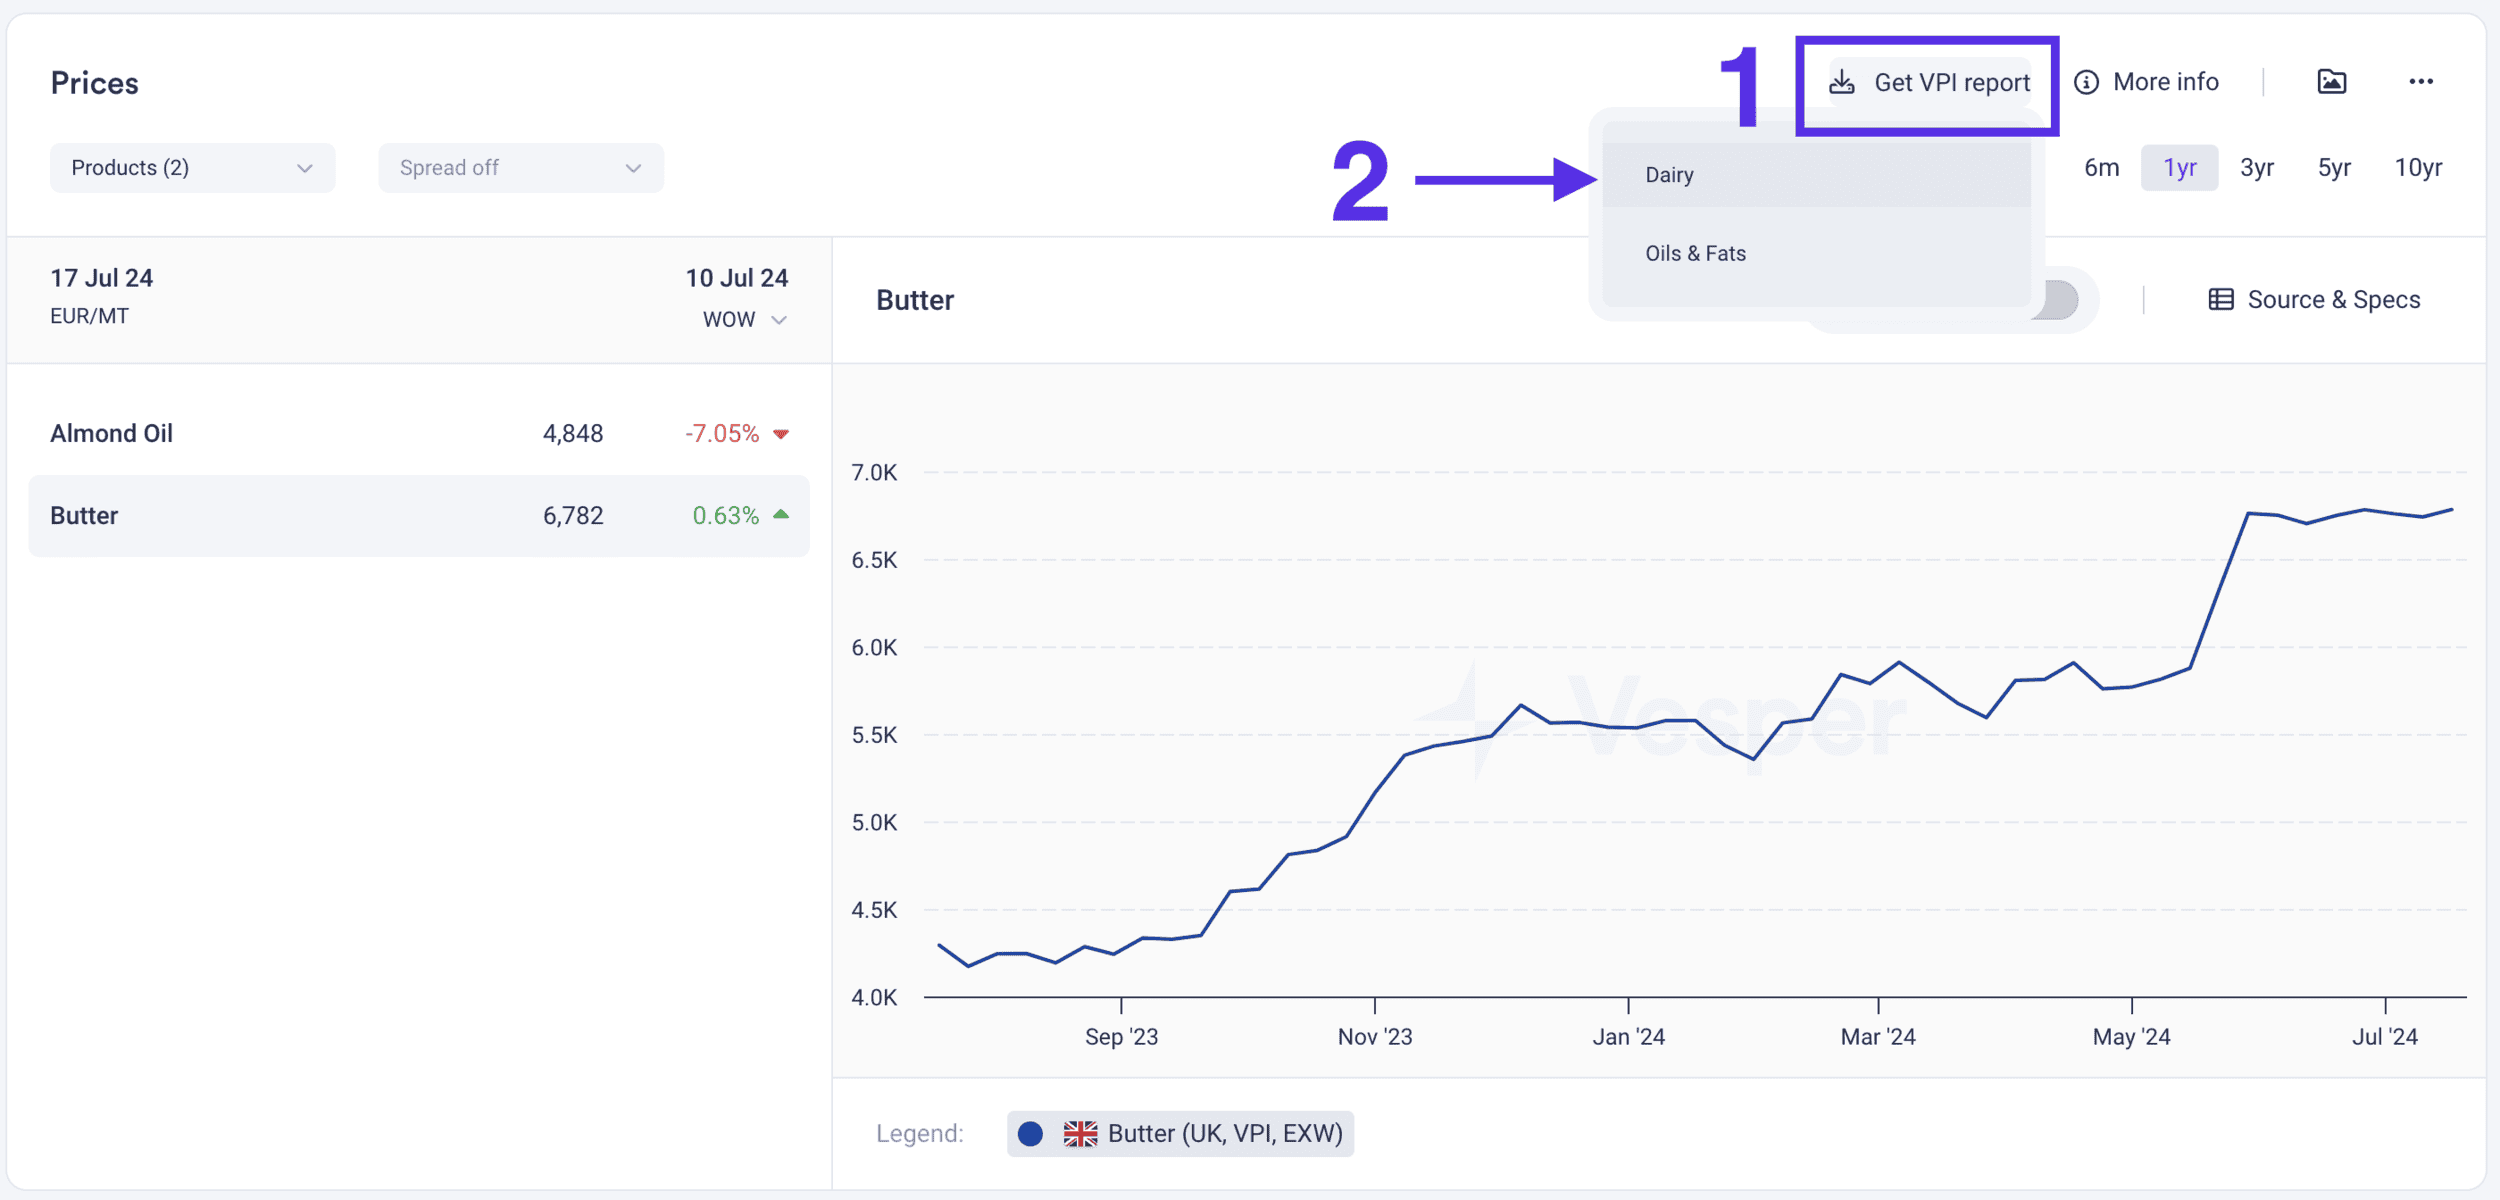
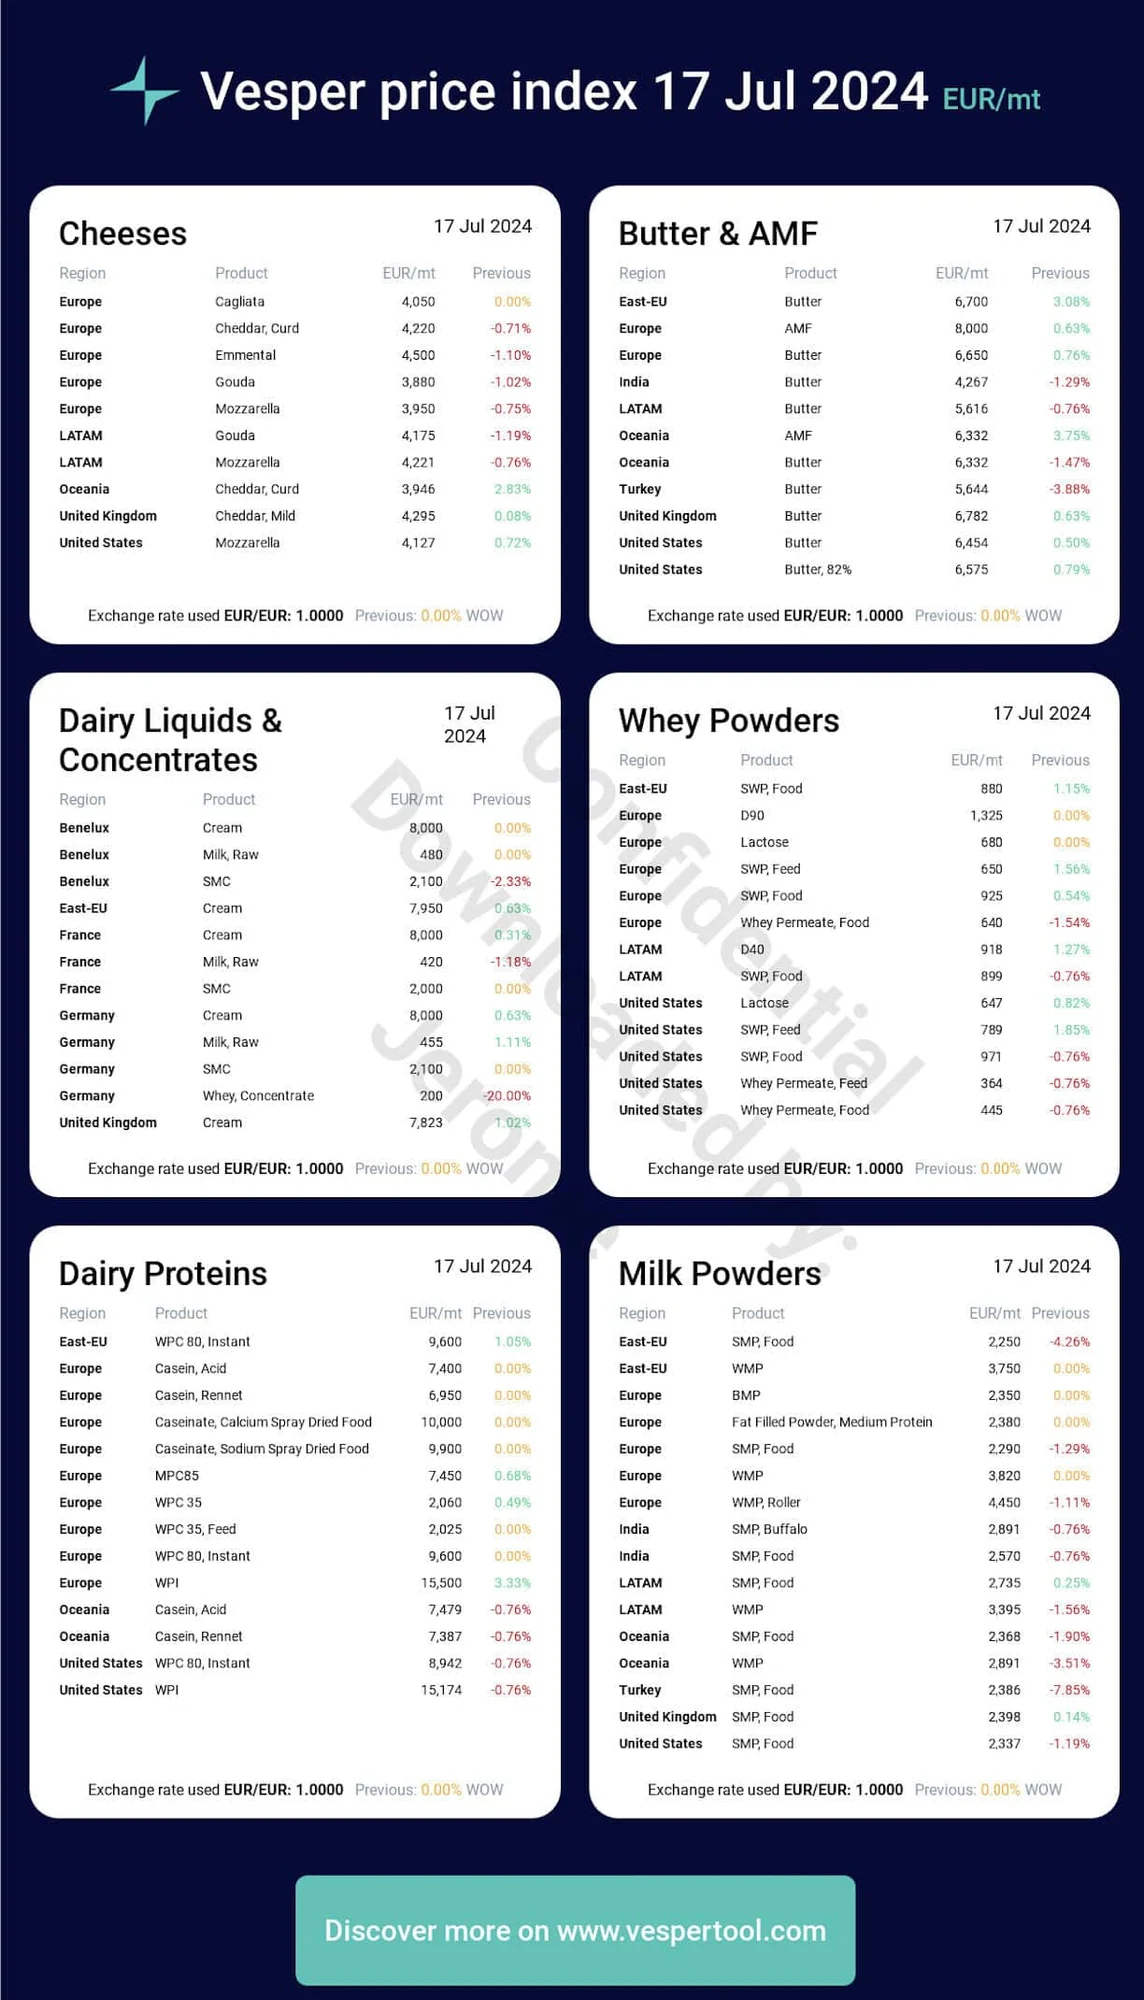
You now will download a PNG image with all the price indices for many of the products available on our platform.
When you open it, it will look something like this:
Use Cases for using independent commodity price benchmarks
Procurement Teams
A procurement manager at an FMCG company can utilise the Vesper Price Index (VPI) to benchmark raw material prices against the market. By analysing VPI data, they can identify if their suppliers are offering fair prices, ensuring cost-effective procurement strategies and better negotiation with suppliers.
Market Analysts
A market analyst can use the Vesper Price Index to study global commodity price trends and their implications. This data-driven approach helps in providing strategic advice on market entry, pricing strategies, and product development based on accurate and up-to-date market benchmarks.
Sales Managers
A sales manager can leverage the Vesper Price Index to identify trends in commodity prices. By understanding market benchmarks, they can set competitive pricing strategies, tailor sales approaches to market conditions, ensuring they are staying competitive in the market.
Risk Manager
A risk manager can utilise the Vesper Price Index to identify potential price volatility and supply chain risks. By monitoring price fluctuations and stability in different markets, they can develop strategies to mitigate risks and ensure the stability of the supply chain.
Frequently asked questions
What is the Vesper Price Index and how does it differ from a generic commodity price index?
A commodity price index reflects market prices across commodities. On Vesper this takes the form of the Vesper Price Index (VPI), a proprietary, independent benchmark created and published by Vesper. It is built from price inputs gathered from trusted buyers, sellers, traders and brokers, so it can surface previously unseen prices and strengthen existing benchmarks. Learn more about the Vesper Price Index.
Which commodity markets does the VPI currently cover?
The article states the Vesper Price Index covers commodities across Dairy, Oils & Fats, and Sugar, benchmarking prices from regions and countries worldwide. Within a market you select specific products carrying a (VPI) label, such as a butter UK VPI, so you are benchmarking against Vesper's proprietary index rather than a third-party figure for that exact product and region.
How does using a VPI benchmark improve supplier negotiations?
An independent, up-to-date price benchmark gives you a reference point to judge whether a supplier quote is fair against the wider market. A procurement manager can compare raw material prices to the VPI, confirm suppliers are offering competitive terms, and negotiate from a data-backed position. The article notes this independent data strengthens your position and enables more favourable deals and contracts.
Can I export the index data, and how do I find a specific price point?
Yes. The article describes downloading VPI reports through the Get VPI Report option, which produces an image containing the price indices for many products on the platform. To read an individual value, open a pricing widget such as Prices, hover over any point on the chart, and an info card shows the exact price for that product and date. The same workflow applies to covered markets such as dairy price data.