

Imagine this: You’re a dairy producer in the Midwest U.S., contemplating when to sell your milk volumes for the best price, or a dairy buyer in Europe, deciphering the fluctuating market prices. Perhaps, you’re an analyst in New Zealand forecasting market trends, or a finance professional in Asia, managing risks in the dairy sector. Regardless of your role, one common thread binds you all - understanding the global dairy trade’s dynamics is paramount to informed decision-making.
In this intricate landscape, Vesper’s suite of tools - including the Vesper Price Index (VPI) and a range of trade visualization widgets - can be your compass. With these tools, tracking, interpreting, and leveraging global dairy trade streams become less daunting and more strategic.
In today’s interconnected dairy industry, comprehending global trade streams is not just beneficial, but a necessity. Even if your operations primarily lie within a domestic market, the ripple effects of global dairy market shifts have profound impacts on your local supply-demand balance. For example, stronger Chinese demand for imports from the U.S. or Europe may create a surge in demand in those regions, disrupting your domestic market’s balance.
Vesper Price Index
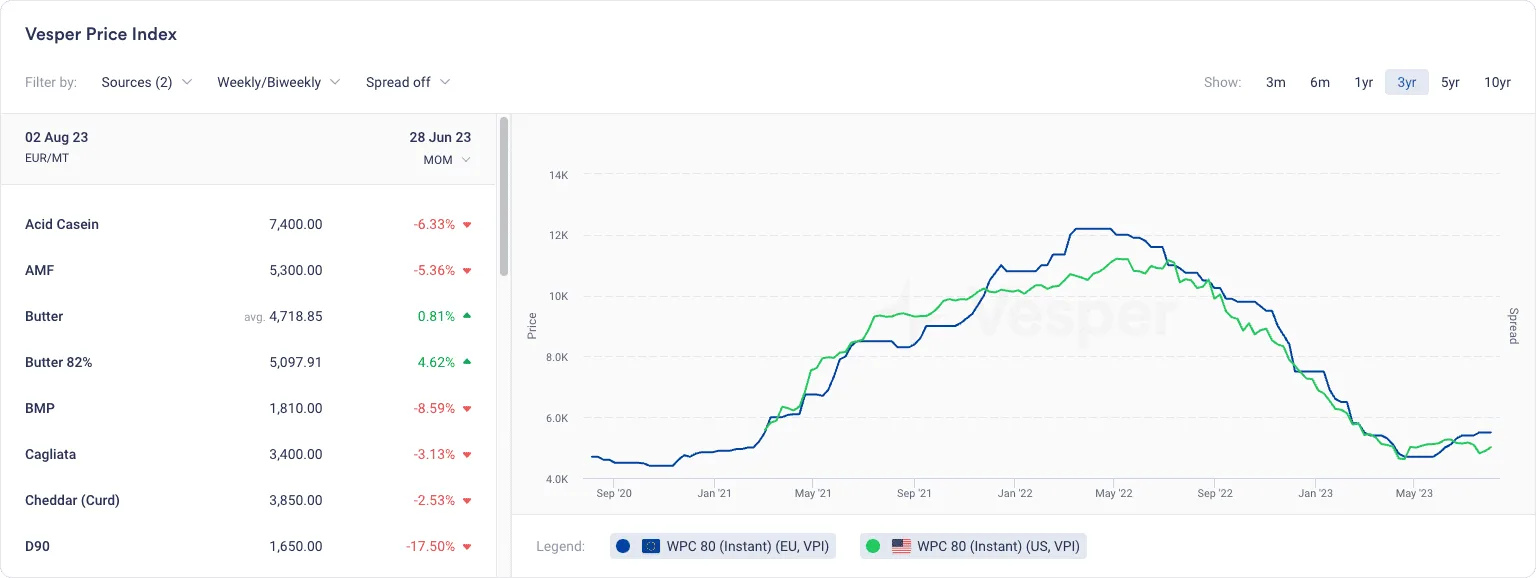
A key aspect of this understanding is price competitiveness among major dairy exporting regions: Europe, the U.S., and Oceania. Here, Vesper’s VPI - an accurate and up-to-date proprietary price benchmark - comes into play. The VPI tracks weekly global prices for dairy products across these regions, offering insights into each region’s competitiveness. Knowledge of competitive pricing allows you to anticipate shifts in global demand, empowering strategic business decisions.
Total Import/Export Graph
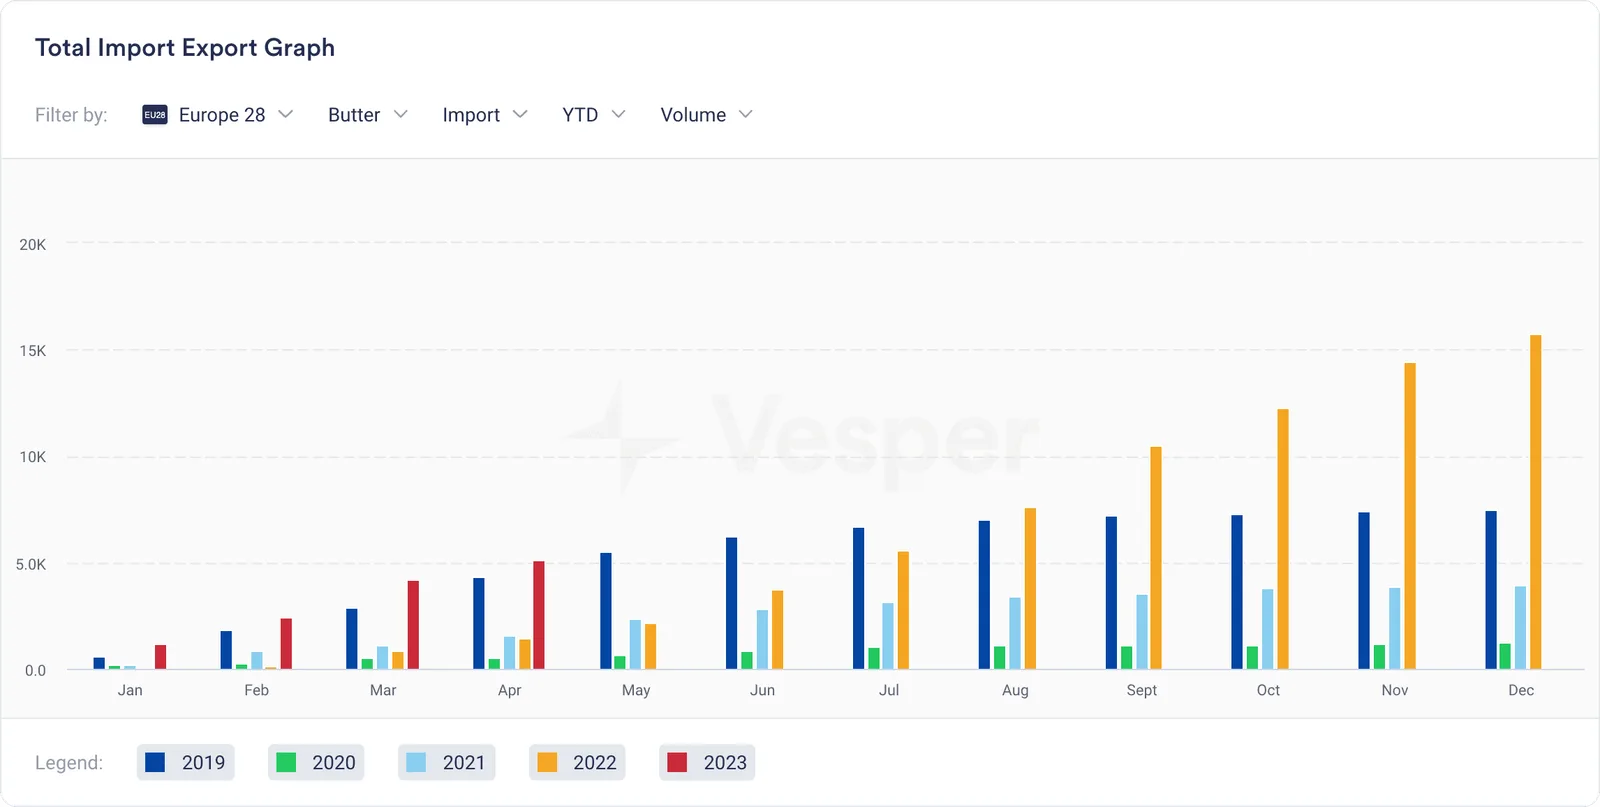
Supplementing the VPI are Vesper’s import-export visualization widgets that transform complex trade data into intelligible, actionable insights. The Total Import/Export Graph gives a panoramic view of a country or region’s import-export activities over time, enabling trend spotting and market dynamics understanding.
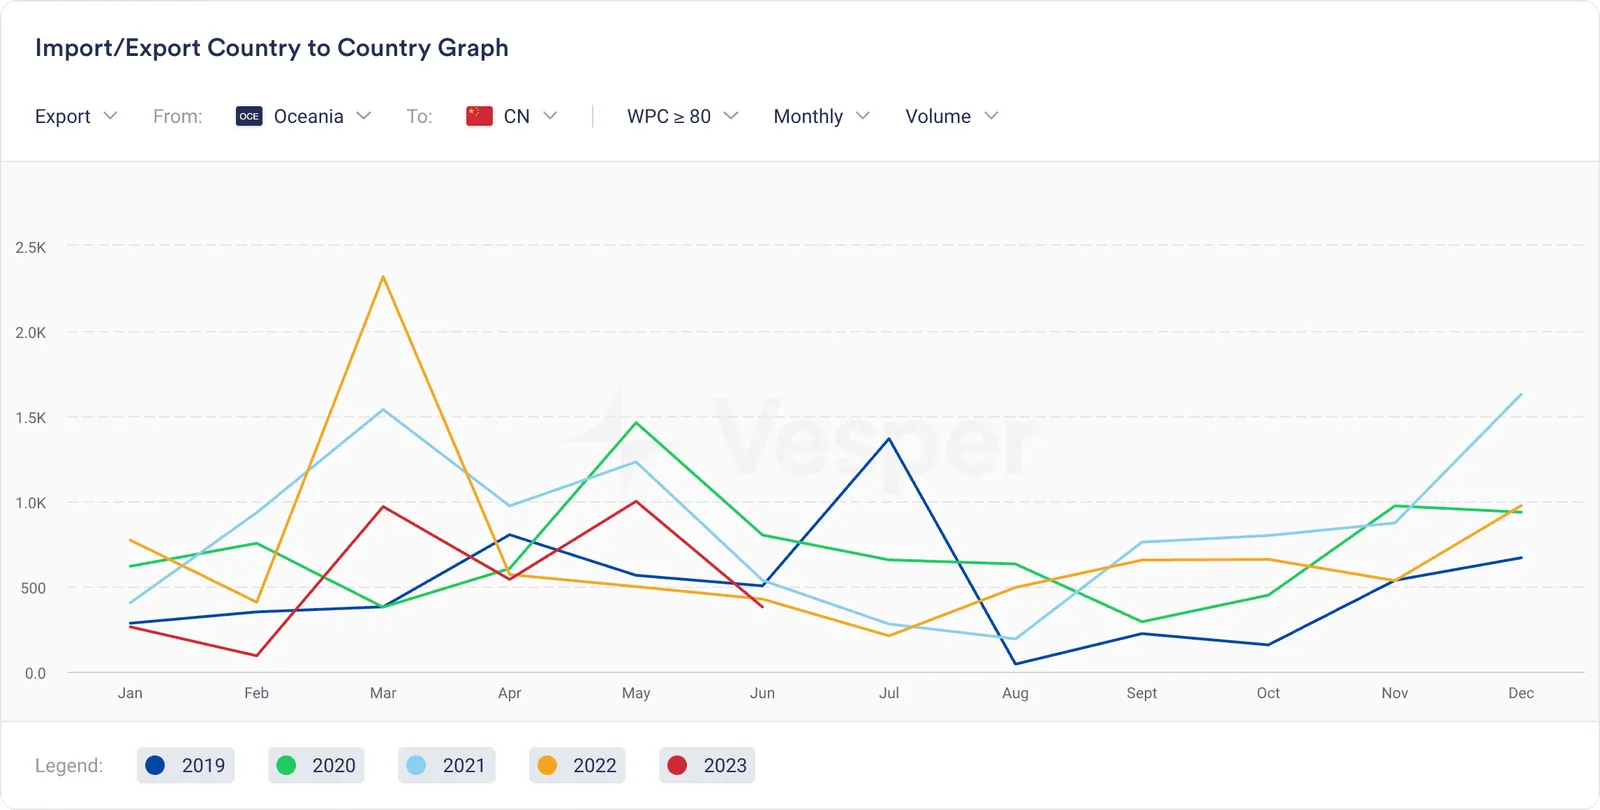
Country-to-Country Graph
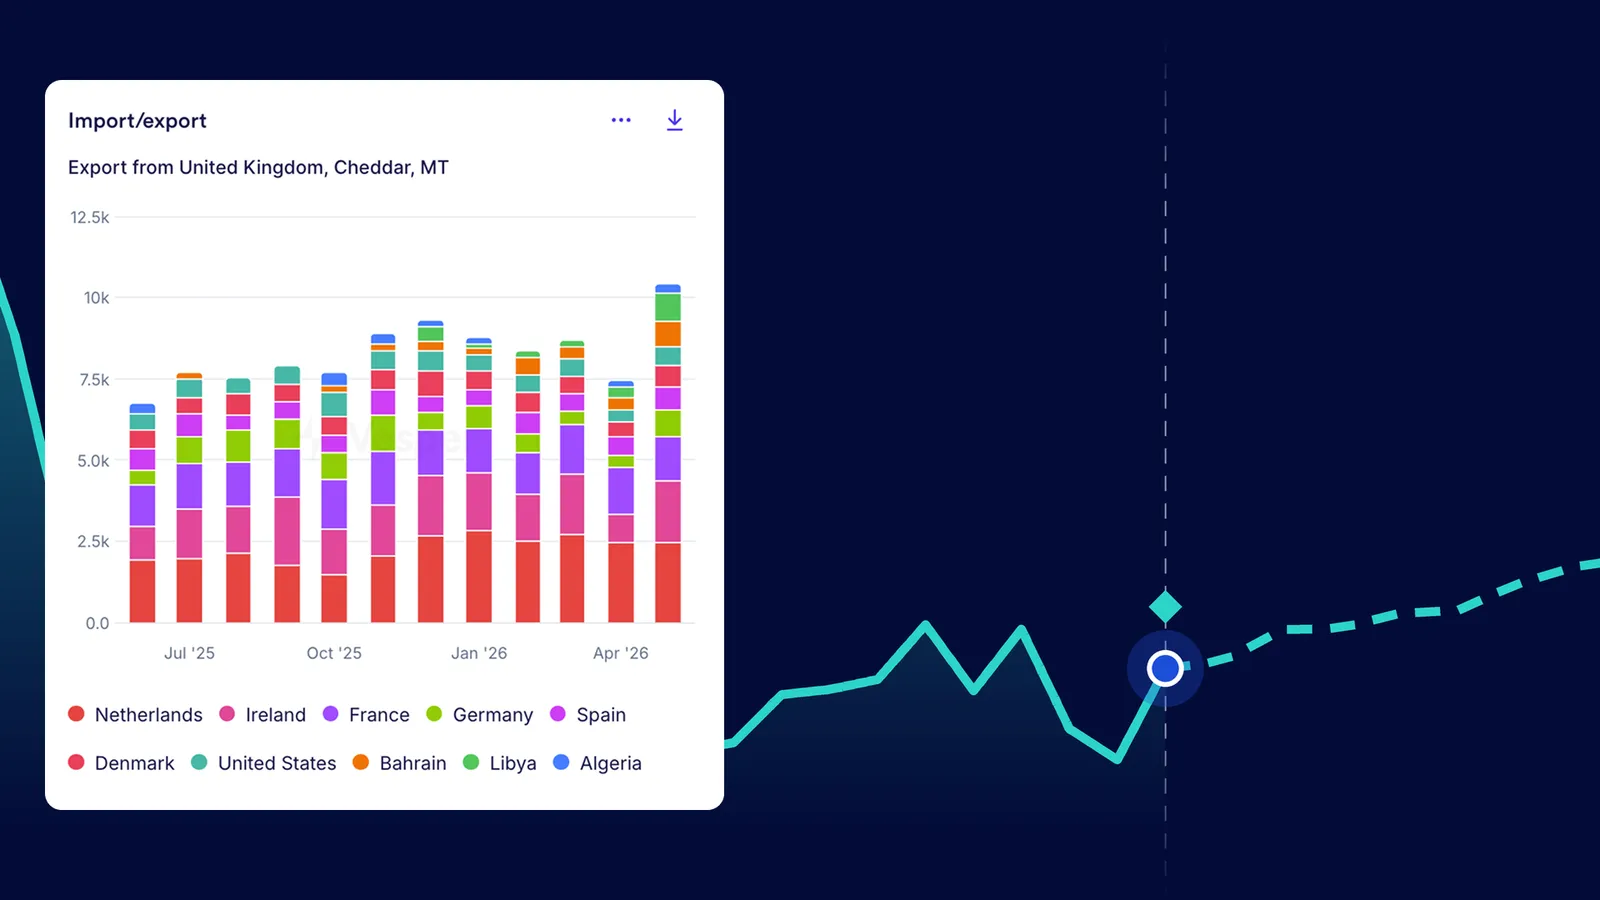
The Country-to-Country Graph lets users deep-dive into specific trade routes, offering detailed import and export data for a particular dairy product. This micro-view of evolving trade relationships is invaluable in crafting dynamic business strategies.
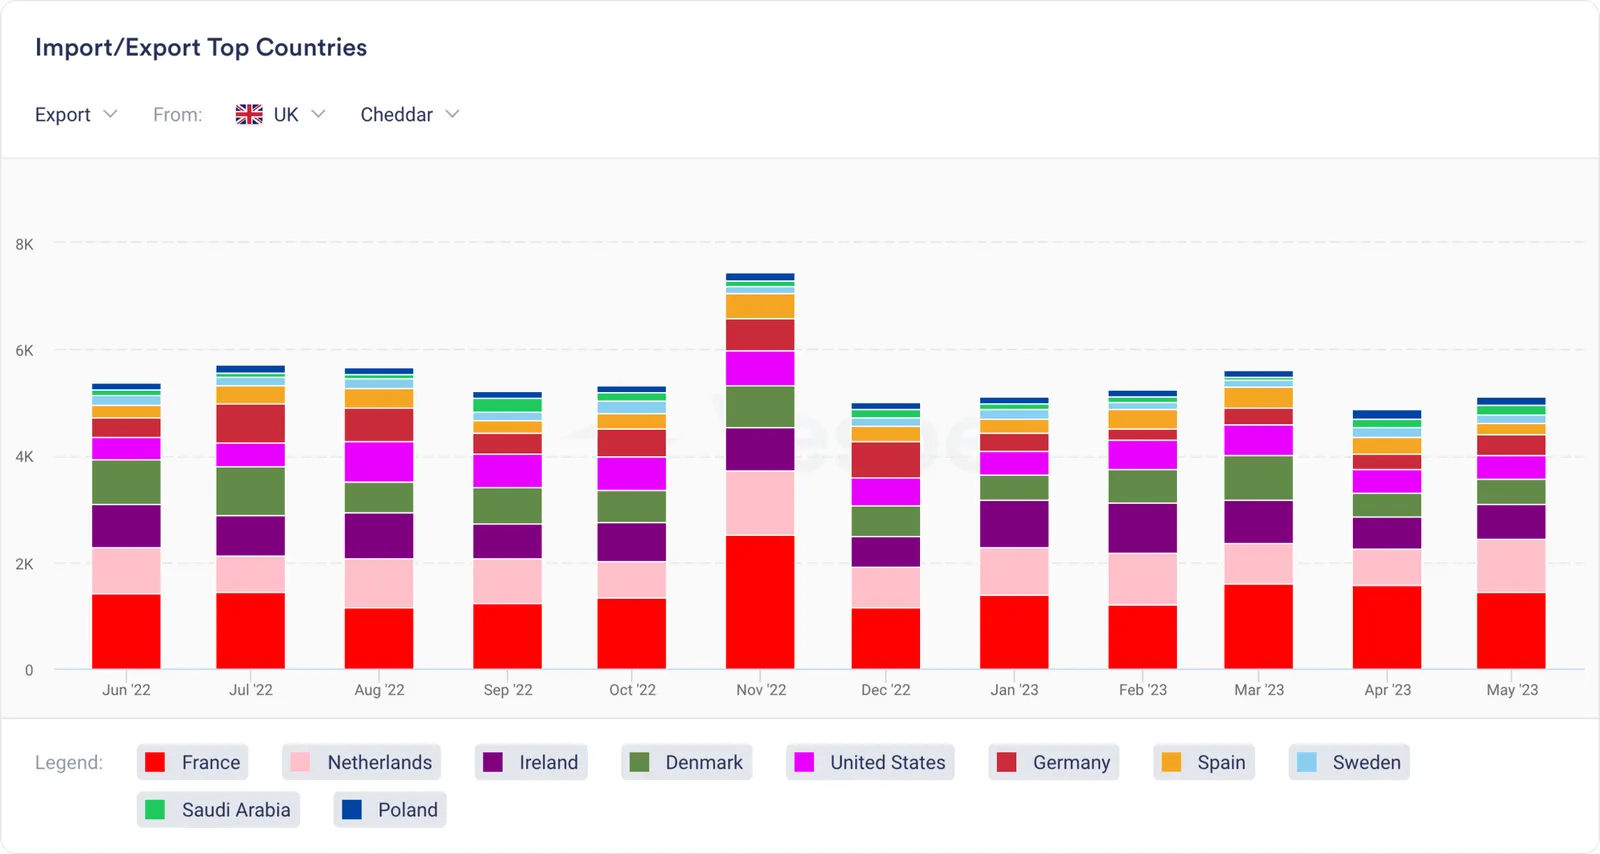
Top Country Graph
Furthermore, the Top Country Graph reveals the top contributors to a specific dairy product’s import or export. Knowing the major players’ moves allows businesses to anticipate changes, seize opportunities, and navigate challenges in the ever-evolving dairy industry landscape.
To wrap it up
In the complex world of the global dairy industry, understanding and harnessing the power of global trade streams’ information is pivotal. Vesper’s tools offer a bird’s-eye view of the global dairy market, enabling proactive strategy formulation, informed decision-making, and effective risk management. With Vesper, global dairy industry navigation becomes not just manageable but strategic, ensuring you stay ahead in the industry’s ever-changing landscape.
Want to learn more about the dairy data we cover? Learn more here.
Want to try out the platform functionalities for yourself? Start your free trial here.