Bake a loaf at home and most of what you pay for is flour and the electricity to heat your oven. Buy the same loaf from a plant bakery and the flour is still the biggest ingredient, but energy is a small line and most of the cost sits in people, trucks and the bag.
This post answers both versions of the question. First the short answer for a home loaf, then the cost stack of an industrial 800 g sliced white loaf, layer by layer: what each input is, how big a share of unit cost it carries, what happened to it over the past year, and which levers change it. It is one worked example of should-cost analysis: estimating what a product ought to cost from its inputs, rather than taking the quoted price as given.
The second half is written for procurement and finance teams at industrial bakeries, and for retail buyers sourcing private-label bread.
How much does it cost to make a loaf of bread?
At home, a basic white loaf costs a little over one euro or dollar to make, depending on what you pay for flour and electricity. Flour is the largest ingredient cost, and oven energy is close behind it. In a plant bakery, energy per loaf is tiny and flour is bought by the tonne, but labour, packaging and daily delivery are added on top. There, flour is about 30% of unit cost.
Here is the home loaf with round, made-up prices. Swap in your own; the structure holds in any currency.
| Home loaf (about 800 g) | Amount | Assumed price | Cost |
|---|---|---|---|
| Strong white bread flour | 500 g | €1.00 per kg bag | €0.50 |
| Dried yeast | 7 g | €0.20 a sachet | €0.20 |
| Salt, oil, a little sugar | about 20 g | from the cupboard | €0.05 |
| Water | about 320 ml | tap water | under €0.01 |
| Oven energy | about 1.5 kWh | €0.30 per kWh | €0.45 |
| Total | about €1.20 |
Illustrative round numbers, not measured prices. Oven energy assumes an electric oven preheated and run for about 50 minutes.
Two things stand out. Flour is about 40% of the home loaf. And the oven is more than a third, because it heats a whole cavity for one loaf. Bake two loaves at once and the energy per loaf roughly halves; a bread machine uses less again.
The flour line has surprisingly little to do with the wheat itself. At the Euronext milling wheat front-month settlement of €233.50 per tonne on 13 November 2026, the roughly 0.7 kg of wheat behind an 800 g white loaf is worth about 16 euro cents (our calculation, at a typical 76% flour extraction rate). Most of what a home baker pays for flour is milling, packing into 1 kg bags and retail.
The cost stack of an industrial loaf
A plant bakery turns the home picture around. It buys flour by the tonne and bakes thousands of loaves an hour in a tunnel oven, so flour and energy per loaf fall sharply. But it adds costs a home baker never sees: night shifts, a slicing and bagging line, and a delivery fleet that restocks stores every morning.
| Cost layer | Share of unit cost (illustrative) | What sits in it |
|---|---|---|
| Wheat flour | 30% | Bread flour, typically 11.5% to 13% protein |
| Yeast | 2% | Fresh compressed or liquid cream yeast |
| Fat | 2% | Rapeseed oil or a palm-based bakery fat |
| Improvers, enzymes, soya flour | 3% | Ascorbic acid, enzymes, emulsifiers, sometimes added gluten |
| Salt and sugar | 1% | Small amounts, small cost |
| Packaging | 6% | The printed bag, the closure and labels |
| Energy | 4% | Gas for the oven, electricity for mixers, provers, coolers and slicers |
| Labour | 20% | Production, hygiene, maintenance and night shifts |
| Distribution | 13% | Daily delivery to stores, often with returns of unsold bread |
| Overhead and margin | 19% | Depreciation, site costs and the baker’s margin |
| Total | 100% |
Cost shares are our illustrative estimate for an 800 g sliced white loaf from a plant bakery delivering daily to stores.
Three things stand out.
Flour is the only big ingredient. Everything else in the recipe adds up to 8% of unit cost. A bread cost model is mostly a flour model, plus energy and packaging.
More than half the cost is not bought on a market. Labour, distribution, overhead and margin are 52%. That is a different shape from a butter biscuit, where 80% of the cost is bought in. Bread is cheap to make and expensive to deliver fresh.
Energy is small but volatile. At 4% it is one of the smaller lines. As the next sections show, it moved more than anything else this year.
For comparison, the bread template in Vesper’s own cost model tool, built from European industry cost structures, puts raw materials at 53.2% of cost, labour at 22.4%, overhead at 12.7%, energy at 1.9% and margin at 9.8%. Its raw materials include packaging, and it does not show distribution as a separate line. The difference shows why the shares you use matter more than any single price: a plant that delivers to its own customers carries a cost the template leaves in overhead.
The recipe and where the weight goes
Bakers write recipes as baker’s percentages, with flour always at 100 and everything else as a share of the flour weight. A typical recipe for a sliced white pan loaf sits in these ranges:
| Ingredient | Baker’s % (flour = 100) | Job in the loaf |
|---|---|---|
| Wheat flour | 100 | Structure: the gluten traps gas |
| Water | 58 to 64 | Hydration; most of the bake loss |
| Yeast (fresh) | 1.5 to 3 | Gas and flavour |
| Salt | 1.6 to 2 | Flavour and dough strength |
| Fat | 0.7 to 2 | Softness, volume and shelf life |
| Sugar | 0 to 2 | Crust colour and yeast food |
| Improver | about 1 | Faster, more consistent dough |
Typical ranges for industrial sliced white bread; individual recipes vary.
In the UK and many other markets, most sliced bread is made with the Chorleywood Bread Process, developed in 1961 at the British Baking Industries Research Association. It replaces long fermentation with a few minutes of intense mechanical mixing, which is why improvers and a high-speed mixer stand in for hours of proving time.
That puts the dough at about 60% flour by weight. An 800 g loaf starts as roughly 890 g of dough, because 8% to 12% of the weight leaves as steam in the oven and during cooling. So each loaf needs about 530 g of flour (our calculation).
Two consequences follow:
- Water is a third of the dough and almost free. That is why flour carries about four fifths of the ingredient bill on its own.
- Bake loss is weight you paid for. A loaf that loses 11% instead of 9% needs about 2% more dough to hit its declared weight.
What moved in the last 12 months
Here is how each input changed over roughly the past year, using the latest available price against the earliest comparable point.
The details behind each bar:
- Flour. French wheat flour prices (12% protein, EXW France, Vesper calculation) rose 20.2% between 17 November 2025 and 16 November 2026. The 12-month high was 30.7% above the low, with the low in May and the high in October.
- Wheat. UK milling wheat prices (partner price, EXW Hull) rose 31.8% over the same dates. Wheat is the bulk of a miller’s cost, but milling, energy and by-product credits sit between wheat and flour, so the flour bought by a UK baker would not move one for one with it.
- Fat. German refined rapeseed oil quotations (VPI, FOB Hamburg) rose 24.6%. For bakers using palm-based fat, the West-EU RBD palm oil market (VPI, CIF Rotterdam) rose 41.4%, and its 12-month high was 45.6% above its low.
- Packaging. West-EU LDPE film prices (partner price) rose 36.8% between December 2025 and September 2026, the latest monthly print. Within those nine months the high was 71.0% above the low, so the timing of a bag contract matters.
- Gas. German THE natural gas futures (front month, EEX) roughly tripled, up 208.6% between 17 November 2025 and 16 November 2026. We use the THE hub because many EU bakery gas contracts price off a national hub.
- Electricity. The UK power market (baseload month, EEX) rose 145.9% between 18 November 2025 and 16 November 2026.
Three small inputs are held flat below. Vesper’s yeast price and trade data covers China and global trade, but there is no published West-EU price for bakers’ yeast; yeast is grown on molasses and needs a lot of energy to make, so its price tends to follow both, with a lag. The ascorbic acid market in China, a common flour improver, swung 34.4% between its 12-month high and low but has no year-earlier print to compare. And EU-27 salt prices (Eurostat) rose 16.4% between December 2025 and September 2026, which at well under 1% of cost is too small to change the total.
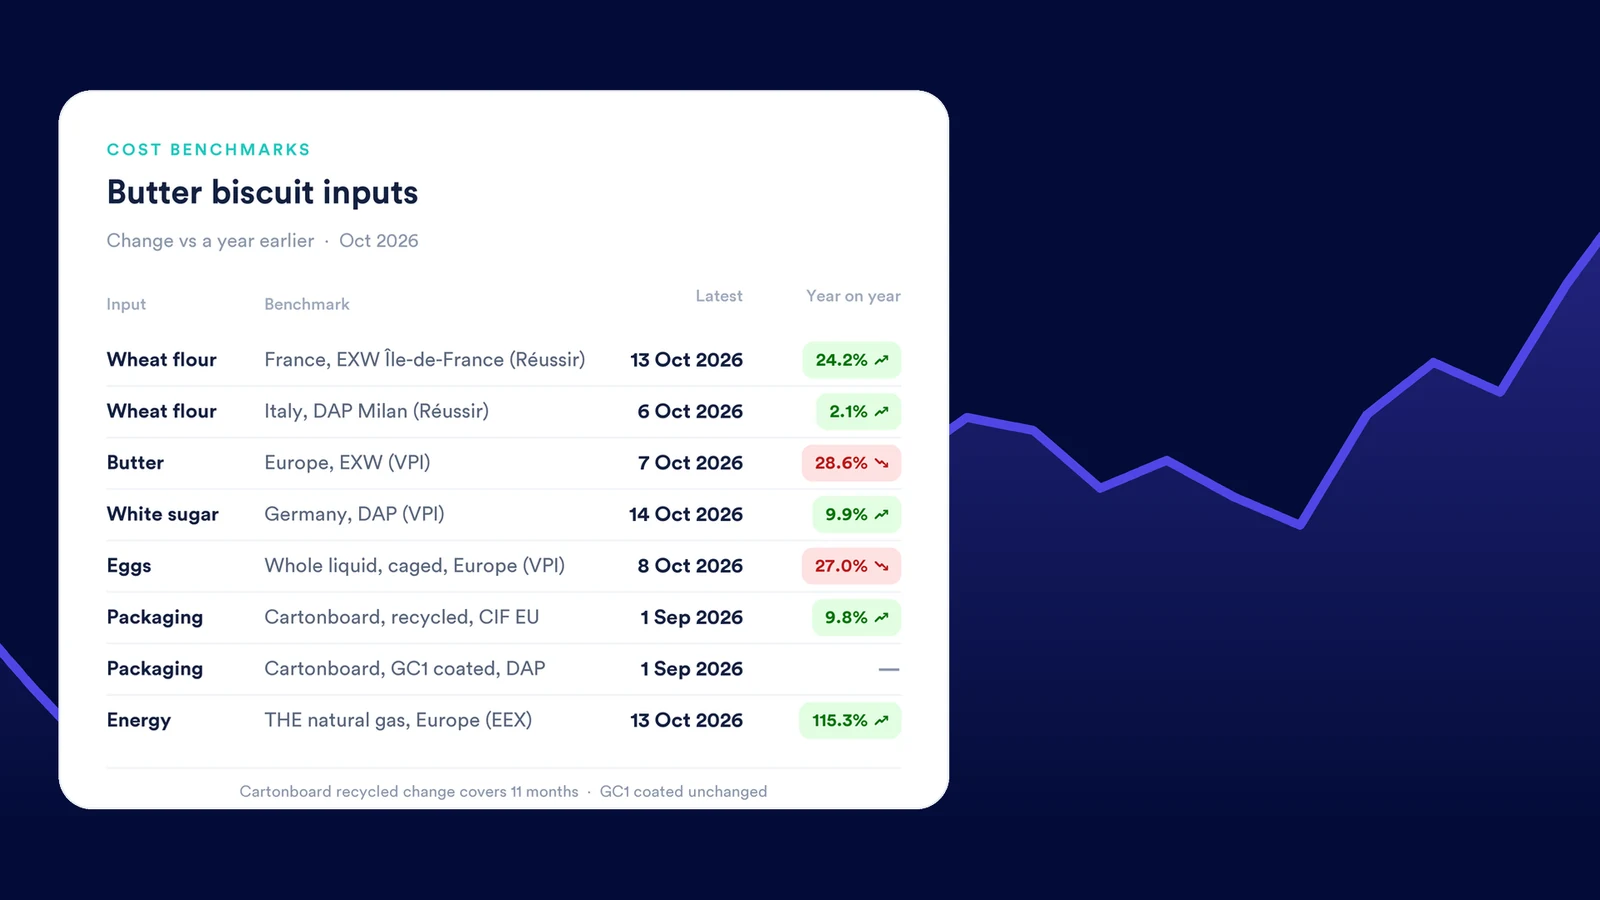
A note on dates. Our butter biscuit breakdown used prices from mid-October and showed RBD palm oil up 4.5% year on year and THE gas up 115.3%. One month later, the same series show +41.4% and +208.6%. Neither post is wrong. The base and end dates moved, and both series moved fast in between, which is why every percentage here comes with its dates.
What that did to unit cost
To turn price moves into a cost change, weight each one by its share of unit cost. A 20.2% rise in an input that is 30% of cost adds about 6.1 points to the total. A 208.6% rise in an input that is 2.5% of cost adds about 5.2.
| Input | Share of unit cost | 12-month move | Effect on unit cost |
|---|---|---|---|
| Wheat flour (France, 12%) | 30% | +20.2% | +6.07 points |
| Yeast | 2% | held flat | 0 points |
| Fat (refined rapeseed oil) | 2% | +24.6% | +0.49 points |
| Improvers, enzymes, soya flour | 3% | held flat | 0 points |
| Salt and sugar | 1% | held flat | 0 points |
| Packaging (LDPE film) | 6% | +36.8% | +2.21 points |
| Gas (THE front month) | 2.5% | +208.6% | +5.22 points |
| Electricity (UK baseload) | 1.5% | +145.9% | +2.19 points |
| Labour | 20% | held flat | 0 points |
| Distribution | 13% | held flat | 0 points |
| Overhead and margin | 19% | held flat | 0 points |
| Total | 100% | +16.2% |
Our calculation from the moves above. Cost shares are illustrative.
Three readings of that table:
Flour is the biggest single driver. At 30% of cost, a 20% rise adds six points on its own. For a UK baker, whose wheat rose 31.8%, the flour line is likely to have added more.
Energy matches flour. Gas and electricity together add 7.4 points, more than flour, from 4% of the cost. Without energy, this loaf would be up about 8.8%.
Packaging is not a rounding error. The bag is a thin piece of LDPE, but at 6% of cost and up 36.8%, it adds more than two points: more than yeast, fat, salt and improvers combined.
To put it in money: if a private-label 800 g loaf costs the plant €1.00 to make and deliver (a round number, not a measured cost), +16.2% is about 16 cents a loaf. Flour accounts for 6 of those cents, and energy for 7.
Three honest limits on this example:
- Most bakeries buy energy forward. The model applies the spot move to the whole energy share. A plant that fixed all of its gas and power a year ahead at last year’s prices would see energy add close to nothing this year, and the total would be about +8.8%. Half fixed, it would be about +12.5%.
- The energy share is a judgement. At the 1.9% in Vesper’s bread template instead of our 4%, energy adds about 3.5 points and the total is about +12%.
- Distribution is held flat. It runs on diesel and drivers’ wages, both of which can move. If you have evidence that they did, add a line.
The levers: what actually lowers bread production cost
Once you know the stack, you can see which levers are worth pulling. They apply whether you run the plant or buy the finished loaf and want to know what your supplier can do.
Lever 1: how flour is bought and specified
Flour is 30% of cost, so how it is bought matters more than any other ingredient decision.
- Price basis. Many bakeries buy flour on contracts that follow wheat, often with a fixed milling margin. Agree which wheat benchmark and which dates, and the price moves with the market instead of being renegotiated. See how a price adjustment clause works.
- Benchmark. Flour is priced nationally, so match the benchmark to the mill. Vesper carries flour quotations for France, Germany and the Swiss flour market, among others, and they do not move together.
- Cover. French flour’s 12-month high was 30.7% above its low. Fixing part of each future quarter in stages smooths that, and our guide to layered forward buying shows how.
- Protein spec. Stronger flour costs more. Some bakers run a slightly weaker flour and add vital wheat gluten or enzymes to make up the strength. Whether that saves money depends on the gap between flour grades at the time, so price it, don’t assume it. Our guide to wheat types for industrial baking covers the grades.
Lever 2: how energy is bought and used
Energy was 4% of cost and added 7.4 points. Three parts:
- Benchmark. Power is priced nationally too. We use UK baseload here; a Dutch plant would follow Dutch electricity prices instead.
- Buying. The difference between +16% and +9% in our example is entirely how much energy was fixed in advance. If you buy finished bread, ask your supplier how much of its next 12 months of gas and power is already fixed.
- Using. A tunnel oven burns gas whether it is full or not. Long runs, fewer gaps between products, heat recovery from oven exhaust and good insulation all lower energy per loaf.
Lever 3: waste, returns and bake loss
Bread has a shelf life of days, so waste is a real cost line hidden inside the others. Unsold loaves returned from stores, misshapes, end slices and overbaked batches all cost flour, energy, labour and delivery without being sold.
If 5% of loaves are lost or returned and you bring that to 3%, you need about 2% less of everything per loaf sold. Across the 48% of cost that is ingredients, packaging and energy, that is roughly 1 point off unit cost, before counting labour and delivery (our calculation, illustrative waste rates). Tight control of bake loss and fill weight works the same way.
Lever 4: the bag
Packaging is 6% of cost and rose 36.8%. The lever is not the print but the grams of film per loaf: bag thickness, bag size and the closure. A few microns less film on every bag adds up across millions of loaves.
Lever 5: the delivery model
Distribution is 13% of cost in our example, and it is driven by how often you deliver, how far, and how much each drop takes. Fewer, larger drops, shared routes and fewer returns all lower it. For a retail buyer, the delivery model is often a bigger cost lever than the recipe.
Putting it to work
A loaf’s cost is a weighted sum. At home, it is mostly flour and oven energy. In a plant bakery, it is flour, energy and packaging on top of a large base of labour and delivery. Once you have the weights, every market move turns into points of unit cost you can check.
For more on how wheat prices feed bakery margins, see our post on how soft wheat and butter price trends impact your bakery margins. If a supplier has just sent a price increase on bread, our guide to responding to a supplier price increase turns the same arithmetic into a step-by-step reply.
To run this for your own products, build a should-cost model with your real recipe and cost shares, then link each line to a price series. The walkthrough in that guide uses a loaf of bread as its example.
Vesper cost models do this automatically: your recipe, linked to live benchmarks for flour, fats, packaging film and energy, so you can see what your loaf should cost today and which input moved it.
Frequently asked questions
How much does it cost to make a loaf of bread at home?
Usually a little over one euro or dollar for a basic white loaf, but the split is the useful part. In our illustrative home loaf, flour is about 40% of the cost and oven energy more than a third, because a home oven heats a whole cavity for one loaf. A bread machine uses less energy than a full-size oven, and baking two loaves at once roughly halves the energy per loaf.
How much does it cost a bakery to make a loaf of bread?
It depends on the plant, the recipe and the delivery model, so the useful answer is the cost structure. In our illustrative 800 g sliced white loaf from a plant bakery, ingredients are 38% of unit cost (flour 30%), packaging 6%, energy 4%, labour 20%, distribution 13%, and overhead and margin 19%. Replace these shares with your own supplier's breakdown as soon as you have it.
What is the most expensive ingredient in bread?
Flour, by a wide margin. It is about 60% of the dough by weight and around four fifths of the ingredient bill. Water is about a third of the dough and costs almost nothing. Yeast, fat, salt and improvers together are a small share of cost, even though some of them cost far more per kilo than flour.
Why is a factory loaf so much cheaper to bake than a home loaf?
Mostly energy and scale. A tunnel oven bakes thousands of loaves an hour, so the gas per loaf is a small fraction of what a home oven uses for one. Flour bought by the tonne also costs far less per kilo than flour bought in a 1 kg bag. What a plant bakery pays for instead is labour, overnight production, daily delivery to stores and the bag.
How much did bread production cost rise in the last year?
In our illustrative plant-bakery loaf, about 16% over the 12 months to November 2026, if spot energy prices flow straight through. French wheat flour rose 20.2%, LDPE film 36.8% (December to September) and German THE gas futures roughly tripled. Energy contributes 7.4 points of the increase despite being 4% of cost. A bakery that had fixed its energy a year ahead would see closer to 9%.