Every morning, grain buyers across the US refresh the same number. Sometimes it is the CBOT corn settle, sometimes the soybean close, sometimes the KC HRW wheat contract that most of the market still refers to as part of the CBOT complex. Whatever the specific contract, the number itself is quoted back to suppliers in negotiation, typed into cost models, and printed in the morning market summary without much interrogation.
And yet in most procurement conversations we have had over the past year, there is a quiet assumption baked into how that number is used: that the CBOT price somehow tells you where the market is going. It doesn’t entirely does. Understanding what the CBOT price actually represents, and what it leaves out, has become more important as procurement teams are asked to commit further forward, with thinner inventory, against markets that do not sit still.
This article is about that gap. Not a critique of the CBOT, but a clearer look at what the price does and does not do, and where a second layer of modeling tends to earn its keep.
Where the CBOT price comes from
A CBOT futures settle is the last traded price for a standardized contract on a given trading day. The corn contract covers 5,000 bushels of No. 2 yellow corn, deliverable in a specific future month, at approved delivery points along the Illinois River. Every day, thousands of participants (commercial hedgers, speculators, farmer-sellers, index funds, end-users) trade that contract, and the settlement price reflects what the market as a whole is willing to pay for delivery at that future date, based on what is known right now.
That is worth stating plainly, because the implication shapes everything else. The CBOT price is not a forecast. It is not a prediction. It is a continuously updated auction where the world’s collective view of supply, demand, and risk gets priced in, second by second.
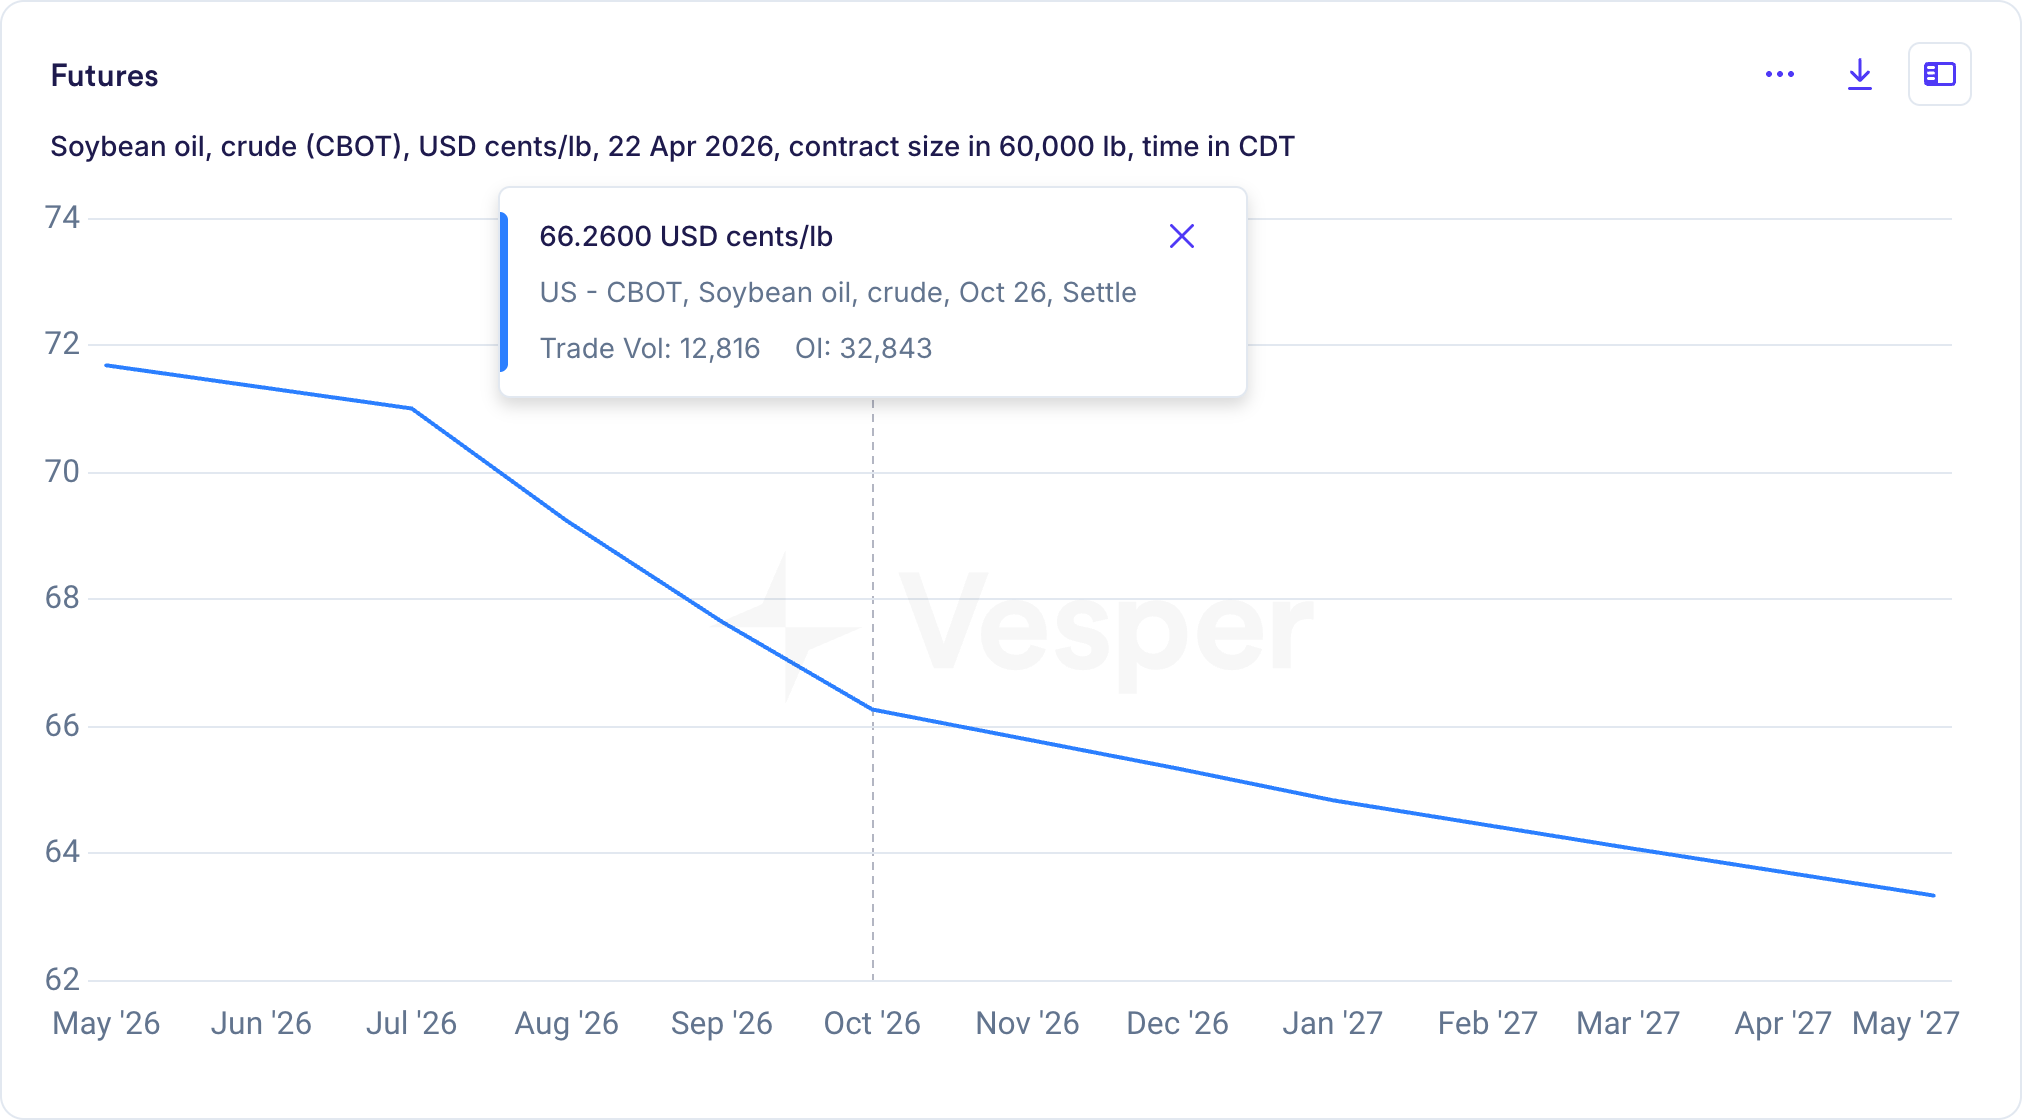
CBOT soybean oil futures curve, 22 April 2026
Here is what a CBOT curve looks like on a live trading day. The CBOT soybean oil contract, pulled on 22 April 2026, shows the October 2026 settle at 66.26 US cents per pound, with the forward curve sloping downward through May 2027. Each point on the curve is the market’s clearing price for delivery at that specific month. The downward slope here is what the market calls backwardation, and it often reflects near-term tightness in the physical market combined with an expectation that supply conditions will ease over the coming year. What the curve is not, importantly, is a forecast. It is a consensus of where thousands of market participants are willing to transact for delivery at each date, given what they know today.
What the CBOT price does tell you
It tells you today’s consensus on supply and demand. Every settle bakes in current crop condition reports, USDA WASDE estimates, weather outlooks for producing regions, export demand signals (especially Chinese soybean bookings), and macro inputs like the dollar, energy prices, and freight spreads. If any of those shift, the CBOT usually moves within minutes. That is what makes it valuable as a real-time indicator; it is also what makes it reactive by construction.
It tells you the market’s forward bets, but not its forward view. The CBOT trades multiple contract months for every major commodity, and the settlements across those months form a forward curve. This curve is sometimes mistaken for a forecast. It isn’t. It is the market’s collective willingness to bet on where the commodity will settle at each future delivery date, given what is currently known. When the curve is in contango, later months are priced higher and often signal expected storage cost or anticipated tightness down the road; when it is in backwardation, the front months sit higher than the back, often pointing to near-term scarcity. Useful signals, both of them, but consensus signals rather than modeled ones.
It tells you how much uncertainty the market is pricing in. CBOT daily ranges and implied volatility numbers offer a real-time read on trader confidence. Wide ranges during weather scares, USDA report days, or geopolitical shocks tell you the market itself does not know what is coming, which is a signal worth using when timing forward commitments.
It anchors your physical basis. Every physical grain or oilseed transaction in North America prices off the CBOT as a futures reference plus or minus a regional basis. A miller’s wheat bid in Kansas, a crusher’s soybean meal offer in Iowa, a feed buyer’s corn quote in Nebraska; all of it traces back to CBOT plus or minus a local adjustment. Without the CBOT number, basis is meaningless. That anchoring role is the single most important function the CBOT plays in the cash market.
What the CBOT price does not tell you
This is where procurement strategies that rely only on the screen start to break down.
It doesn’t tell you where the price is actually going. The market’s consensus bet is not the same thing as what will happen. Traders are right often enough to stay in business, but they are also surprised often enough that USDA WASDE and Crop Production days routinely move prices by several percent in the space of minutes. Weather is unpredictable. Chinese demand shifts without advance notice. Biofuel policy changes can reshape soybean oil overnight. The CBOT price tells you what the collective market currently believes; it does not tell you whether that belief is correct, and betting your procurement budget on the belief being right in either direction is a thinly reasoned position.
It doesn’t tell you your physical cost. CBOT soybean futures settle at delivery points along the Illinois River. If you buy soybeans in Minnesota, Iowa, Nebraska, or Louisiana, your cash price will diverge from the CBOT settle by a basis that can swing 50 cents or more in a matter of weeks, driven by local logistics, export demand at nearby ports, and storage economics. A procurement team that treats a 10-cent CBOT move as a 10-cent cost move for their plant is missing half the picture.
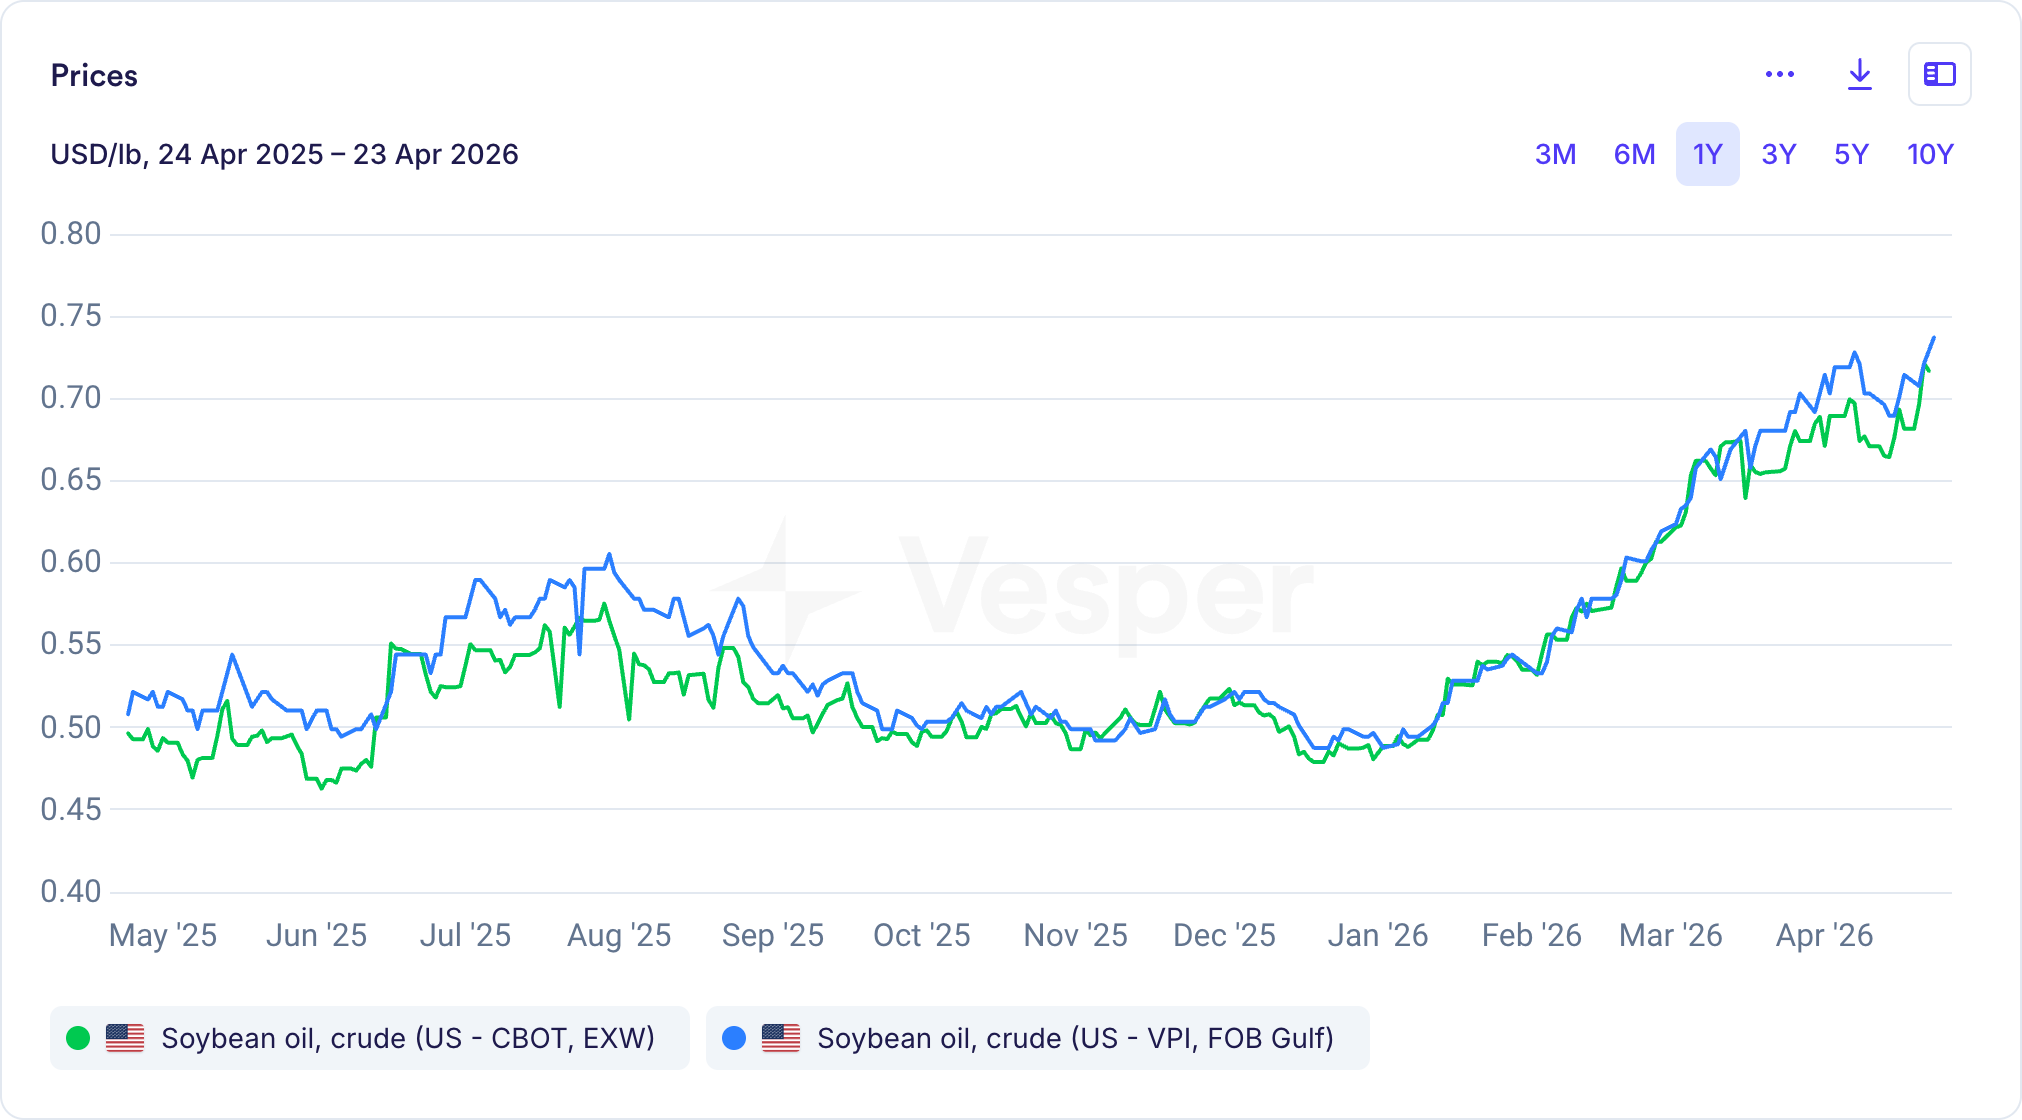
CBOT futures vs Vesper Price Index for soybean oil, 1 year
The same dynamic is visible on adjacent commodities. The green line above is the CBOT soybean oil (crude) settle over the twelve months to April 2026. The blue line is the Vesper Price Index for the same commodity, priced FOB Gulf. The two series track closely, but the Vesper physical benchmark sits slightly above the CBOT settle for most of the period, reflecting the freight, port, and delivery premium that buyers actually pay for physical product. A procurement team pricing their real spend against the CBOT settle alone would consistently underestimate it by several cents per pound, which on a 60,000-pound soybean oil contract is a meaningful number. Reading the CBOT settle is correct; treating it as the cost of physical product is not.
It doesn’t give you a reliable forward view beyond a year. Liquidity on the CBOT curve thins sharply after the nearby 6 to 12 months. By the time you are looking at corn or soybean prices 18 months out, the curve is being drawn by a handful of traders with limited participation, and the word “consensus” starts to feel decorative. For a procurement team building a 2027 budget, the futures screen alone does not offer a credible reference.
It doesn’t price what hasn’t happened yet. By definition, the CBOT reflects what is known and expected. It cannot price the weather shock that will hit next month, the trade policy change that has not been announced, the biofuel mandate shift still being drafted. If your procurement advantage depends on anticipating what is not yet in the price, the screen alone is the wrong instrument.
It doesn’t tell you whether the current price is a good buy. CBOT corn at $4.50 is information. Whether $4.50 is cheap, fair, or expensive against the underlying fundamentals is a separate question, and the settle itself does not answer it.
The CBOT price is not a forecast
Most of what the CBOT cannot do, in the list above, traces back to the same underlying reason: the CBOT price is not a forecast. The two instruments look similar on a screen but are built for different jobs, and reading them side by side is where procurement teams tend to get their strongest signals. A companion article walks through the distinction in full, with a worked example on CBOT Soft Red Winter wheat.
The layer most procurement teams add
For buyers operating against this gap, the usual response has been to supplement the CBOT with an independent view on where prices are heading. This used to be the territory of in-house analysts, bank research desks, and a handful of consultancies. More recently, AI-driven modeling has made that forward layer considerably more accessible and, as we have measured, considerably more accurate over long horizons than many market participants expected.
At Vesper, we publish AI forecasts on every major CBOT-listed grain and oilseed benchmark. These are not competing with the CBOT; they are reading the same market and returning a second, independent view on where prices appear to be heading over the next one, three, six, and twelve months, each with a confidence band.
Take CBOT soybean oil as a worked example. Measured over the last two years, the Vesper CBOT soybean oil (crude) forecast has held 94% accuracy at one month, 92% at three months, 91% at six months, and 85% at twelve months. That twelve-month number is the one worth sitting with. Most commodity forecasts lose their signal well before the one-year mark, and staying at the 85% line at a full year is rare in a market where biofuel demand, export flows, and crush economics pull prices in different directions at different times.
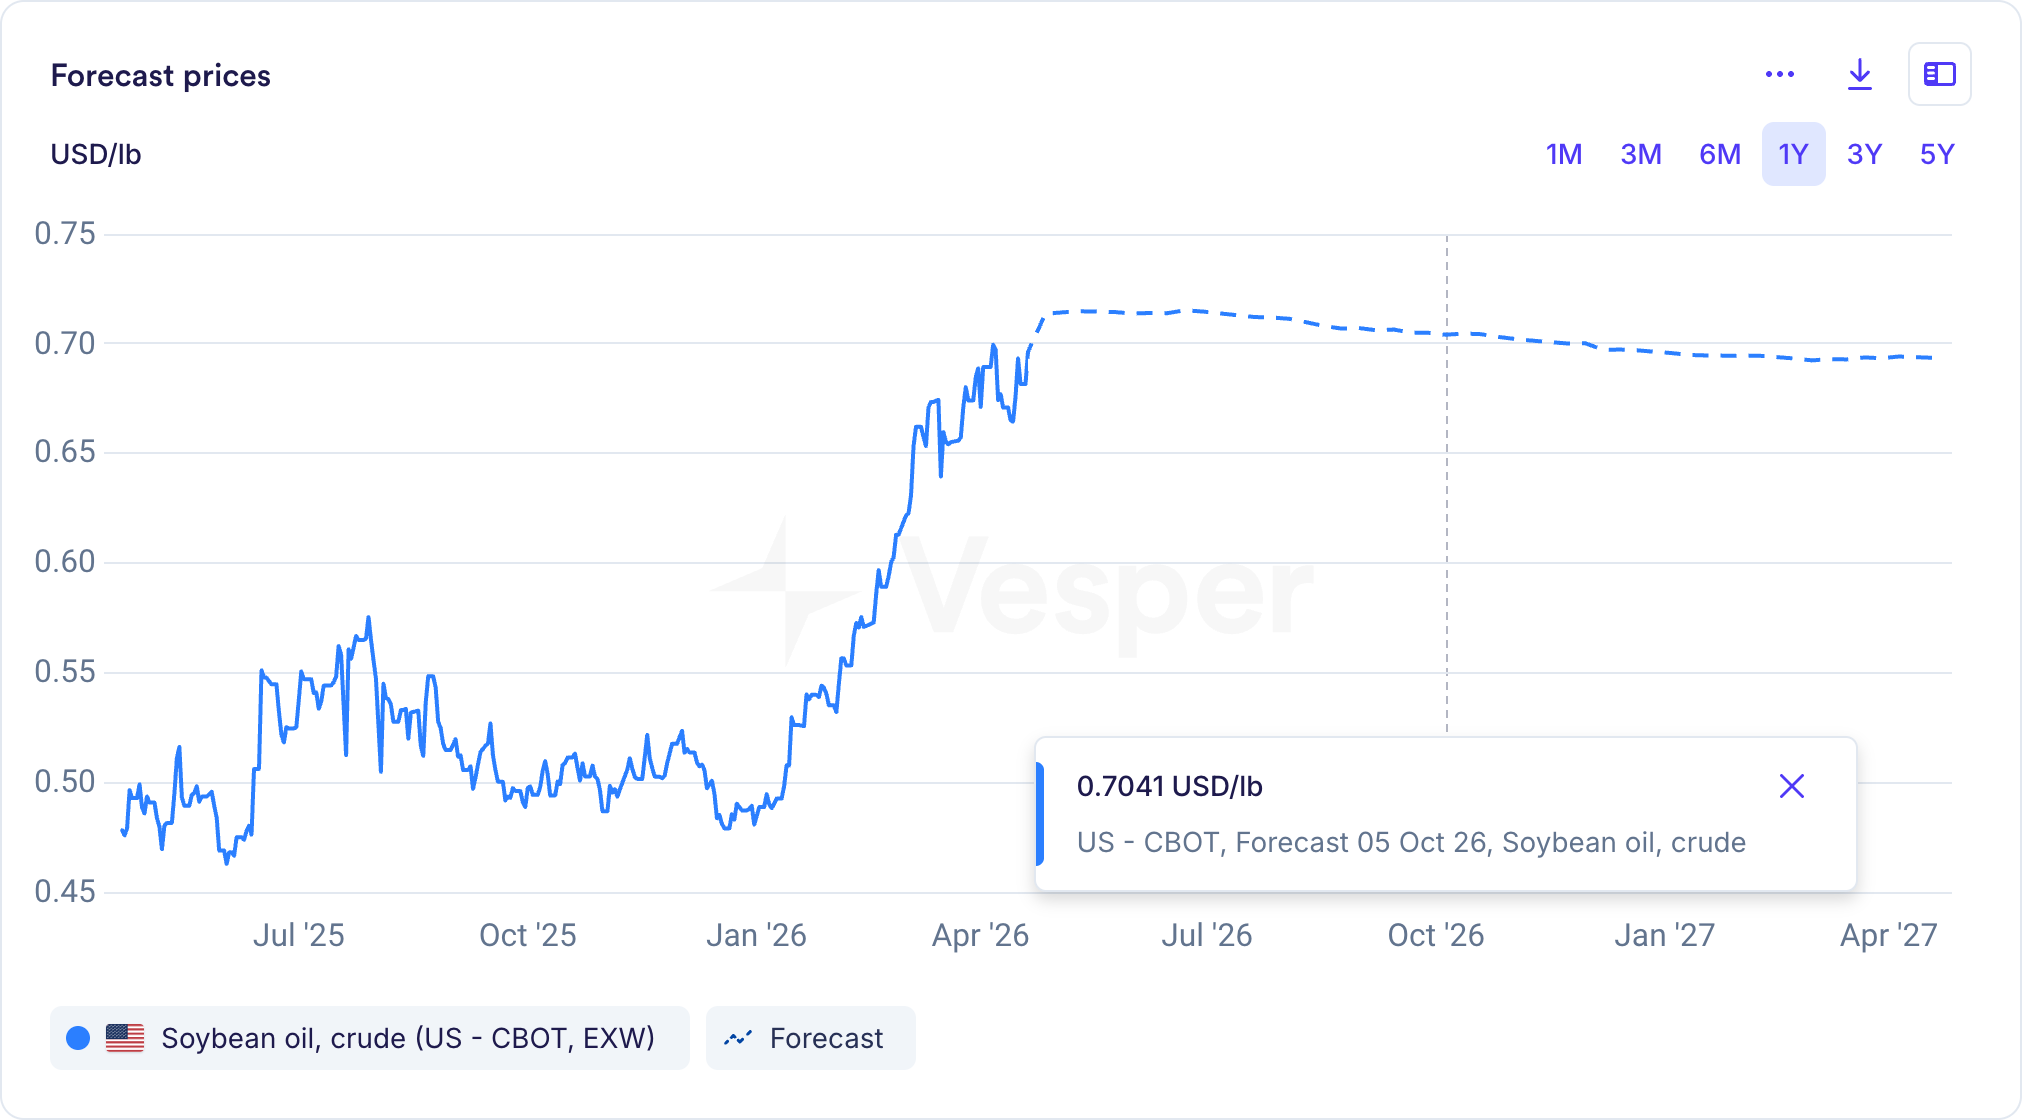
Vesper AI forecast for CBOT soybean oil, crude
Here is what the soybean oil forecast looks like in practice. The solid blue line is historical physical market pricing through April 2026; the dashed line is the Vesper AI forecast through the following year. The October 2026 forecast point sits at 0.7041 USD per pound. The model sees the recent rally (from near 0.48 USD/lb in October 2025 to around 0.70 by April 2026) stabilizing in that range through summer, before easing modestly toward 0.69 by early 2027. For a buyer budgeting soybean oil cost into Q1 2027, that stabilization at current levels is the scenario to plan around, and the forecast’s 85% accuracy at twelve months is the confidence metric that makes the plan defensible to finance.
Across every CBOT benchmark on the platform, the value of a forecast is less “we predict the price will be X” and more “here is where the model sees it heading, here is the confidence band around that, and here is how that view compares to what the CBOT curve is currently implying.” When the two agree, that is confirmation. When they diverge, that is where the analytical work begins.
What this means for US grain buyers
Reading the CBOT will always be the first move in grain procurement, and for good reason; the settle is honest, transparent, and the closest thing the market has to a shared reference. The question is what sits next to it in the workflow.
For buyers working budget cycles, the CBOT curve alone gives you a consensus number that weakens past twelve months. A modeled forecast with confidence bands gives you something you can actually defend in a board deck. For buyers negotiating forward contracts, the CBOT settle tells you where the supplier’s offer is anchored; a forward view on the same benchmark tells you whether the anchor looks fair. For buyers managing spreads (the soybean crush, the HRW-SRW basis, the corn-wheat ratio), the CBOT gives you today’s snapshot; a forecast on each leg tells you which side is likely to move first.
None of this is an argument against the CBOT. It is an argument for understanding exactly what the CBOT is built to do, which is price what is known, and what it isn’t built to do, which is anticipate what isn’t.
Want a forward view on every major CBOT benchmark? Vesper tracks corn, soybean, soybean meal, soybean oil, oats, long grain rice, HRW wheat, and SRW wheat with AI forecasts, confidence bands, and weekly expert analysis from our grains team. Explore the platform.
Frequently asked questions
What does the CBOT price mean, and how is it different from cash grain prices?
The CBOT price is the last traded settlement of a standardized futures contract for a specific delivery month, at approved delivery points along the Illinois River for most grain contracts. It reflects what the market collectively believes a commodity will be worth at that future delivery date, based on all information available today. Cash grain prices, on the other hand, are what a farmer or commercial buyer actually pays or receives at a local elevator, port, or processor. The two are linked by basis, the difference between the CBOT futures price and the local cash price, which reflects freight, storage, local supply and demand, and delivery logistics. A CBOT move of 10 cents does not automatically translate into a 10-cent cash move; regional basis can absorb, amplify, or fully offset the futures signal.
The Vesper Price Index (VPI) sits between those two worlds. The VPI is our proprietary benchmark for physical commodity prices, built from a panel of real trade data and designed to reflect what buyers are actually paying in specific regions and delivery terms. For a procurement team trying to move from “the futures went up” to “here is what we are actually paying on the ground,” the VPI alongside the CBOT gives you a complete picture: the futures reference, the independent physical benchmark, and the gap between them. You can read more about the Vesper Price Index methodology if you want to dig into how the benchmark is constructed.
How do farmers hedge with CBOT futures?
The classic hedge for a farmer selling grain is short futures. A corn farmer expecting to harvest 50,000 bushels in October might sell corn futures for December delivery, locking in a price and protecting against a price decline between planting and harvest. If prices fall, the short futures position gains value and offsets the lower cash price at the elevator; if prices rise, the gain on the physical sale is offset by a loss on the futures. The farmer has traded upside for certainty.
The hedge works best when the forward direction of the market is informed by more than intuition, which is where an independent forecast earns its keep. Farmers using Vesper’s AI forecasts on CBOT corn, soybean, and wheat benchmarks can compare the model’s view of where prices are heading against the futures curve they are about to hedge into. When the forecast and the curve agree, hedging decisions carry more conviction. When they diverge, the farmer knows to investigate before committing to a forward position. Vesper’s CBOT forecasts are published with confidence bands and a two-year accuracy track record, which is the kind of evidence most hedging decisions benefit from.