Futures prices and price forecasts are two of the most commonly referenced data types in US commodity procurement. Both extend out to a future date. Both return a number. On Vesper’s platform, they sit next to each other in the same workflow. They are also two different instruments, built for different jobs.
The distinction matters in the moments when a decision has to rely on one or the other specifically: a forward contract commitment, a budget submission to finance, a hedge execution. It also matters for anyone who needs to communicate the numbers to stakeholders (CFOs, procurement committees, board members) who encounter them in a cost model or a presentation but do not work inside commodity markets every day.
This article walks through what each instrument actually is, using CBOT Soft Red Winter wheat as the example throughout, and shows why reading a futures price and a price forecast side by side tends to produce the strongest procurement decisions.
A futures price is a live auction, not a prediction
Consider what a CBOT wheat futures curve actually is.
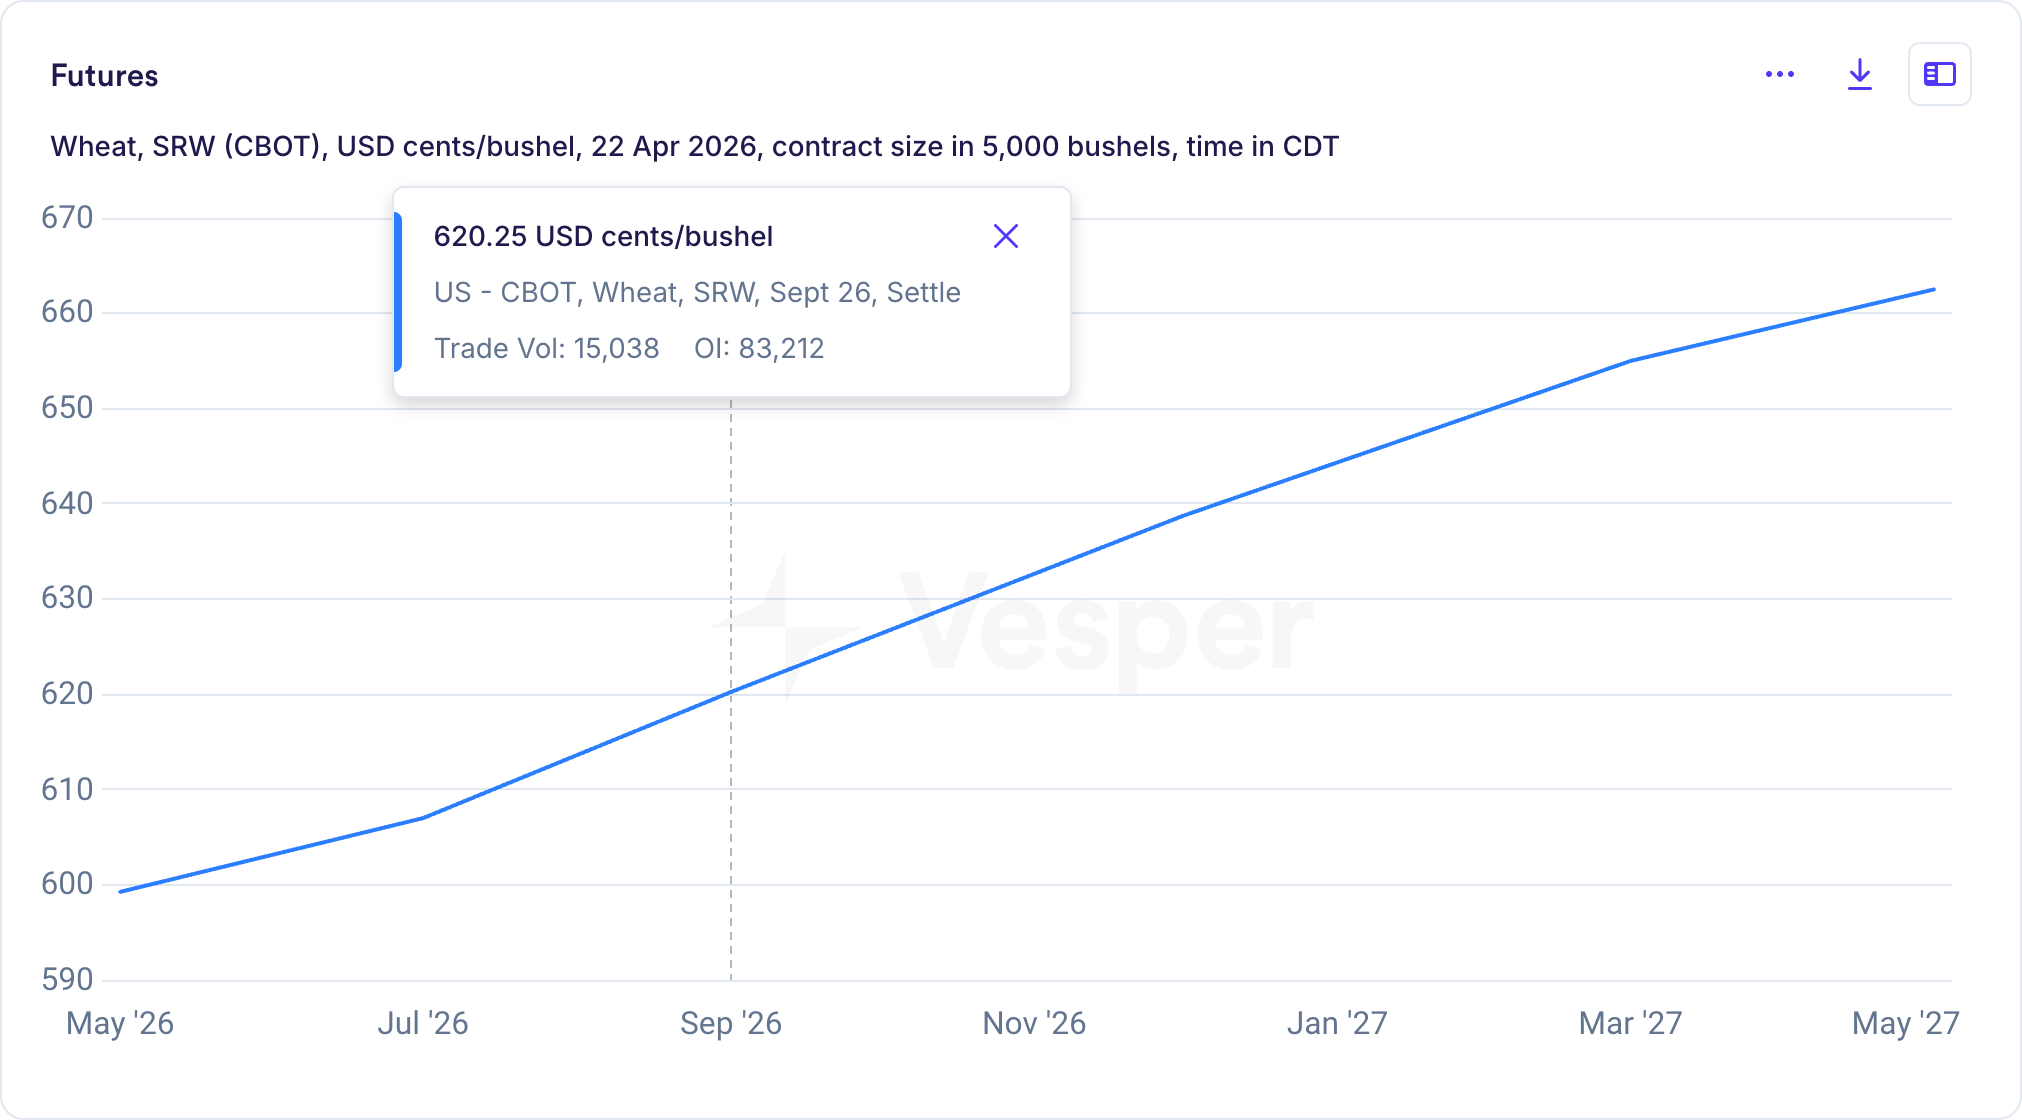
CBOT SRW wheat futures curve, 22 April 2026
What this chart is showing is the current settlement price for each traded contract month on the CBOT Soft Red Winter wheat contract, pulled from live trading on 22 April 2026. The September 2026 contract settled at 620.25 USD cents per bushel. The December contract settled higher. The May 2027 contract sits near 663 cents. The curve rises from the front month to the deferred months in what the market calls contango.
That rising curve is often mistaken for a forecast. It isn’t. It is the market’s collective willingness, as of the close of trading today, to buy or sell each of those contracts at those settlement prices. Contango typically reflects storage cost, interest on capital, and the carrying cost of holding grain across months; it is not a prediction that wheat prices will actually be at 663 cents a bushel by May 2027. If anything, a steep contango often signals that near-term supplies are comfortable and the market is willing to discount front-month delivery against later delivery.
More to the point: the curve moves every trading day in response to weather reports, export data, USDA announcements, macro signals, and new positions from commercial hedgers and speculators. It updates continuously, which is exactly what makes it valuable as a reference for today’s consensus. It is also exactly what makes it something other than a prediction. A prediction does not move because the trader next to you just bought 50 contracts.
A price forecast is a modeled path, with published accuracy
Now look at the same underlying commodity, CBOT Soft Red Winter wheat, through a different lens.
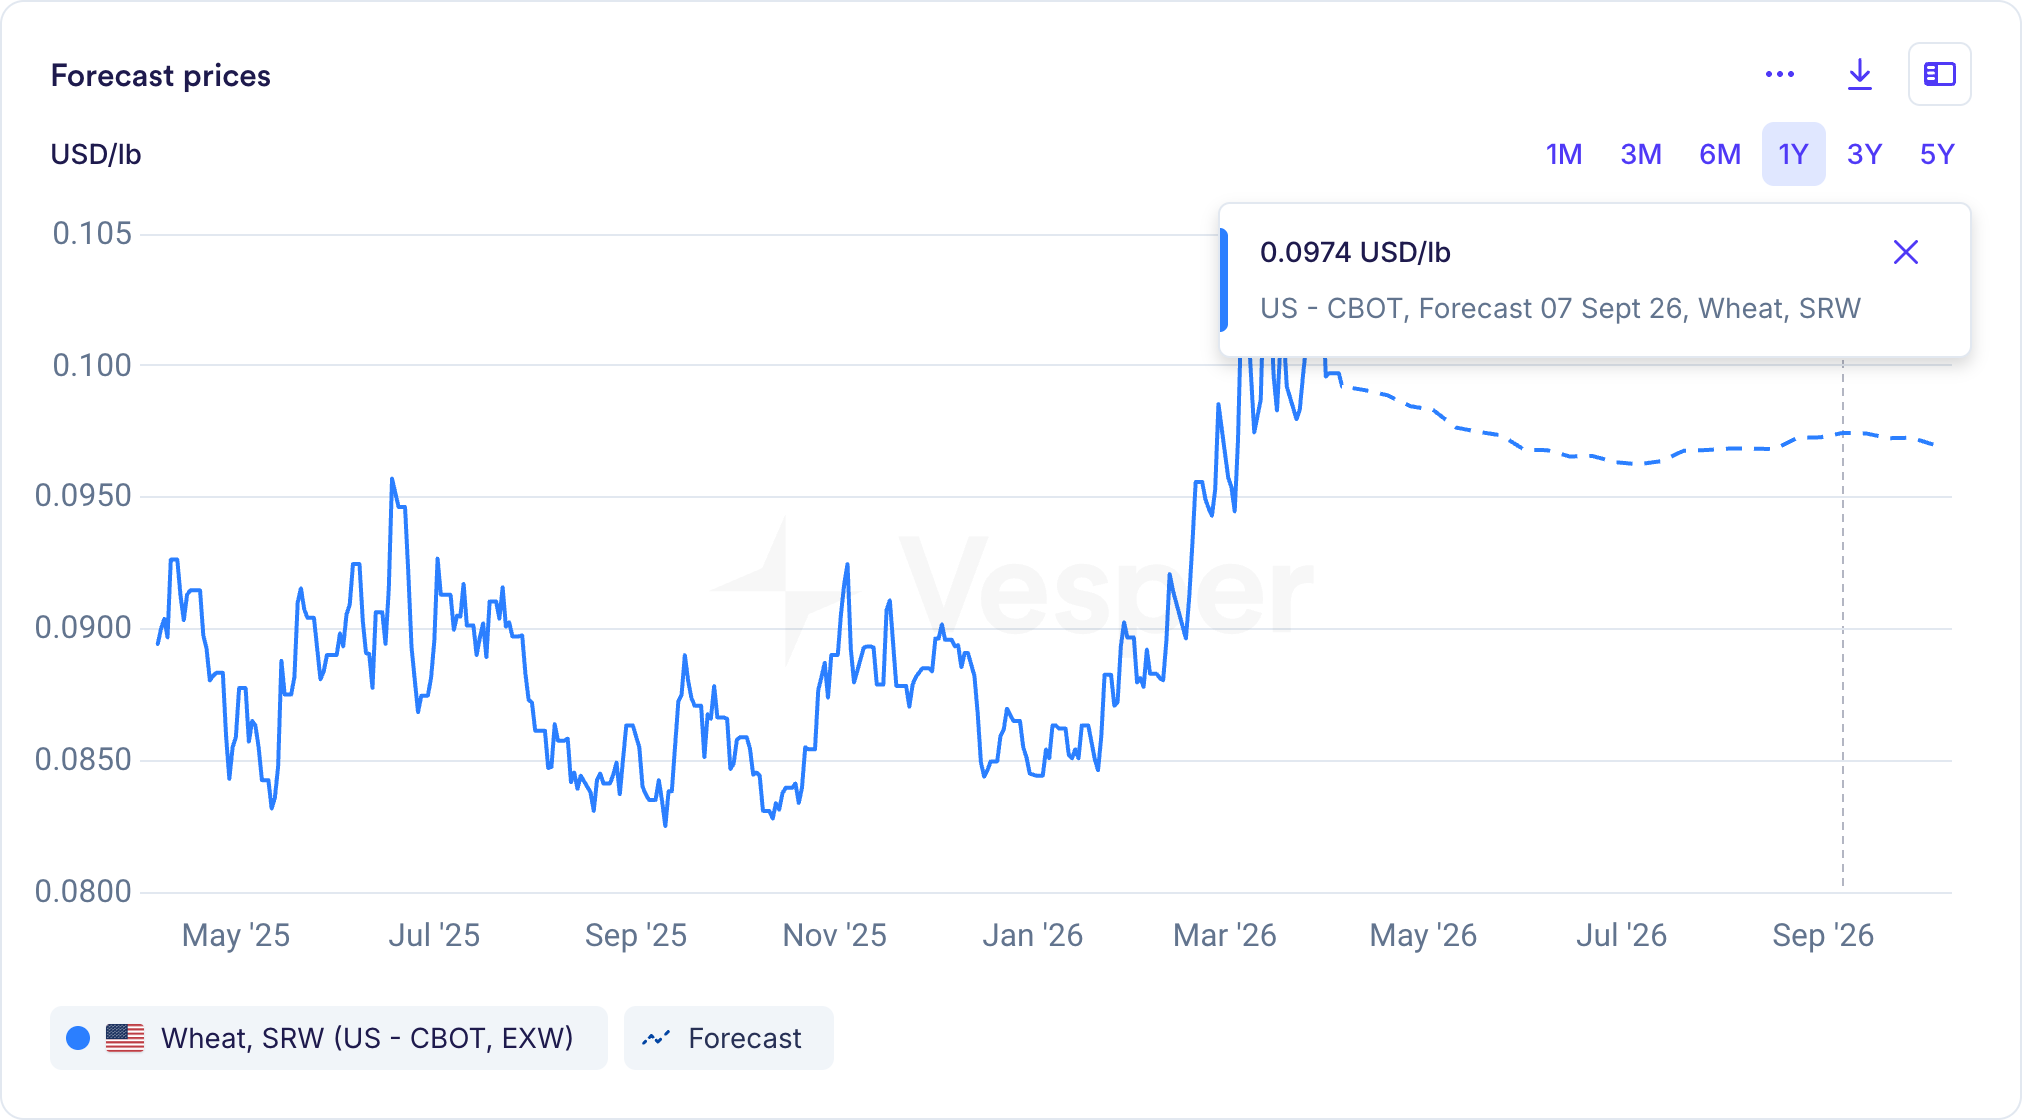
Vesper AI forecast for CBOT SRW wheat, two-year accuracy
What is happening inside that forecast is structurally different from what the futures curve is doing. A forecast is produced by a model (in this case an AI system trained on many years of price history, fundamentals, weather data, and macro signals) that returns a predicted price path with an associated uncertainty band. The model does not move when a single trader takes a position; it moves when the underlying inputs change, and it can be evaluated for accuracy against historical outcomes. The accuracy number on the right-hand side of the screen is the model’s measured track record, not a marketing claim.
The forecast shown here projects a slight easing from the recent spike, followed by stabilization through the forecast window. That is a modeled view, not a market bet. If you disagree with the model, you can inspect the inputs, look at the confidence band, or compare the forecast against the CBOT futures curve and decide which signal you find more credible for the decision you need to make.
Why the two look different, even on the same commodity
When you look at the CBOT SRW wheat futures curve and the Vesper CBOT SRW wheat forecast side by side, on the exact same commodity, they point to slightly different outcomes. That is not an error. It is by design.
The futures curve tells you what the market is currently willing to transact at, including all the traders who are hedging, speculating, or rolling positions. The forecast tells you what a model estimates is most likely to happen, based on inputs that are not visible on the trading screen. Weather outlooks far enough forward that the market has not yet priced them in; export flows that are still building; policy changes that are expected but not yet announced. A good forecast is ahead of the curve in the literal sense; it is pricing in information the market has not yet processed.
When the two agree, a procurement team gets confirmation. That is usually a green light to commit. When the two diverge, a procurement team gets information. That is the signal to dig in, understand what the model is seeing that the market has not priced, and make a decision with eyes open to the disagreement.
The same distinction applies on the CME
The futures-versus-forecast distinction applies just as cleanly on the CME as it does on the CBOT. The underlying mechanics are identical: any CME futures curve is a live auction settlement reflecting today’s consensus, while a Vesper forecast on the same contract is a modeled view of where the price is heading, with published accuracy. The two tools work together on any exchange, on any commodity.
When to use a futures price, and when to use a forecast
In practice, the two instruments answer different questions.
Use a futures price to know today’s market consensus, and as the reference for contracts. The CBOT and CME settlements are the agreed reference that most US commodity contracts already use. Your miller quotes off a futures curve. Your crusher quotes off a futures curve. Your broker executes against a futures curve. The market consensus is what you are transacting against; it is not what a model thinks.
Use a price forecast to decide what to do with that market consensus. Should you commit to the current level, wait, hedge forward, or swap suppliers? The futures curve does not answer that. A forecast, with a confidence band and a measured accuracy record, is the instrument designed for the decision rather than the transaction.
Most of the procurement teams we work with land in the same pattern once the distinction is clear. They read the CBOT or CME curve daily to understand where the market sits, they read a forecast alongside it to understand where the market is likely to move, and they treat disagreement between the two as a cue to investigate rather than as an error.
What this means for US commodity buyers
The futures price is not your forecast, and the forecast is not your futures price. They are complementary instruments that work best when read together, each for the job it is designed to do. Reading the CBOT or CME as though it were a forecast often produces slightly misaligned procurement decisions. Reading a forecast as though it were a live market quote undervalues the quality of the model.
The cleanest posture we see, across grain buyers, dairy ingredient buyers, livestock buyers, and specialty commodity buyers, is the same. Use the CBOT or CME settle as the market reference. Use a forecast to decide what to do with that reference. Treat the comparison between the two as a signal in its own right.
Want to see Vesper’s AI forecasts alongside the CBOT and CME benchmarks you already track? Vesper publishes forecasts on every major CBOT grain and oilseed contract and every major CME dairy and livestock contract, with confidence bands and published accuracy records. Explore the platform.
Frequently asked questions
Is a futures price the same as a price forecast?
No. A futures price is the live settlement of an auction on a standardized contract at an exchange (CBOT, CME, or similar), reflecting what the market is currently willing to pay for delivery at a future date. A price forecast is a modeled estimate of where a price is likely to move over a defined horizon, produced by an analyst or AI system, with an associated uncertainty band and a measurable accuracy record.
Is a CBOT or CME futures curve a forecast?
No, even though it is often mistaken for one. A futures curve is the settlement of currently traded contracts at different delivery months. It reflects the market’s willingness to transact at those prices today, adjusted for storage, interest, and supply expectations. It is not a modeled prediction of where prices will land.
Why is the CBOT futures curve sometimes rising when a forecast shows prices stabilizing or easing?
A rising curve (contango) usually reflects storage cost, capital cost, and near-term supply comfort. It is not a prediction that prices will actually land higher at the later delivery months. A forecast showing prices stabilizing or easing is saying something structurally different: the underlying fundamentals, according to the model, suggest a different path than the market’s contango is implying. Disagreements between the two are common, and they are often where the most useful analytical work happens.
How accurate are commodity price forecasts?
Accuracy varies by commodity and horizon. Vesper publishes measured accuracy for every forecast we produce, based on the last two years of performance. Our strongest long-range forecast, USDA alfalfa hay, has held 92% accuracy at twelve months. Our strongest CBOT forecast, Soybean, has held 88% accuracy at twelve months. Our strongest CME forecast, NFDM, has held 95% at one month and 88% at three months. Accuracy below 85% at a specific horizon does not mean the forecast is unusable; it means the buyer should read it alongside the futures curve rather than in place of it.
How should I use a futures price and a forecast together?
Use the futures price as your market reference and transactional anchor, and use a forecast to decide what to do with that reference. When the two agree, that is confirmation. When they diverge, that is the cue to investigate what the model is seeing, or what the market is pricing in, before committing to a forward position.