The European chocolate industry is experiencing a dramatic market correction in early 2026. After cocoa futures hit historic highs in 2024, nearly tripling in price, the market has now fallen approximately 65% from those peaks. Procurement managers who navigated the crisis of 2024-2025 are now operating in a stabilizing but still volatile environment where understanding complete manufacturing costs has never been more critical.
But here’s what the cocoa price headlines miss: raw materials represent only 68.6% of your total milk chocolate bar costs. Even as cocoa prices have fallen sharply, the remaining 31.4% in non-ingredient costs, labor, energy, overhead, and profit margins, continues to impact your bottom line in ways that commodity price trackers simply don’t capture.
For procurement managers making decisions today, understanding the complete cost structure means the difference between capitalizing on current market conditions and missing strategic opportunities.
Here’s how to break down every euro spent on milk chocolate manufacturing, and what strategic decisions this visibility unlocks.
The complete cost picture: more than just ingredients
Most procurement managers track ingredient costs religiously. But here’s what often gets missed: raw materials represent only 68.6% of your total milk chocolate bar costs.
The remaining 31.4%? That’s your non-ingredient costs, labor, energy, overhead, and profit margins. Miss these, and you’re making decisions with incomplete information.
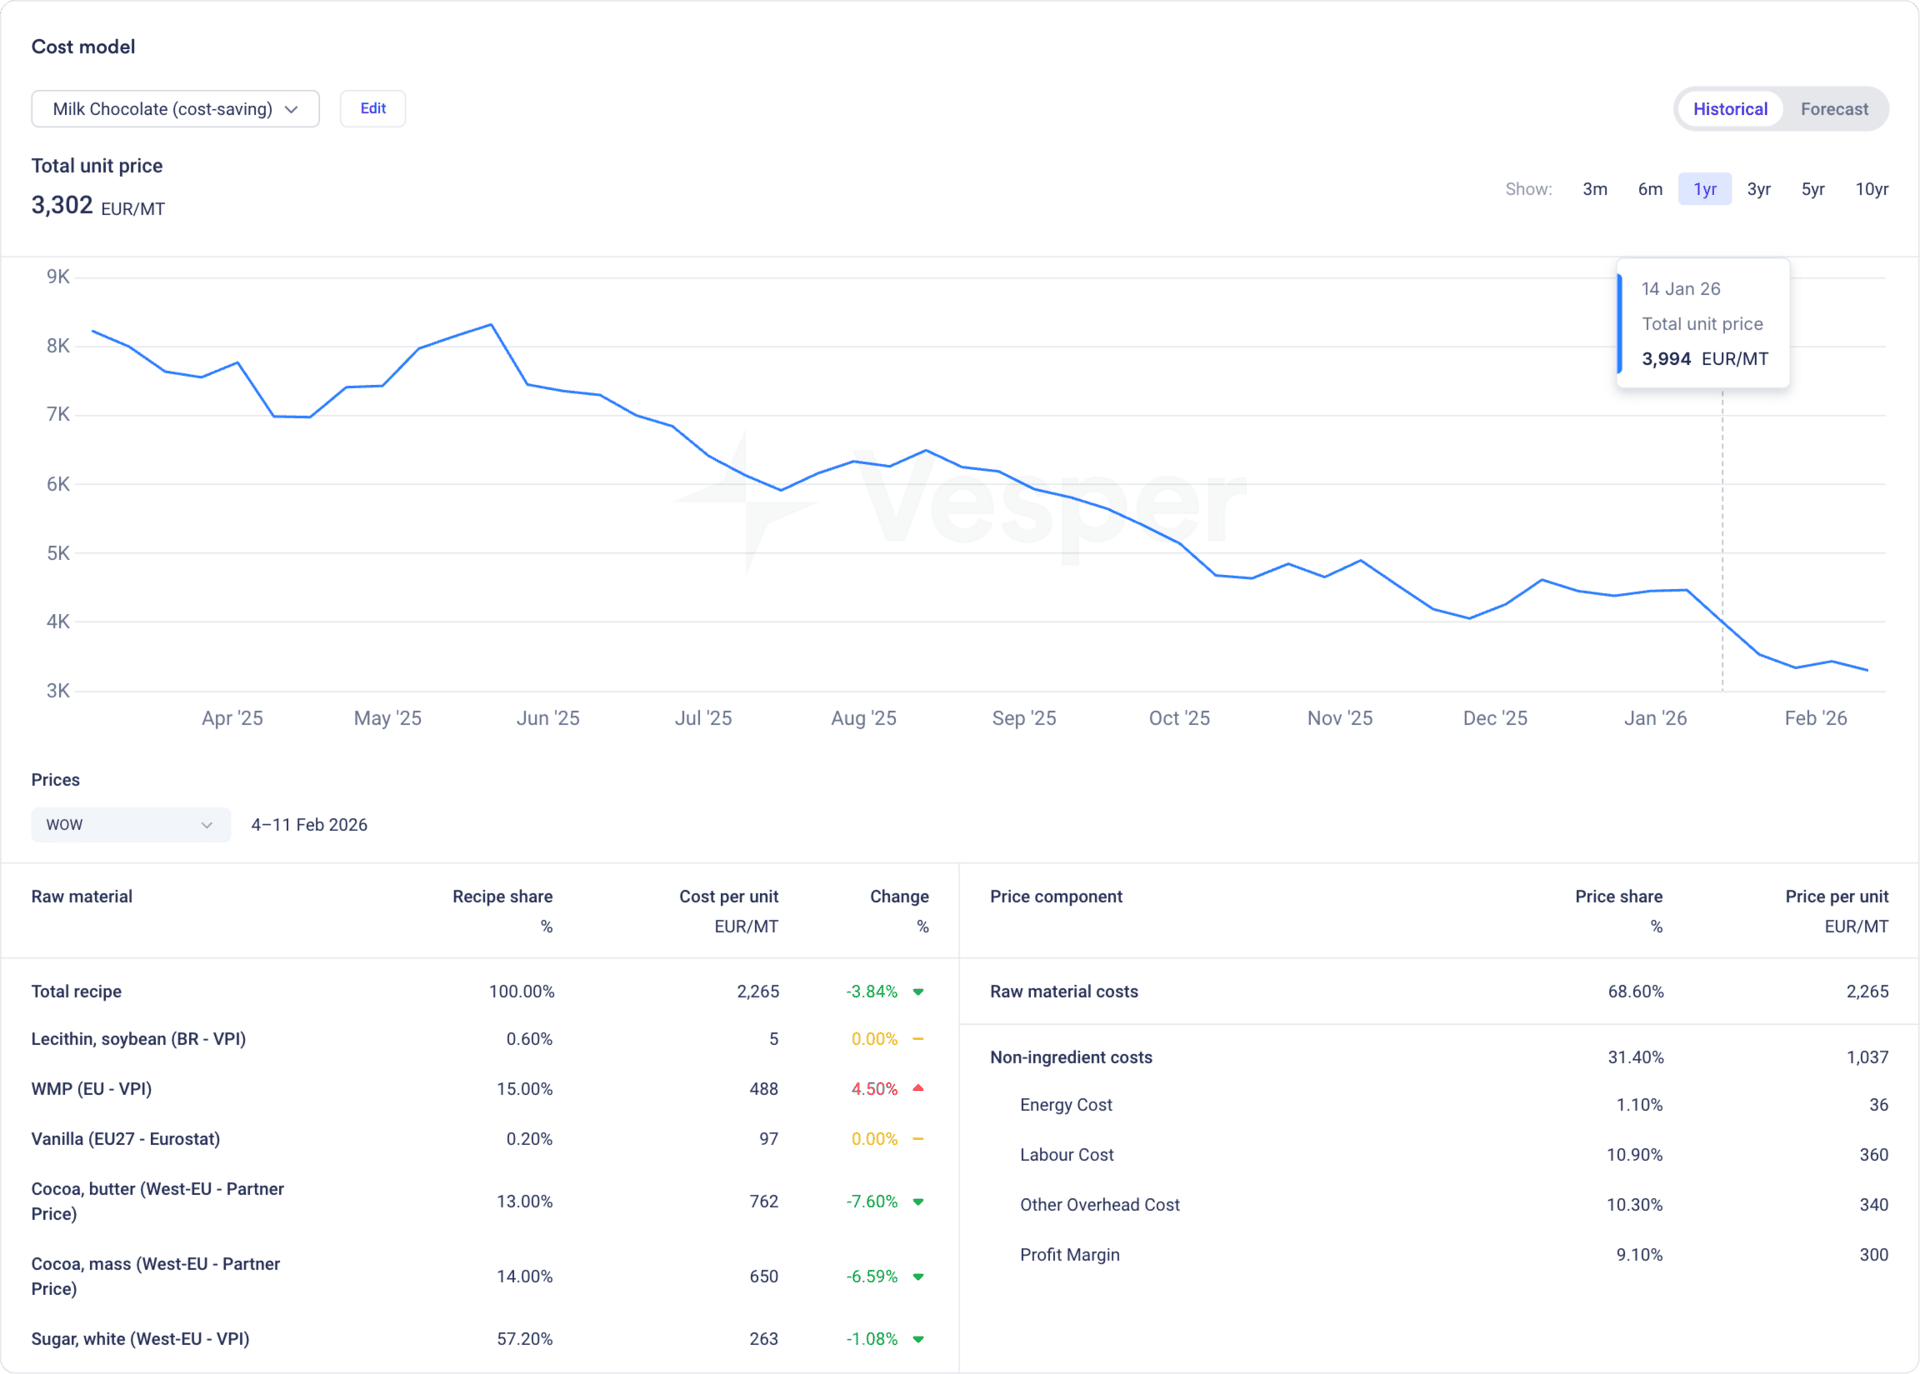
Current milk chocolate bar cost breakdown (per metric ton):
- Total unit price: €3,770/MT
- Raw material costs: €2,586 (68.6%)
- Non-ingredient costs: €1,184 (31.4%)
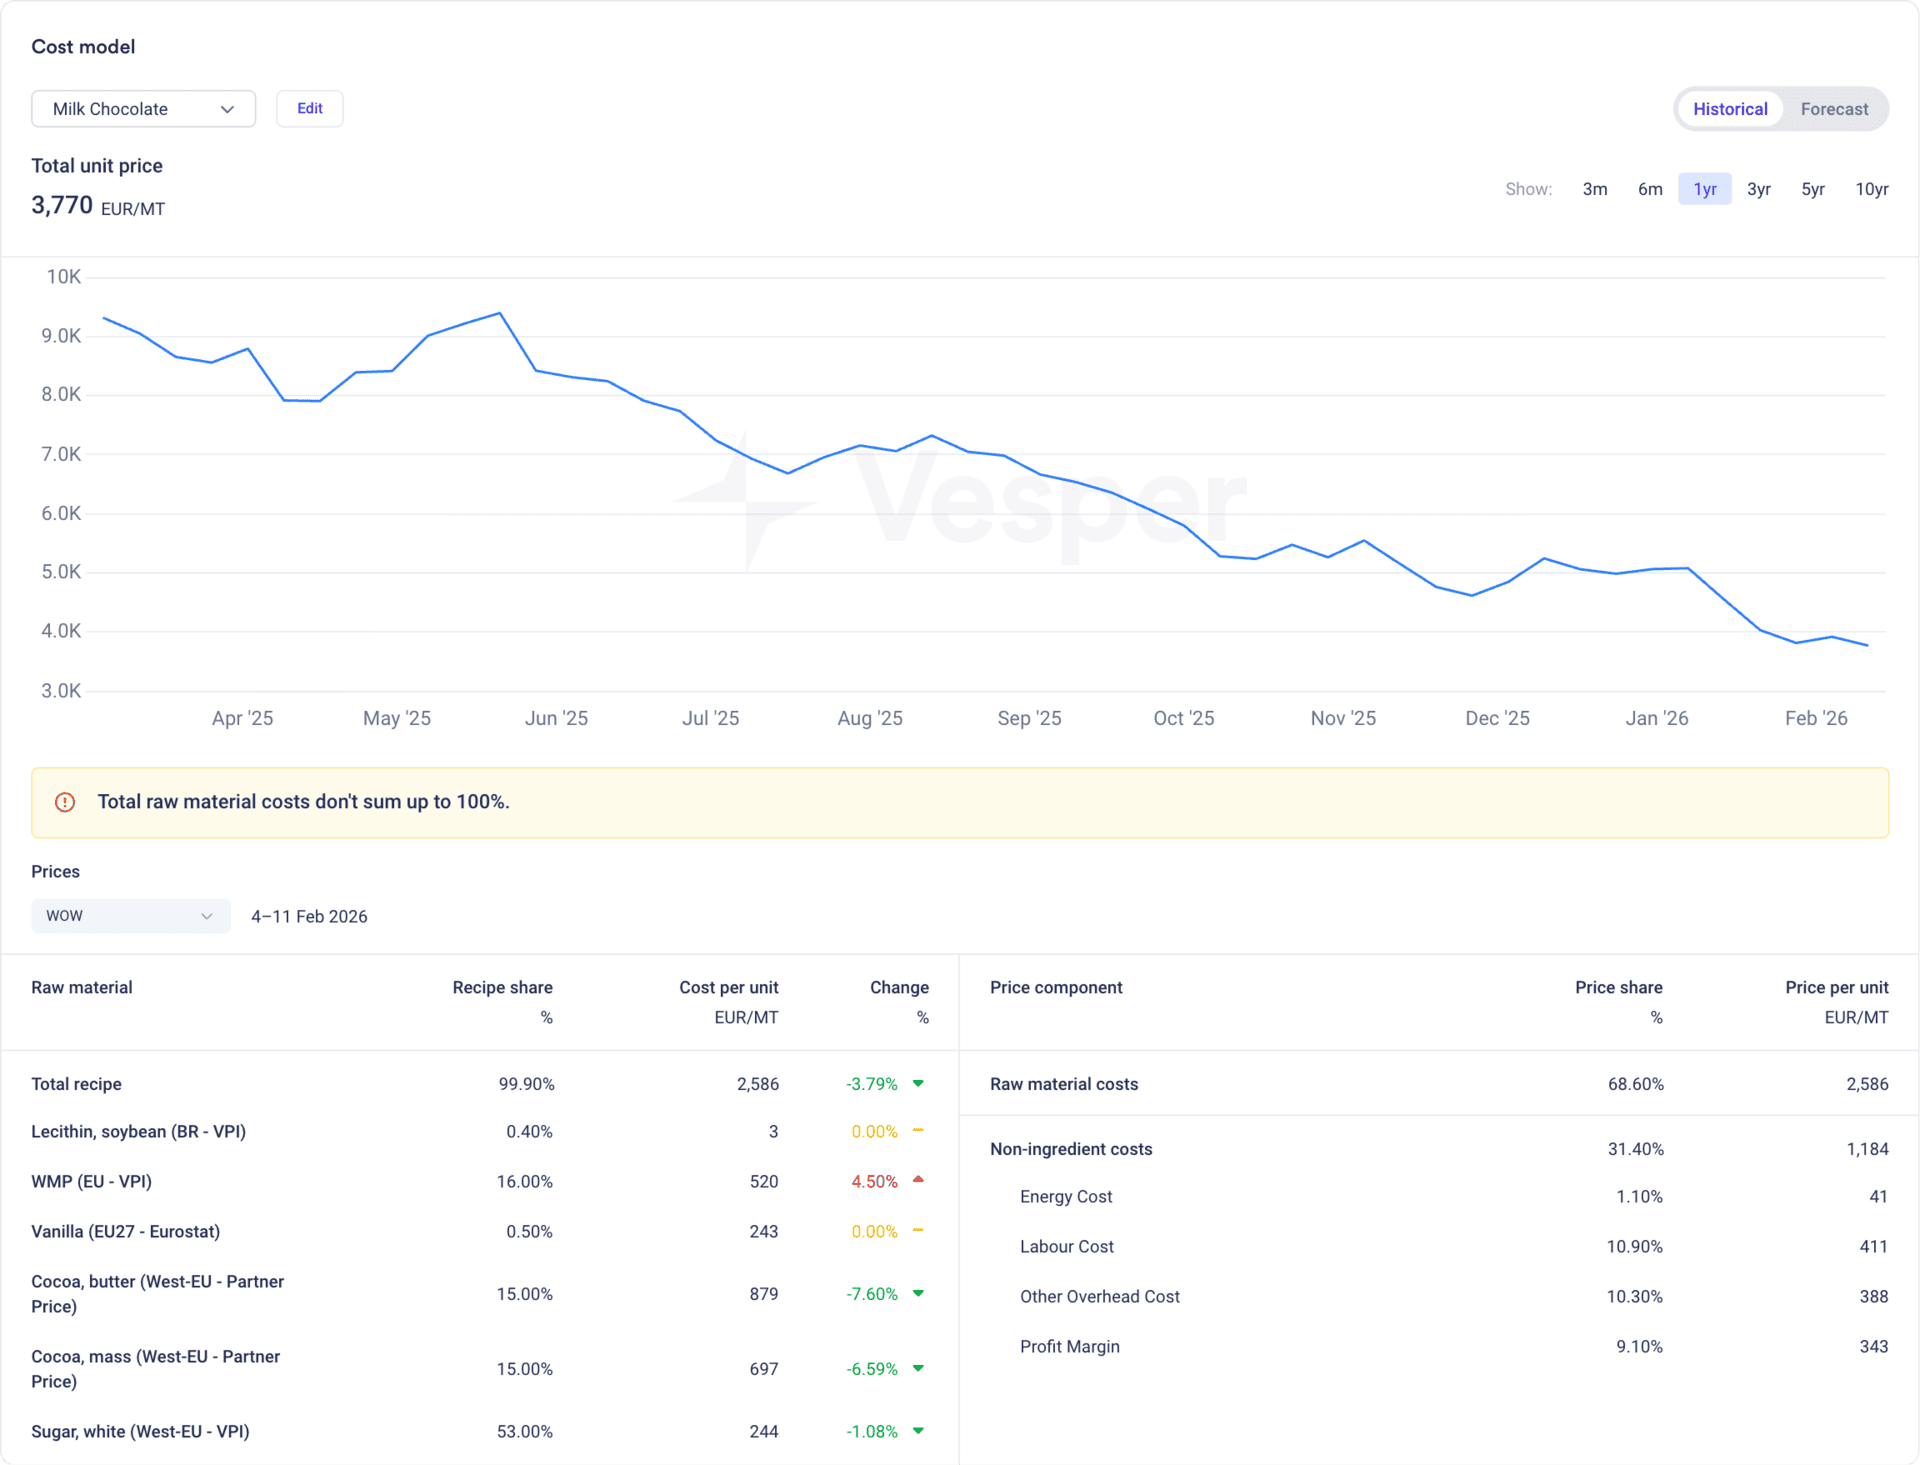
This complete picture only becomes visible when you use cost models that combine ingredient benchmarks with manufacturing overhead data, something traditional commodity tracking tools simply can’t provide.
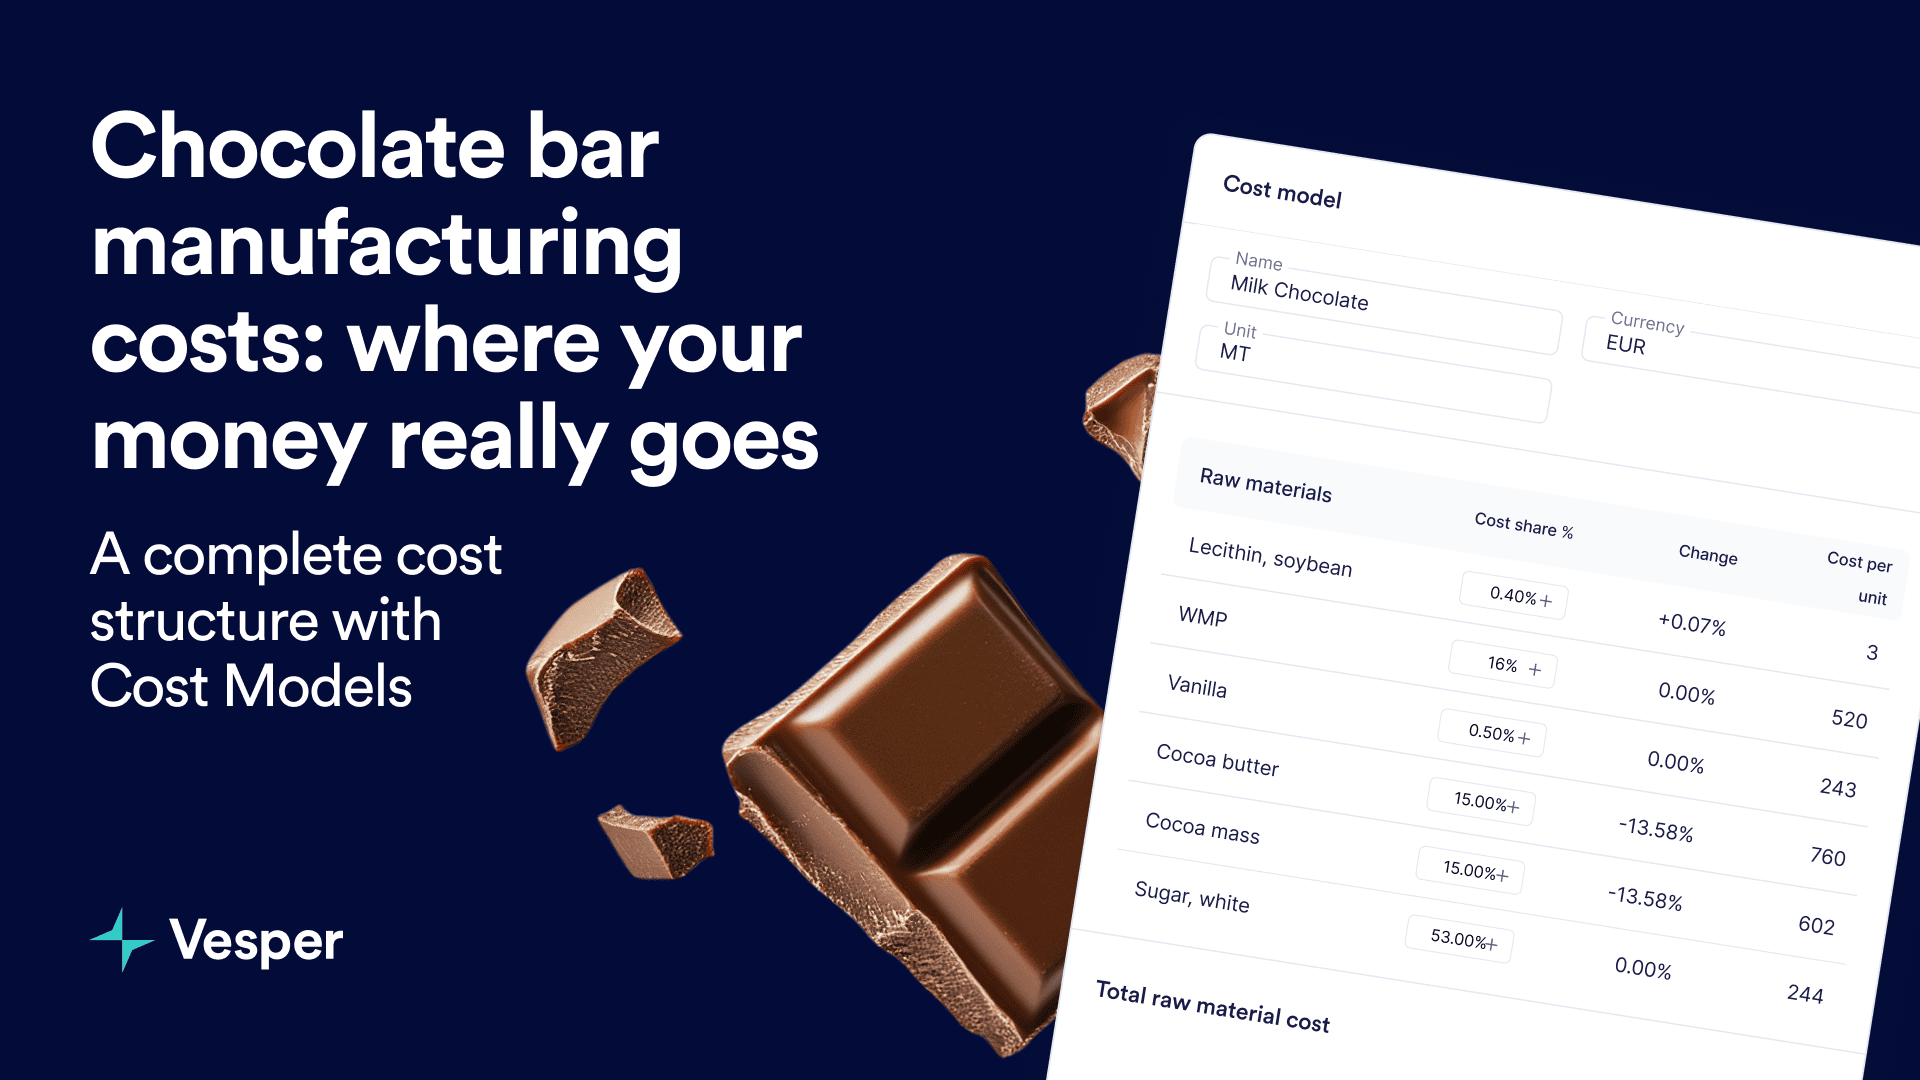
Breaking down raw material costs: what really matters
Let’s look at the ingredient structure of a standard milk chocolate bar:
Major ingredients:
- Sugar (white, West-EU): 53% of recipe (€244/MT)
- WMP (whey milk powder): 16% (€520/MT)
- Cocoa butter: 15% (€879/MT)
- Cocoa mass: 15% (€697/MT)
- Vanilla extract: 0.5% (€243/MT)
- Lecithin (soybean): 0.4% (€3/MT)
Sugar dominates your recipe by volume, but cocoa butter and cocoa mass drive your costs per unit. Throughout 2024 and into early 2025, this is where unprecedented volatility created havoc for chocolate manufacturers.
Recent price movements (comparing current Feb 2026 levels to early 2025):
- Cocoa butter: down 7.6% from recent highs
- Cocoa mass: down 6.59% from recent highs
- WMP: up 4.5% (offsetting some cocoa savings)
- Sugar: down 1.08% (relatively stable)
The cocoa market correction through late 2025 and into 2026 has provided significant relief for chocolate manufacturers. Cocoa futures that peaked near £10,000/MT in 2024 now trade around £3,000-4,000/MT, a dramatic 65% decline from those highs.
But WMP increases have partially offset those gains, and this is exactly why you need to monitor all ingredients simultaneously, not just cocoa. When one ingredient softens, another often moves in the opposite direction.
Non-ingredient costs: the hidden 31%
Here’s where most cost models fall short. Vesper’s partnership with (among many others) IBISWorld provides industry-specific benchmarks for chocolate manufacturing across multiple regions, covering 36 European countries plus the United States and Canada.
This means whether you’re sourcing from European suppliers, manufacturing in North America, or comparing costs across regions, you have access to consistent, reliable non-ingredient cost data that reflects actual industry averages.
For chocolate manufacturing, here’s your non-ingredient breakdown registered on the 17th of February 2026:
- Labor Cost: 10.9% (€411/MT)
- Covers salaries, wages, benefits, health insurance, and payroll taxes for full-time, part-time, temporary, and contract employees
- Other Overhead Cost: 10.3% (€388/MT)
- Includes repair and maintenance, IT services, insurance, distribution, warehousing, professional services, waste management, vehicle costs, telecommunications, and R&D
- Profit Margin: 9.1% (€343/MT)
- EBIT (Earnings Before Interest and Taxes)
- Energy Cost: 1.1% (€41/MT)
- Direct expenditure on electricity, natural gas, steam, and other energy sources for manufacturing, processing, mixing, heating, cooling, and packaging operations
These aren’t assumptions or rough estimates, they’re actual averages compiled from national statistical offices and industry data providers. For European markets, this includes data from INSEE (France), Destatis (Germany), ONS (UK), ISTAT (Italy), and others. For North American markets, IBISWorld provides comparable industry benchmarks for both the United States and Canada.
This geographic breadth matters for procurement managers evaluating sourcing strategies across regions. You can now compare whether manufacturing costs in Germany differ meaningfully from those in the US, or whether a Canadian supplier’s pricing reflects realistic industry overhead structures.
While cocoa prices have dropped dramatically, these non-ingredient costs remain relatively stable. Energy costs may fluctuate with utility prices, and labor costs typically increase with inflation, but they don’t exhibit the extreme volatility of commodity ingredients. This is precisely why understanding the complete 100% matters, you can’t control cocoa price swings, but you can benchmark whether your non-ingredient costs are competitive across different manufacturing regions.
Forecasting your costs: planning beyond today
One of the biggest challenges in chocolate procurement? Planning next year’s contracts when commodity markets remain volatile.
With cost model forecasting available on Vesper, you can see projected costs up to 12 months ahead:
1-month forecast (11 Feb – 11 Mar 2026):
- Forecasted total cost: €2,591/MT (95% historical accuracy)
- Change from current: +0.18%
Key ingredient movements ahead:
- Vanilla: +37.1% (watch this closely)
- Cocoa butter: -5.49% (continued softening expected)
- Cocoa mass: -5.49% (mirroring butter trends)
- Lecithin: -1.5%
- WMP: +0.2% (stabilizing)
- Sugar: +0.01% (flat)
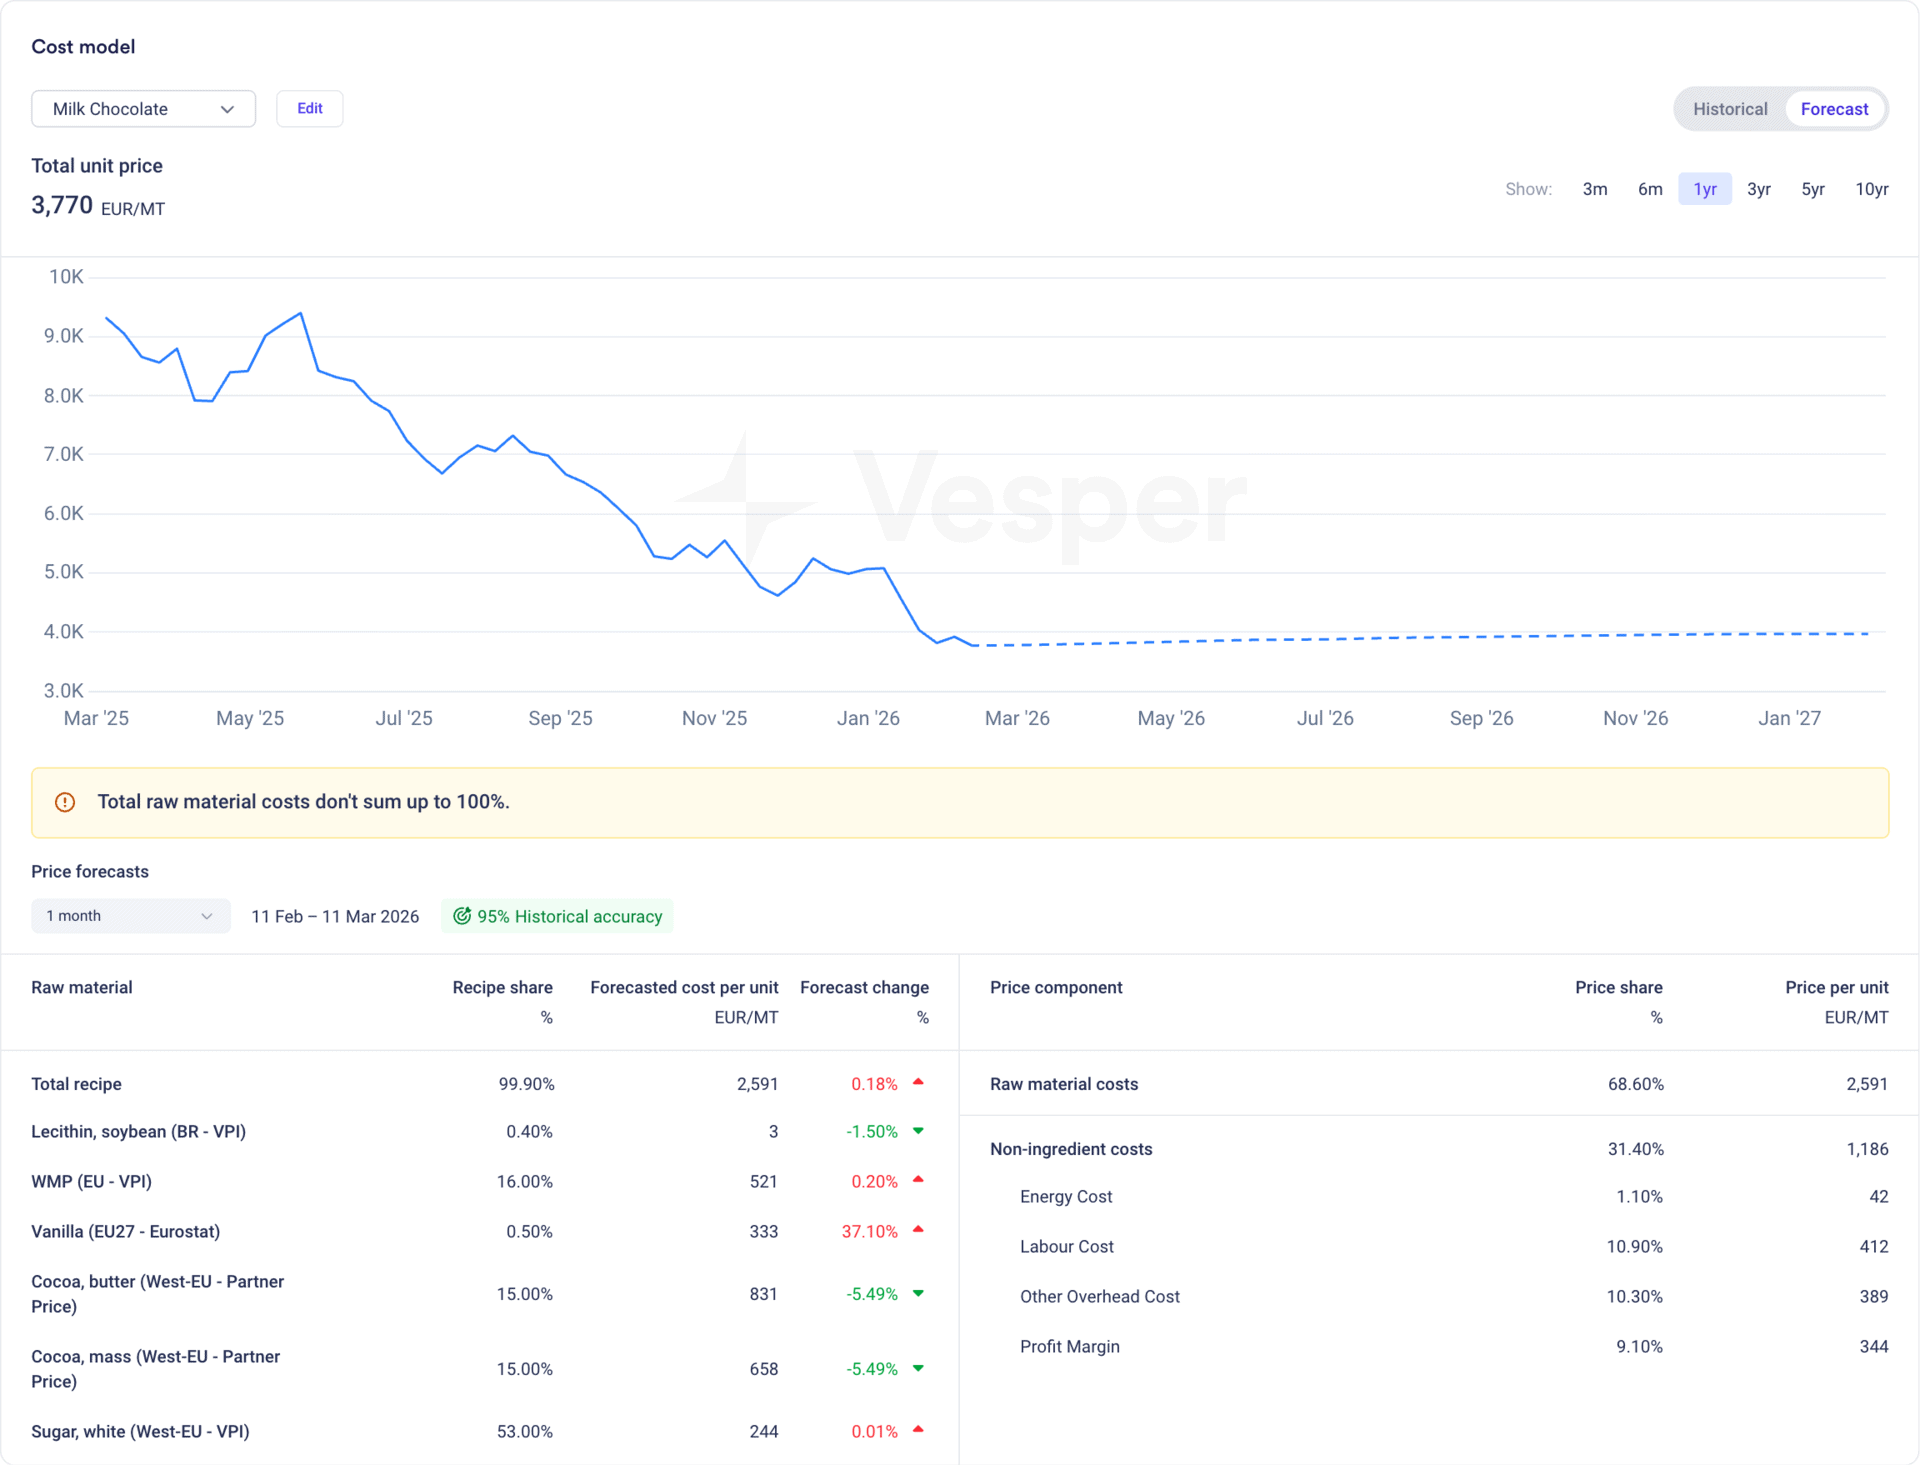
The vanilla forecast deserves attention. A 37% increase in an ingredient that represents 0.5% of your recipe still impacts your bottom line, and if you’re working on thin margins, every percentage point matters.
The cocoa forecasts show continued softening, reflecting broader market sentiment. With improved supply conditions in West Africa, positive weather developments, and weak grinding numbers (European Q4 2025 grindings fell 8.3%), the market expects cocoa to remain under pressure in the near term.
Scenario planning: testing cost-saving formulations and alternative origins
Here’s where cost modeling becomes truly powerful for procurement decisions: comparing different recipe formulations and sourcing strategies side-by-side.
Reformulation Strategy
Let’s say you’re considering a reformulation to reduce costs. You adjust your milk chocolate recipe:
- Increase sugar slightly (from 53% to 57.2%)
- Reduce cocoa butter (from 15% to 13%)
- Reduce cocoa mass (from 15% to 14%)
- Slightly increase WMP and lecithin for texture
The result? A “cost-saving” version at €3,302/MT—saving you €468/MT (12.4% reduction).
Using Vesper’s Price Comparison widget, you can visualize both formulations over time. The blue line (cost-saving version) consistently tracks below the green line (original recipe), showing you not just today’s savings but how that gap has evolved over the past year.
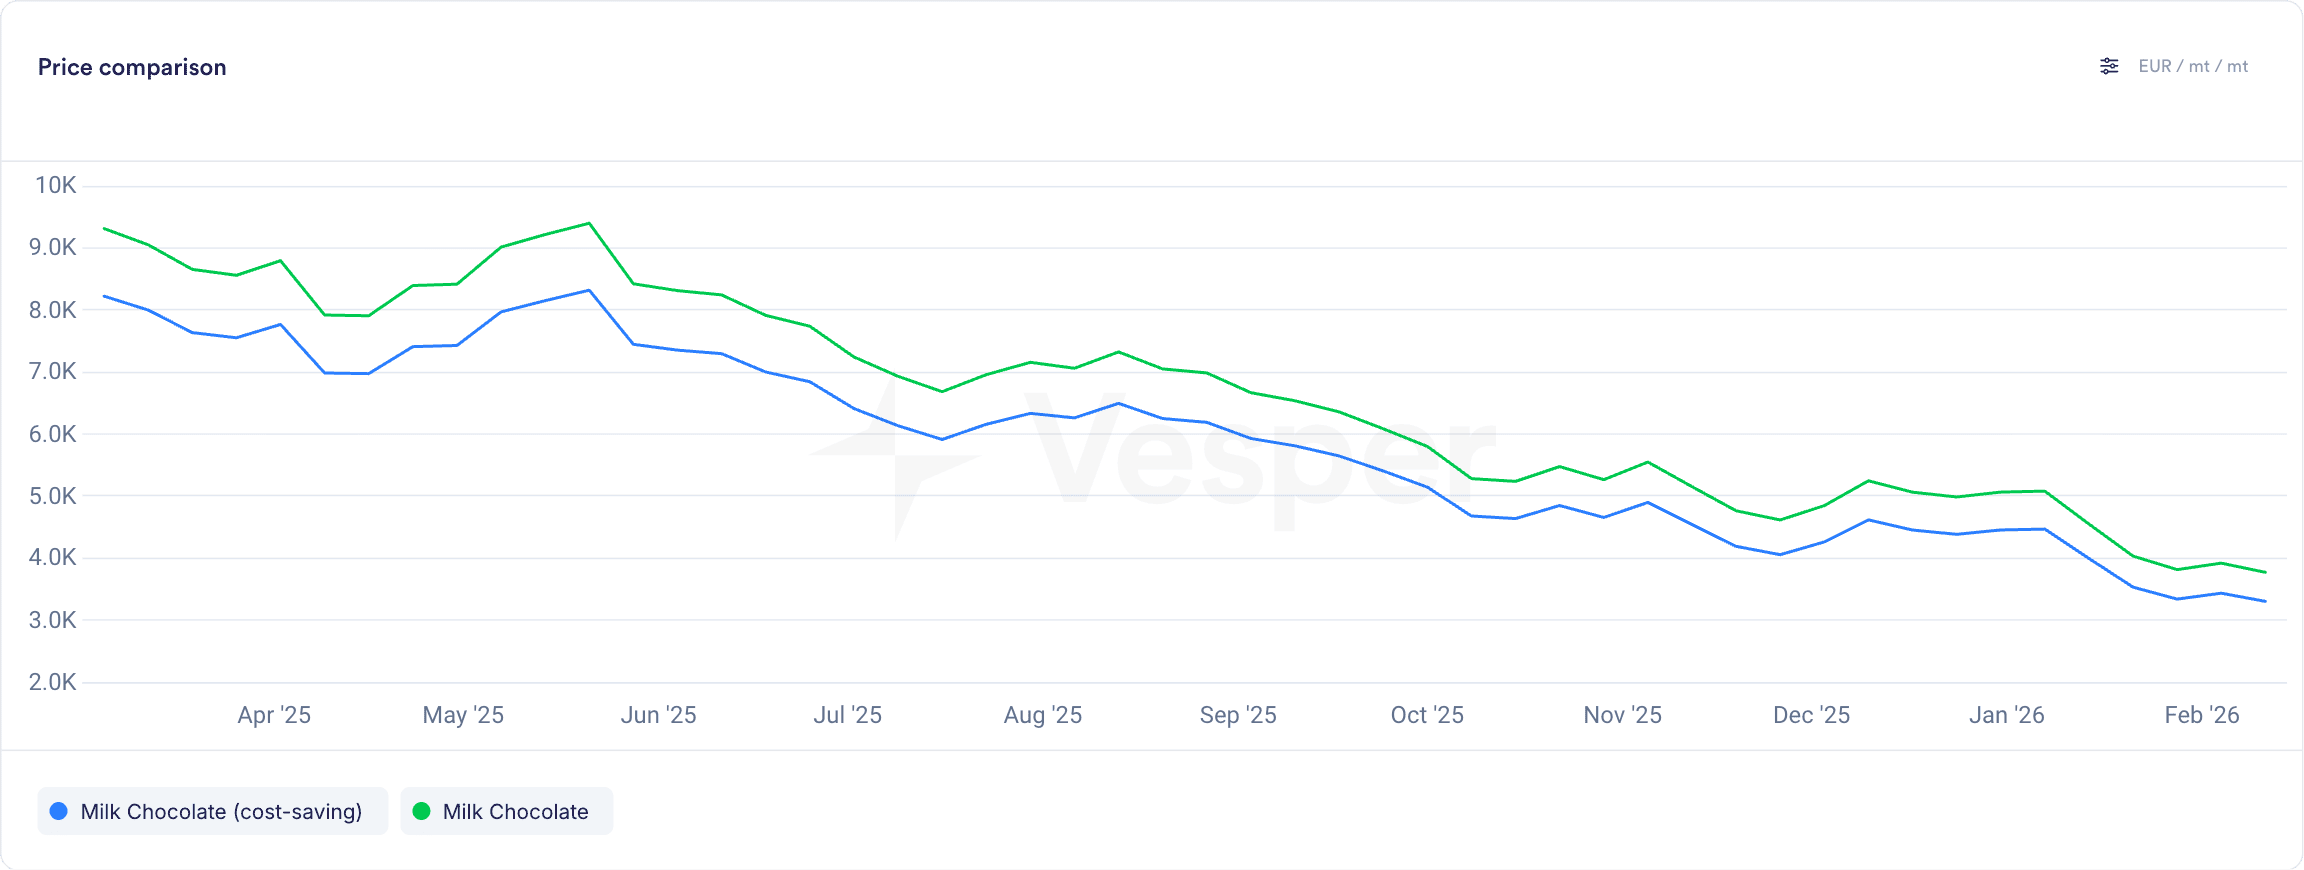
During the cocoa price spike in mid-2024 when futures hit historic highs, that gap was even wider, the cost-saving formulation would have saved manufacturers significantly more during the crisis period. Now, with cocoa prices down 65% from those peaks, the absolute savings are smaller, but the percentage advantage remains.
This isn’t theoretical. Major manufacturers have already acted. According to market reports from early 2026, companies like Nestlé and Pladis have reformulated products to the point where they’ve had to strip chocolate labels from some UK products as reformulations breach legal thresholds for chocolate content.
This is exactly what procurement managers use cost models to answer:
- “Should we reformulate now that cocoa prices have stabilized lower?”
- “What if prices spike again, how much would we save with a lower-cocoa recipe?”
- “Can we lock in current ingredient prices for 12 months, or should we wait?”
- “Which formulation protects us best against future volatility?”
Alternative sourcing origins
But reformulation isn’t your only lever. You can also test different sourcing origins to find optimal cost structures.
For example, instead of using European white sugar at €460/MT, you could evaluate Sugar No. 11 (US raw sugar) using the Import Parity Price, currently at €555/MT. Within Vesper’s cost model interface, you can easily switch between different price sources in the database, simply search for the ingredient and select an alternative origin or price benchmark.
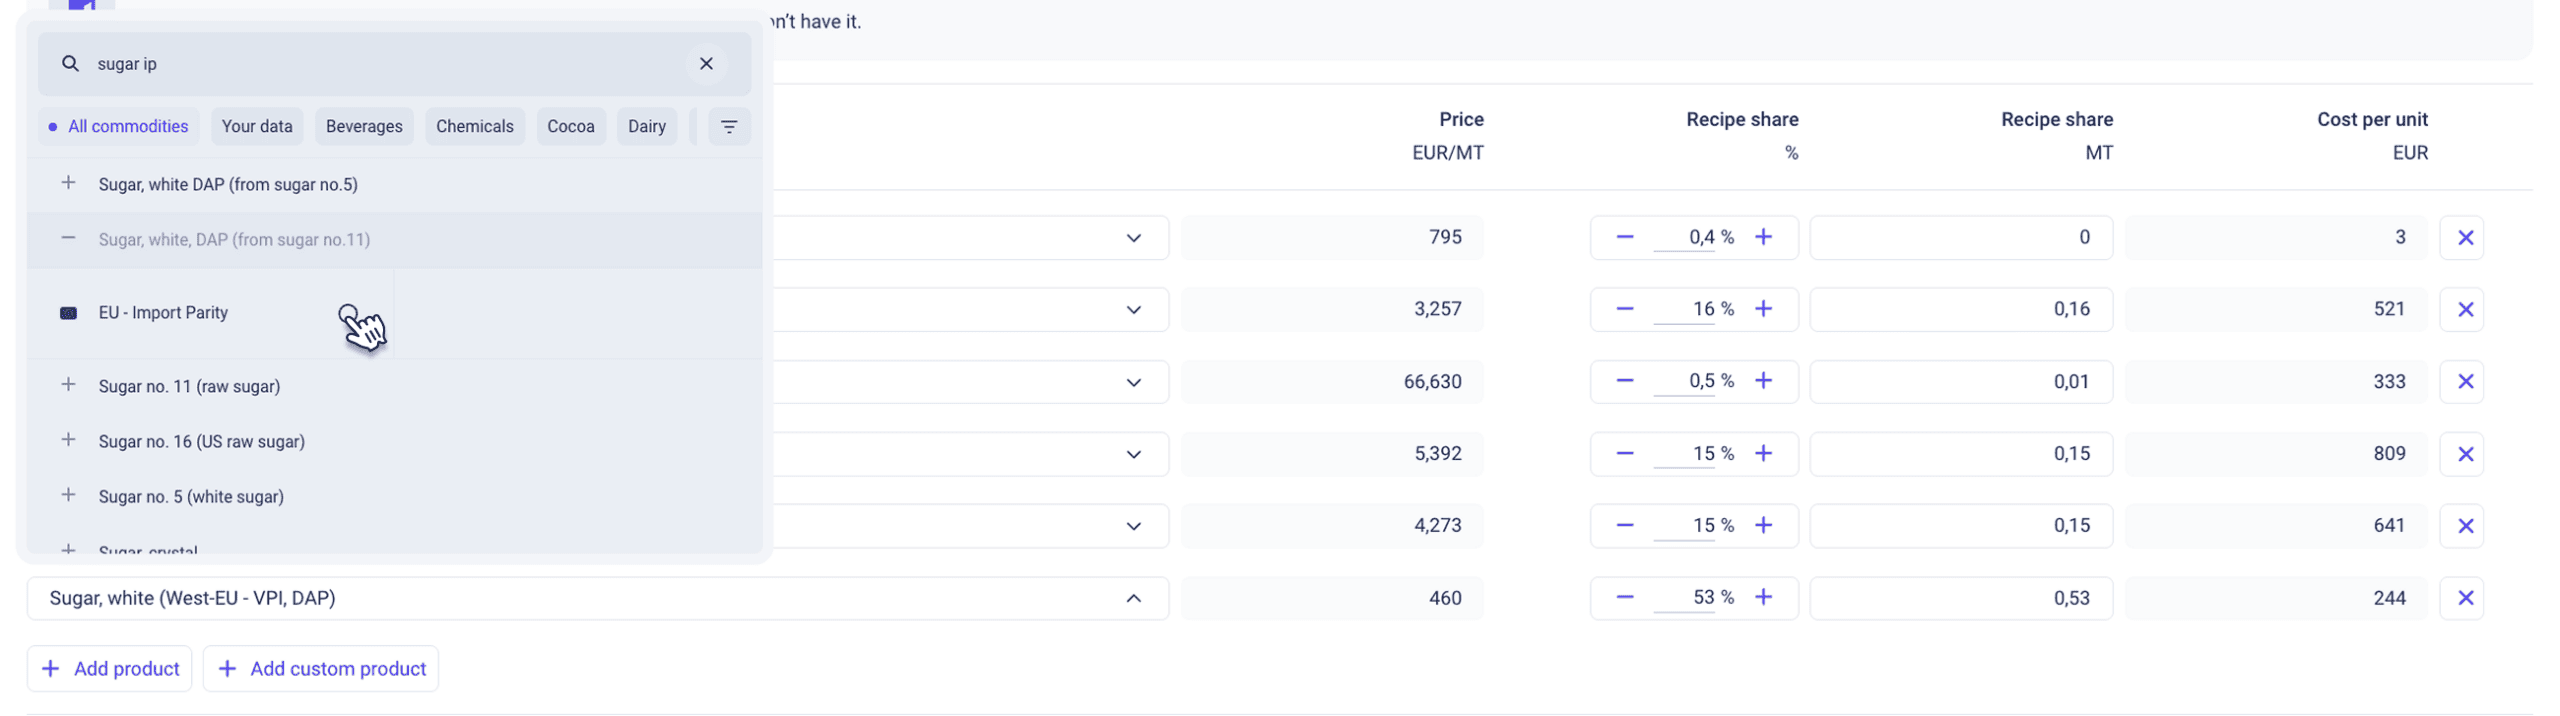
In this case, the import parity price for Sugar No. 11 is actually €95/MT higher than European white sugar, not a cost-saving move. The model shows you immediately that at current prices, European white sugar is the more competitive option.
However, market dynamics change. If European white sugar prices spike due to regional supply issues, or if US raw sugar prices fall, that calculation reverses. By having both options saved in your cost models, you can monitor which sourcing strategy makes economic sense at any given time.
If your sourcing strategy includes specific shipping costs or logistics premiums, you can add these as custom line items to your model to see the complete landed cost comparison.
Using Vesper’s Price Comparison widget, you can visualize different formulations and sourcing scenarios over time. The cost-saving formulation consistently tracks below the original recipe, showing you not just today’s savings but how that gap has evolved over the past year.
During the cocoa price spike in mid-2024 when futures hit historic highs, alternative sourcing strategies and reformulations would have saved manufacturers significantly more during the crisis period. Now, with cocoa prices down 65% from those peaks, the absolute savings are smaller, but the strategic flexibility remains valuable.
This isn’t theoretical. Major manufacturers have already acted. According to market reports from early 2026, companies like Nestlé and Pladis have reformulated products to the point where they’ve had to strip chocolate labels from some UK products as reformulations breach legal thresholds for chocolate content.
This is exactly what procurement managers use cost models to answer:
- “Should we reformulate now that cocoa prices have stabilized lower?”
- “What if we sourced raw sugar from the US instead of refined sugar from Europe, would that actually save us money?”
- “What if prices spike again, how much would we save with a lower-cocoa recipe?”
- “Can we lock in current ingredient prices for 12 months, or should we wait?”
- “Which combination of formulation and sourcing origin protects us best against future volatility?”
Using your own contracted prices
Market benchmarks are valuable, but what about your actual contracted prices?
Vesper’s “Your Data” feature lets you upload your negotiated prices (via CSV or Excel) and plug them directly into cost models. This way, you’re not modeling with averaged/mode benchmarks, you’re modeling with your real supplier relationships.
Why this matters:
- Validate whether your negotiated prices actually beats the market
- Track how your contracts perform against broader commodity movements
- Identify which ingredients you’re overpaying for relative to available benchmarks
- See if you locked in high prices that you should renegotiate
For example, if you locked in cocoa butter contracts in early 2024 at €5,500/MT when the market was peaking, and current spot prices are now €879/MT, your cost model will show exactly how much that legacy contract is costing you versus current market rates. This gives you concrete data to bring to your next supplier negotiation.
Your data stays private to your organization and never gets shared. You maintain complete control over what you upload and who can see it.
Building your first chocolate bar cost model
Ready to start? You have two options:
Use a template: Navigate to the cost model widget, select the “Milk Chocolate” template from “Vesper Models,” duplicate it, and customize as needed.
Build from scratch: Click “Create New,” add your ingredients from Vesper’s price database, select your region and industry for non-ingredient costs, and save. The system automatically calculates your total unit price and tracks it over time.
Learn more about building your first cost model here.
Sharing models across your yeam
Procurement decisions rarely happen in isolation. With Vesper’s model sharing option, you can share cost models with your entire company or with specific colleagues who need access.
When you share a model, recipients can view it, duplicate it, and adapt it for their own use, ensuring everyone works from the same baseline assumptions while maintaining the flexibility to test their own scenarios.
Your R&D team can duplicate your master model to test alternative recipes, your procurement team can validate costs against actual contracts, and your finance team can create their own versions to model margin scenarios, all starting from the same foundation data.
Think of it as “sending a copy” rather than live co-editing like Google Docs. One person builds the master model, then shares it so others can use and adapt it for their specific needs without overwriting the original.
What this means for your next negotiation
When you sit down with suppliers in 2026, you need more than gut feelings about where prices should be. You need data that reflects current market realities.
Cost models give you:
- Precise baseline costs for every ingredient in your recipe
- Non-ingredient benchmarks that prevent suppliers from inflating “manufacturing complexity”
- Historical context showing how costs moved through the 2024 crisis and 2025-2026 correction
- Forward projections to evaluate whether long-term contracts make sense given continued market uncertainty
- Alternative formulation costs to negotiate from a position of flexibility
Instead of accepting a supplier’s quote at face value, you walk in knowing:
- “Based on current cocoa butter benchmarks at €879/MT, your quote of €950/MT is 8% above market”
- “If we adjusted our recipe to reduce cocoa butter by 2 percentage points, we’d save €468/MT, is that feasible while maintaining quality?”
- “Cocoa prices have fallen 65% from 2024 peaks but are forecasted to soften another 5% over the next three months. Given this outlook and improved supply conditions in West Africa, we want to discuss pricing that reflects current market realities, not legacy contracts from the crisis period.”
- “Our cost model shows that even with cocoa prices down dramatically, WMP increases are offsetting 40% of those savings. Let’s talk about our full basket of ingredients.”
This is the difference between reactive procurement and strategic sourcing, especially important now as markets stabilize after historic volatility.
The bottom line
A milk chocolate bar costs €3,770/MT to produce today, down significantly from peak crisis levels, but still elevated compared to pre-2024 historical averages. That number tells you almost nothing without understanding:
- Which 68.6% is raw materials (and how each ingredient behaves)
- What the remaining 31.4% in non-ingredient costs actually includes
- How your costs will likely move over the next 3-12 months
- What happens if you adjust your formulation
- Whether you’re still carrying high-priced contracts from the 2024 crisis
With complete cost models combining ingredient benchmarks, manufacturing overhead data from IBISWorld across Europe and North America, and AI-powered forecasting, you’re not just tracking chocolate prices, you’re managing your entire cost structure strategically through whatever volatility comes next.
Start building your first chocolate bar cost model in Vesper today and see exactly where your money goes.
Related Resources: