Historical Dried Fruits Data
The dried fruit market is a dynamic sector influenced by a wide range of factors, including supply and demand, climatic conditions, global trade policies, and consumer preferences. For businesses and stakeholders in the dried fruit industry, understanding historical data is crucial for making informed decisions and forecasting future trends. In this article, we will explore key historical price trends for various dried fruits. We’ll also answer some frequently asked questions about dried fruit pricing and trends.
Why is Historical Dried Fruits Data Important?
Historical data provides a comprehensive view of market behavior over time, highlighting patterns, seasonality, and the impact of external factors such as weather events or economic changes. This information is essential for several key personas in the industry:
Strategic Planning
For procurement managers at food manufacturers and retailers, historical data helps anticipate future trends and plan their purchasing strategies. For instance, a procurement manager might use this data to time bulk purchases of dried fruits, such as raisins or apricots, during periods when prices are historically lower, thereby optimizing inventory costs. Similarly, a retailer can plan promotions or stock up on inventory before anticipated price hikes, maintaining a competitive edge.
Price Forecasting
Exporters and importers of dried fruits use historical data to forecast future price movements. By analyzing past trends, they can predict periods of high demand or low supply, allowing them to adjust their buying or selling strategies accordingly. For example, an exporter might choose to ship products just before a predicted price spike to maximize profits, while an importer might stock up before prices rise to offer competitive pricing to customers.
Risk Management
For farmers and agricultural cooperatives, as well as financial analysts and investors, historical data is crucial for risk management. Farmers can analyze historical trends to decide the best time to harvest or sell their products, avoiding periods of low prices and capitalizing on peak periods. Financial analysts and investors use this data to assess risks related to price volatility and to make strategic decisions about futures contracts or commodity investments.
Key Historical Price Trends of Various Dried Fruits
Understanding historical price trends in the dried fruit market is crucial for anticipating future market behavior and making strategic business decisions. Here’s a concise overview of the price trends for dried apricots, dried figs, and raisins, reflecting the impact of weather events, demand fluctuations, and market conditions.
Dried Apricots
Prices have historically been volatile, with significant spikes following adverse weather events in Turkey, the primary production region. In the early 2000s, prices were relatively stable but started rising sharply around 2007 due to frost and hail damage. This trend continued, with another peak in 2014 caused by severe frost, driving prices up due to a supply shortage. After a period of stabilization, prices rose again in 2019 following droughts. Recent trends show an increase, with prices reaching around $5,669 per ton in the U.S. by August 2023, driven by ongoing supply challenges and increased raw material costs due to adverse weather and farmer stockholding practices.
Dried Figs
Prices for dried figs have remained relatively stable with gradual increases, largely due to steady demand in health-conscious markets. While the early 2000s saw minor price fluctuations, a notable increase occurred around 2010 due to higher demand and reduced supply from poor harvests in Turkey. From 2016 onwards, prices showed a slight upward trend, influenced by consistent global demand and occasional production issues. The fig market has experienced fewer dramatic fluctuations compared to apricots or raisins, as production has been more stable, and demand has remained consistent.
Raisins (Dried Grapes)
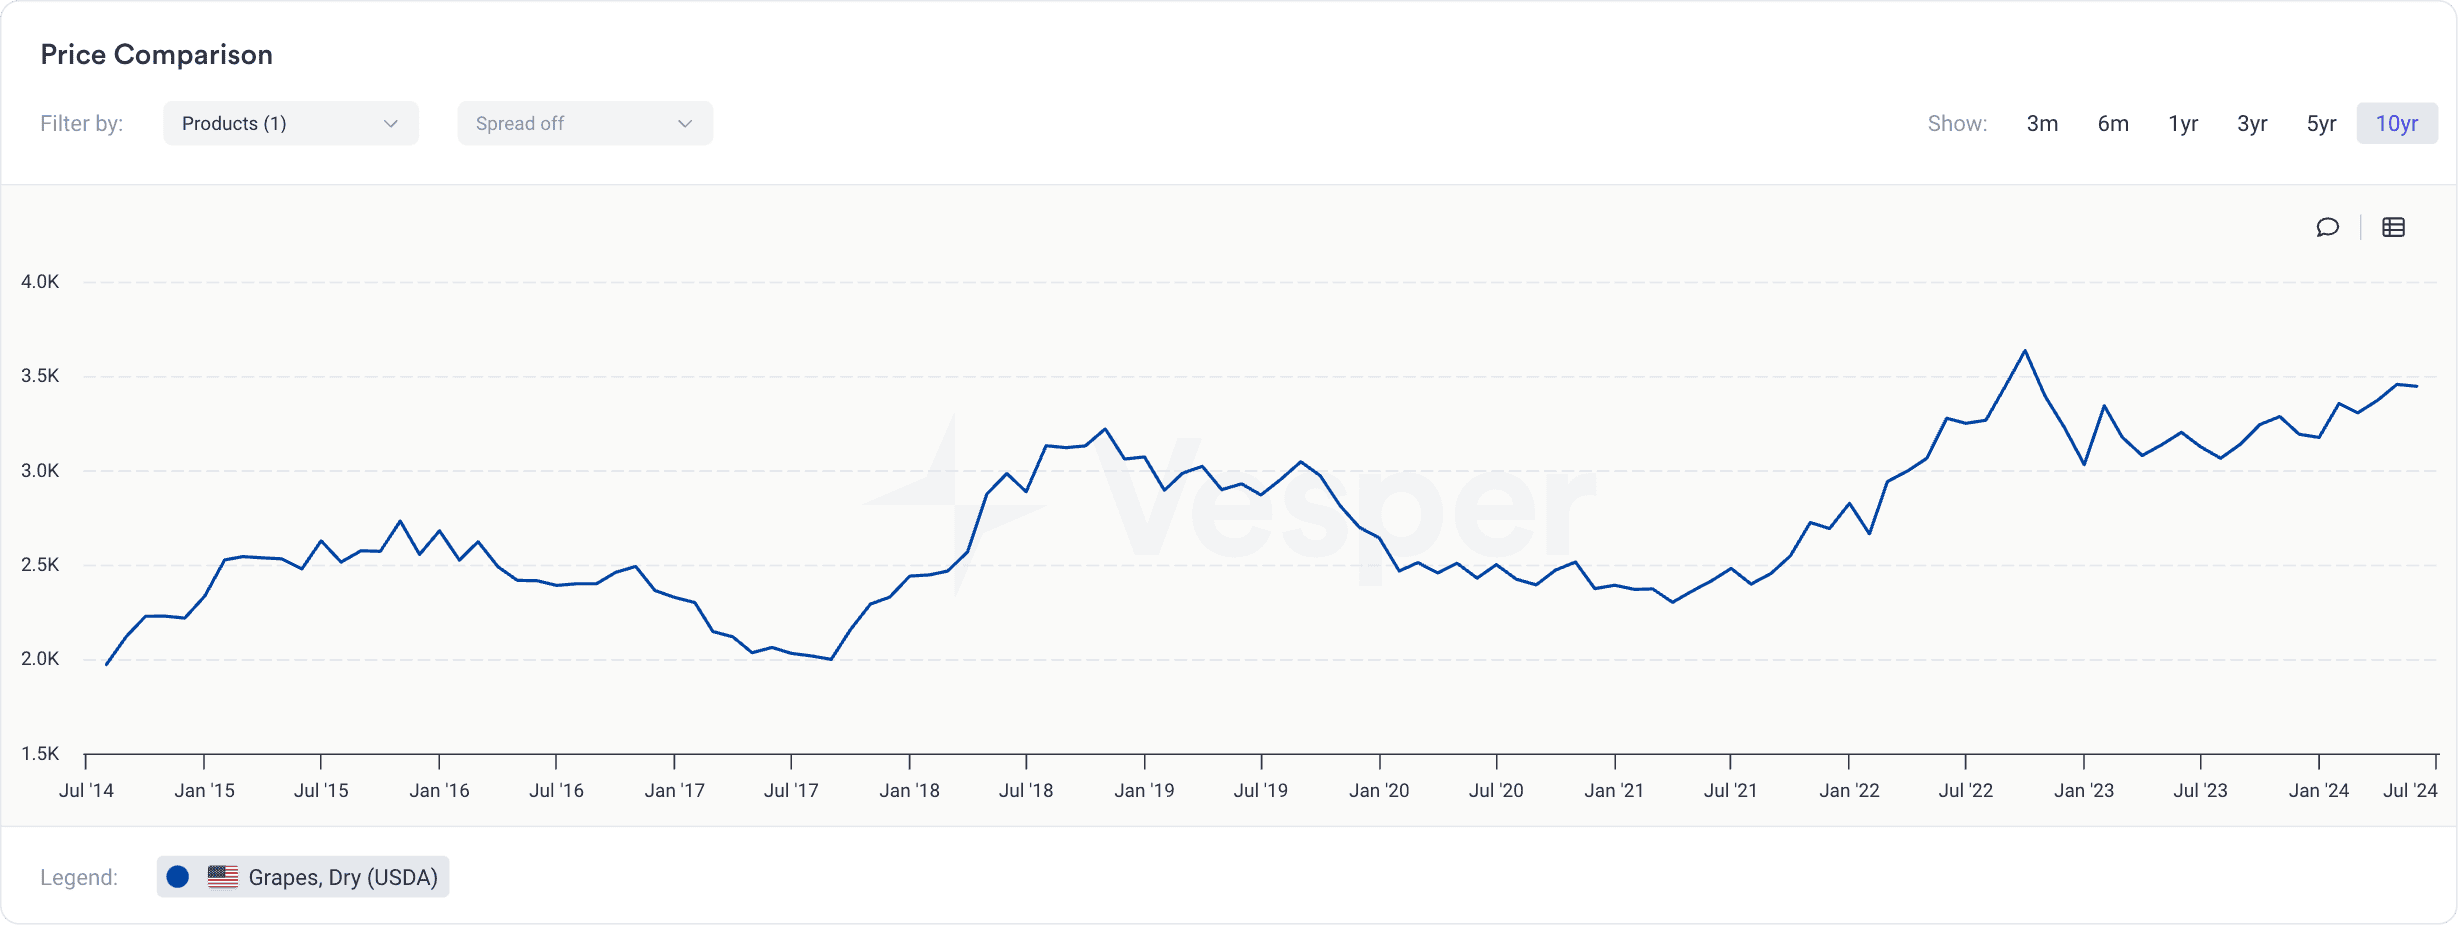
Raisin prices have been highly volatile, driven by changes in supply conditions and global demand. Prices increased from $2,000 per metric ton in 2014 to around $2,800 by mid-2015 due to reduced supply from key regions like California, see historical data from Vesper below. The market saw another significant increase in 2018, with prices reaching nearly $3,200 per metric ton, influenced by poor weather conditions. From 2019, prices dipped due to improved supply but rose again post-2021, reaching about $3,700 per metric ton by mid-2024, reflecting increased global demand and supply constraints.
By examining these trends, stakeholders can better understand market dynamics and optimize their strategies accordingly. Platforms like Vesper and reports from industry experts offer valuable insights into these historical patterns and future forecasts.
How Can Businesses Use Dried Fruits Historical Data to Their Advantage? An Example with Grapes, Dry (USDA)
Historical data on dried fruit prices is an invaluable tool for businesses involved in production, trading, or retail. By analyzing this data, businesses can gain insights into seasonal variations, price cycles, and market dynamics, allowing them to make more informed decisions. Here’s how businesses can use historical data to their advantage, using the attached image above of Grapes, Dry (USDA) as an example:
1. Forecasting Future Price Trends
Historical data provides a foundation for predicting future price movements by identifying patterns and cycles. In the attached chart for Grapes, Dry (USDA), we observe clear price cycles roughly every three years. For example, there is a noticeable rise from early 2015 to mid-2016, followed by a decline until early 2017. A similar pattern occurs from late 2017 to mid-2018, with prices rising again. By recognizing these cyclical patterns, businesses can forecast when prices might rise or fall in the future, allowing them to plan their purchasing and inventory strategies accordingly.
2. Planning Inventory Purchases
By understanding historical price trends, businesses can optimize their inventory purchases. The chart shows seasonal variations with prices peaking and dipping in three-year cycles. A business, such as a wholesaler or retailer, might choose to purchase larger quantities of dried grapes when prices are at a lower point in the cycle, such as during the dips in 2017 and 2020. This strategy allows them to reduce costs and maintain a more stable profit margin when prices increase, as seen in 2018 and 2023.
3. Negotiating Better Contracts with Suppliers
Historical data helps businesses negotiate better contracts with suppliers by providing a clearer picture of market trends. If a supplier knows that prices have historically increased during certain periods, a buyer armed with this data can negotiate a fixed-price contract or bulk purchase agreement ahead of a predicted price increase. For example, in the attached chart, a business could negotiate in 2021 for better terms, anticipating a price rise in 2022 based on the observed three-year cycle.
4. Developing Pricing Strategies
For businesses that sell dried fruits directly to consumers, such as grocery stores or online retailers, historical data can inform pricing strategies. Understanding when prices are likely to rise or fall allows these businesses to adjust their retail prices to match market conditions. In the case of dried grapes, if a retailer sees that prices have consistently risen every three years, they might increase their retail prices slightly ahead of the next anticipated peak, ensuring they maintain their margins without a sudden shock to their customers.
5. Identifying Cyclical Patterns and Potential Disruptions
The chart also highlights how external factors, such as weather events or economic disruptions, can cause sudden price changes. For instance, there is a noticeable dip in prices during 2020, which could be attributed to reduced demand or supply chain disruptions caused by the COVID-19 pandemic. Recognizing these disruptions allows businesses to be proactive rather than reactive, adjusting their operations to mitigate risks.
Conclusion
Understanding historical dried fruits data is crucial for navigating the complexities of the market. By analyzing past price trends and identifying the factors driving these changes, businesses can make more strategic decisions and stay competitive in an ever-evolving industry. Platforms like Vesper provide valuable insights and data to help businesses monitor these trends and adapt accordingly. Explore Vesper today to stay ahead in the dried fruit market.
Related Content
Quickly navigate this page
Was this information useful?
Share: