US dairy used to be a domestic-first industry where most of what American farmers produced was consumed at home and exports were secondary. In 2025, that changed. Cheese exports surged 13.64%, adding 92 million pounds over the prior year, butterfat exports hit all-time highs in November and December with annual shipments up 166%, and May 2025 set a record month for US cheese exports. As the US Weekly observed, “export strategy shifted from ‘nice to have’ to ‘necessary’” once production outpaced domestic demand.
The shift wasn’t a strategic choice. It was forced by a production surplus that domestic consumption couldn’t absorb. US milk production grew 2.49% in 2025 as the herd expanded to its largest since the early 1990s, with milkfat production outpacing fluid milk growth by nearly two percentage points at +4.33% year-to-date through November. Americans ate more butter, more cheese, and more yogurt than ever, but consumption didn’t grow at the rate production did, and the gap had to go somewhere. Cold storage absorbs some of a surplus, but storage costs money and capacity is finite. The real outlet is exports.
Each product found its own export path with its own vulnerabilities. Cheese rode a weak dollar and cheap pricing into record international volumes. Butter became an accidental exporter when US prices fell to the lowest in the world. NFDM was already 80% export-dependent and felt the pain first when tariffs hit. And dry whey had its entire export picture centered on one country, China, which made it the most exposed when trade policy shifted. Currency swings, tariff escalations, and aggressive global competition from Europe, New Zealand, and even China itself all tested how durable these new trade flows really were.
How each product found its export path
The export dependency story played out differently for each product, with different drivers, different vulnerabilities, and different levels of exposure.
Cheese went from domestic staple to global competitor in a single year. New production capacity came online as mozzarella plants ramped up and cheddar facilities expanded, pushing total output to record levels in multiple months while domestic demand couldn’t absorb all of it. US cheddar prices significantly undercut European competitors, and a weak US dollar made the price advantage even larger, so international buyers who had been sourcing from Europe found American cheese cheaper and readily available. By year-end, total cheese exports were up 13.64% with 92 million additional pounds shipped, cheddar exports alone surged 143% in July, and new markets diversified the buyer base: Mexico remained dominant at nearly 40%, but Japan overtook several other destinations, South Korea showed fresh cheese imports up 51% year-to-date, and Malaysia saw US cheese exports jump 245% after a new trade agreement. The diversification looked like strength, but it was also a dependency in formation.
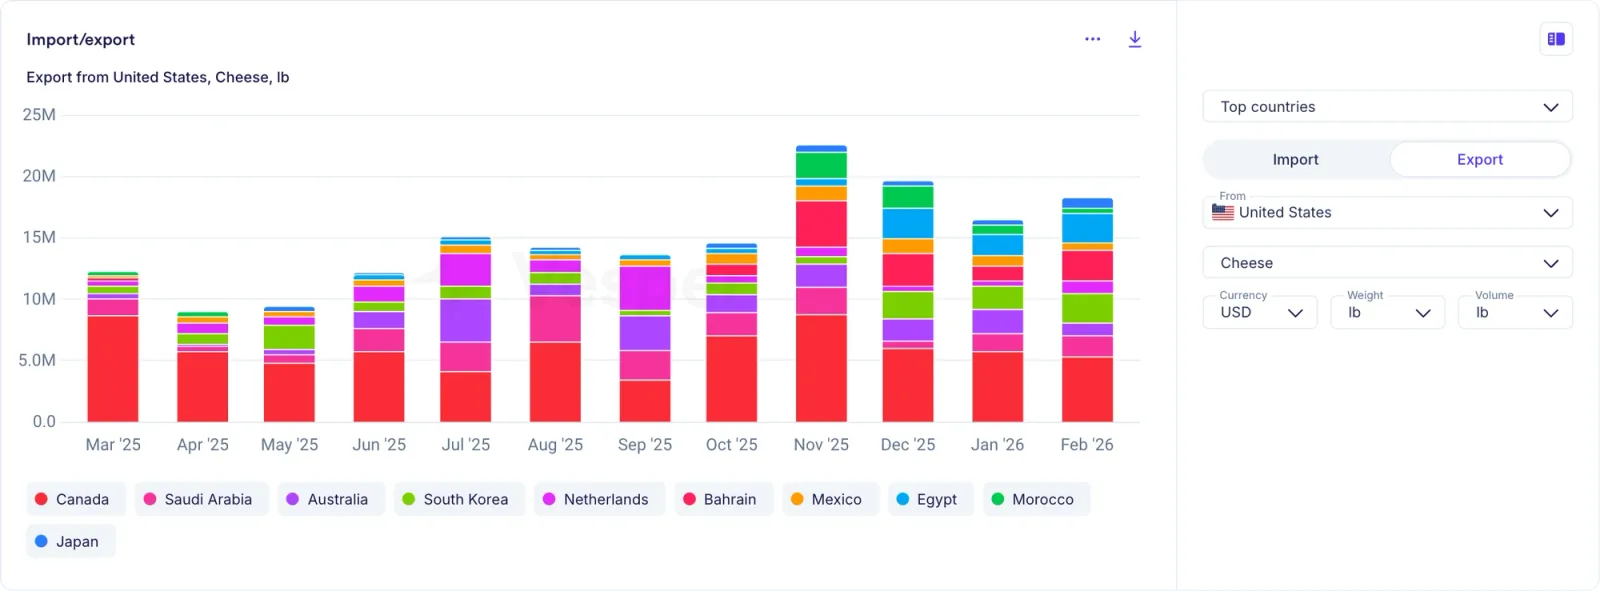
US Cheese exports in lb (top 10 countries)
Butter became the accidental exporter. The US had historically been a net butter importer, and American butter wasn’t on the global radar because the product was the “wrong color” and didn’t suit international tastes. Then US prices fell far enough that none of that mattered, and US butter became not just competitive but the cheapest in the world, and butterfat exports hit all-time highs in both November and December with annual shipments jumping 166%. New markets appeared from nowhere: Saudi Arabia became the number two buyer by value (up over 5,400%), the Netherlands showed up at nearly 399,000% growth from a near-zero base, and Bahrain was up 1,788%. The export channel absorbed 25 million more pounds of butter in January through May alone compared to the prior year, more than accounting for the stock deficit that later shocked the market. The problem is that these new buyers found US butter on price and will leave on price.
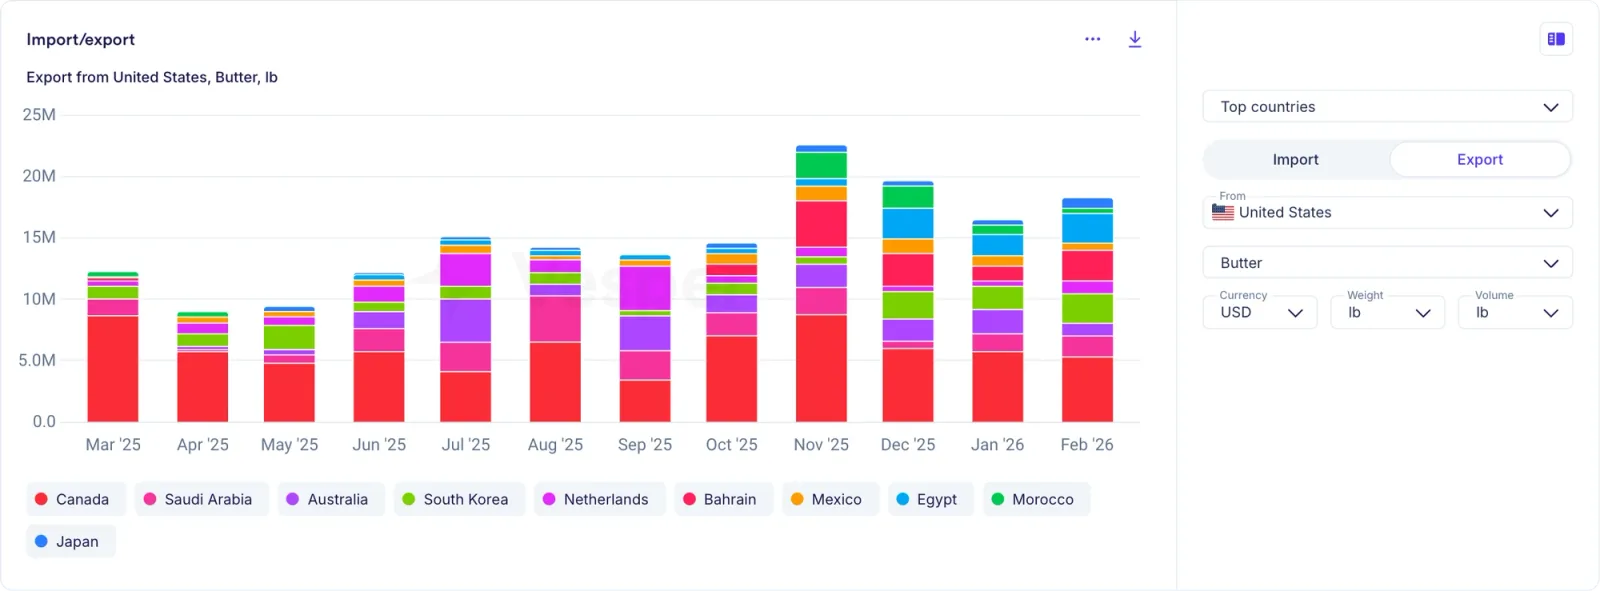
US Butter exports in lb (top 10 countries)
NFDM was already the most export-dependent product in US dairy, with up to 80% of production exported, making it the most vulnerable to trade disruption. Mexico was the largest buyer, China had been significant, and Southeast Asian markets absorbed steady volumes, but in 2025 every one of those relationships came under pressure as tariffs on China made US NFDM uncompetitive there, global oversupply from Europe and New Zealand undercut US pricing everywhere else, and the strong dollar made it worse. Exports to Southeast Asia fell 25-30% year-over-year, exports to China effectively stopped, and by year-end the US was losing market share in almost every non-Mexican destination while NZ expanded its China exports by 11.39% and EU exports to Southeast Asia climbed 33.83%.
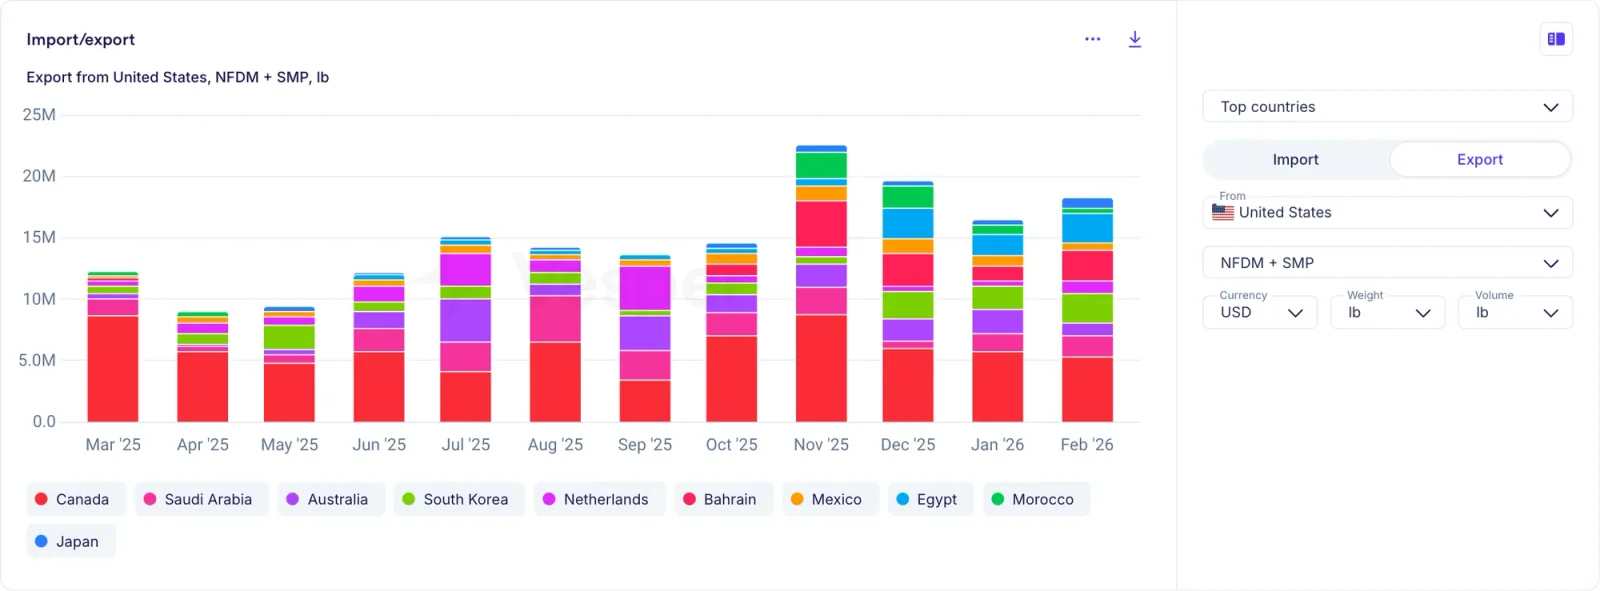
US NFDM + SMP exports in lb (top 10 countries)
Dry whey had its export picture centered on one country: China, which consumes roughly 150 million pounds of the 400 million pounds of US dry whey exports annually and took 45% of China’s dry whey imports from the US. When China’s broader tariff escalation reached 84% on US products, exports plummeted 30% month-over-month. New trade lanes formed in Southeast Asia and Latin America, but as the US Weekly reported, those volumes “weren’t sufficient” to fill the China gap. Of the top 10 US whey export destinations, 7 had received tariff threat letters from the US government, meaning the trade relationships underpinning whey exports were under threat from multiple directions simultaneously.
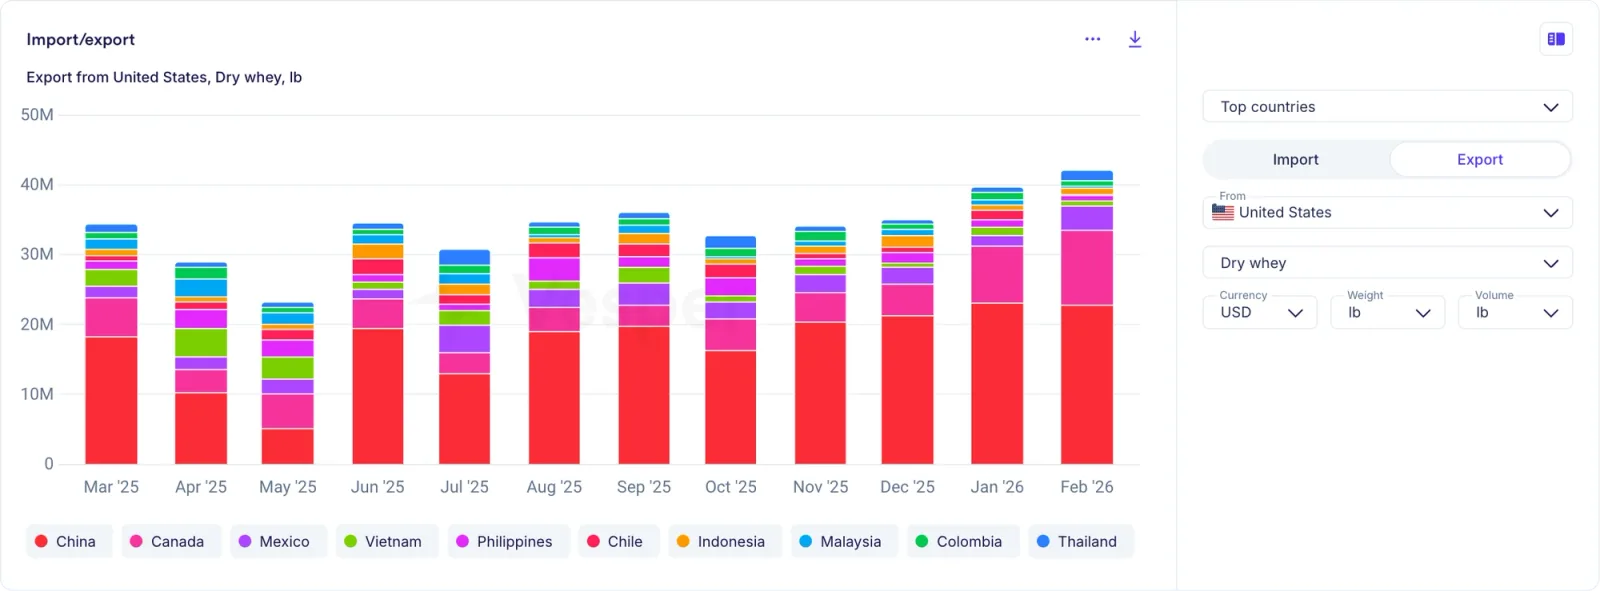
US Dry whey exports in lb (top 10 countries)
Currency: the force that reshapes everything
The US Weekly repeatedly highlighted how currency dynamics shaped export competitiveness throughout 2025 and into 2026, with the EUR/USD rate moving 14.5% over the period from mid-2025 to early 2026, a swing large enough to change who can sell where.
When the dollar weakened through late 2025, US dairy exports grew as American products became cheaper for foreign buyers, with cheese exports hitting records and butter finding new markets. When the dollar strengthened in early 2026, the US Weekly noted that “the more expensive Dollar does make things more complicated” for US exporters, as European and NZ products became more price-competitive. As the US Weekly put it: “If your market is driven by favourable currency exchange rates and the progress of trade talks, you are in for a bumpy ride.”
What happened when channels faced pressure
2025 showed what the data looks like when trade relationships come under strain, and the pattern was consistent: vulnerability scales with export dependency.
For NFDM, tariffs with China effectively removed the second-largest export destination, and the US Weekly noted that prices fell even as production declined because “buyers had alternatives and tariffs made the US alternative expensive.” For cheese, European competition intensified through the second half, with the US Weekly reporting by November that “European pricing was eroding the US competitive edge,” and while volumes stayed high, revenue per pound dropped as European prices came in $500/mt cheaper. For butter, the export surge was built entirely on being the lowest-cost option, making those trade flows sensitive to any shift in relative positioning. For dry whey, the tariff disruption with China was partially offset but not replaced.
The competitive landscape made these pressures harder to manage. EU cheese production was ramping, NZ was competitive across SMP and WMP, and the EU signed trade deals with Indonesia, India, and Mercosur, expanding preferential market access to destinations where US dairy had been gaining ground. Germany overtook the US as China’s top higher-protein supplier with WPC80+ imports to China up 209% year-to-date through mid-2025. And China was evolving from importer to exporter, with Chinese WMP exports surging 200% year-over-year, SMP exports up 743%, all sold at 40% below world market prices and backed by government support and state export subsidies.
What this means for procurement teams
The growing role of exports in US dairy has several implications for domestic buyers.
Global prices increasingly influence domestic prices. The US Weekly noted that “the connection between prices from Europe, New Zealand, and the United States is higher when the export dependence is higher,” and as more US dairy goes overseas, domestic pricing tracks global benchmarks more closely.
Currency swings matter. The 14.5% EUR/USD move through the period reshaped competitive positioning for every globally traded dairy product, something the US Weekly highlighted repeatedly as a factor in export competitiveness.
Trade policy creates uncertainty. The US had tariff threat letters out to 7 of the top 10 whey export destinations simultaneously, and the US Weekly noted that “the possibility of 8 out of 10 biggest buyers shifting demand elsewhere creates a completely different market.”
Export exposure varies by product. NFDM (up to 80% exported) is far more exposed to trade disruption than butter (historically net-imported), with cheese sitting in the middle. Understanding which ingredients come from heavily exported categories helps assess supply risk.
Export growth affects domestic availability. The 166% surge in butterfat exports and the 92 million extra pounds of cheese shipped overseas are volumes that didn’t stay domestic, and the -17% butter stock deficit occurred alongside record exports.
What’s next for US dairy exports?
The US dairy export picture moves fast. Every week, new trade data, tariff developments, and currency moves reshape the competitive landscape.
Our US Weekly covers all of it: exports, cheese, butter, whey, NFDM, milk production, and the global forces pulling US dairy prices in every direction. Written by Vesper’s dairy team, delivered to your inbox every Friday.