If you bought US butter at the start of 2025, you paid around $2.50 per pound. By December, that same butter cost $1.45.
That’s a 42% decline in 12 months. Not a blip. Not a correction. A full-blown repricing of one of America’s most familiar dairy commodities.
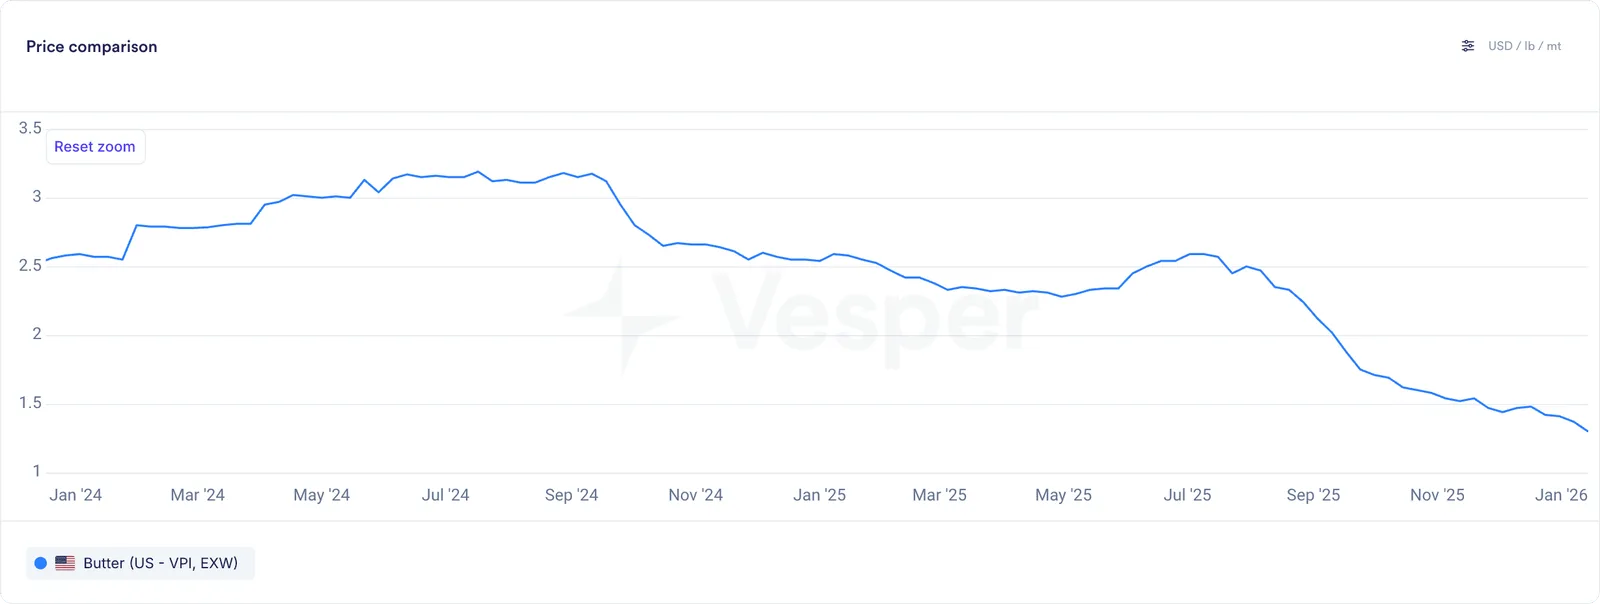
US Butter prices in USD/lb according to the Vesper Price Index
The story of how it happened is really the story of what happens when an entire industry produces more fat than anyone can eat.
January: Cheap cream sets the stage
The year started with a warning sign most buyers missed. Cream multiples in parts of the US dropped to 0.6, meaning cream was trading at a historic discount to butter. In states like Texas and Idaho, where milk production was surging, multiples hit 0.35 and 0.4, calculating back to cream prices as low as $0.94/lb.
For context, a cream multiple below 1.25 means butter churning is profitable. At 0.4, it’s practically free money.
Butter production in 2024 had already grown 5.52% year over year, with 2,232 million pounds produced. And the conditions that created that growth (bigger herds, higher fat content in milk, low feed costs) hadn’t changed. If anything, they were accelerating.
CME butter sat around $2.50/lb. But the clock was ticking.
February: The flush begins early
By February, cream prices were in freefall. Multiple reports confirmed cream at sub-$1.90/lb, with some transactions well below that. The spring milk flush was arriving early, and the fat content in American milk was historically high.
Butter prices on the CME began sliding. Down $0.08/lb in a single week in mid-January. Then another leg lower in February. Stock building was underway, but the sheer volume of cream overwhelmed the typical seasonal pattern.
The key insight: not all that cream was becoming butter. Ice cream, cream cheese, AMF, and other fat-based products were also running hard. But butter production growth of nearly 3% year over year in early 2025 was still substantial.
At $2.35/lb and falling, buyers started pulling back, waiting for lower prices. Which, of course, helped create them.
March: Tariffs add uncertainty, Production misses expectations
March brought two developments that would shape the rest of the year.
First, the 25% US tariffs on Canadian and Mexican imports took effect, triggering immediate retaliation. Canada imposed 25% tariffs on US goods. China added 10% on all dairy products. For butter specifically, the direct export impact was limited (the US was still a net importer), but the broader market anxiety dragged all CME prices lower.
Second, butter production numbers for January came in below expectations. Only +0.46% year over year. Given the ocean of cheap cream, the market expected more. This triggered a small rebound in prices.
But the rebound didn’t last. The fundamental story hadn’t changed: there was simply too much milk fat in the system.
April: “Liberation day” and the export question
April 2 brought worldwide US tariffs ranging from 10% to 50%. Financial markets cratered. Dairy markets held up relatively well, but the uncertainty added another layer of pressure.
For butter, the more important number was production. April figures showed butter up 3.86% year over year, with cheese production hitting record highs. Every available churning plant was running. And yet, cold storage numbers surprised to the downside: ending stocks didn’t grow as much as expected.
The reason? Exports. US butter had become so cheap relative to the rest of the world that international buyers were loading up. February exports had surged 124.88% year over year. Canada, Saudi Arabia, and even the Netherlands were buying American butter.
This became the defining dynamic of 2025: record production, partially offset by record exports.
May: Abundant supply, Falling milk prices
May confirmed the fears. Milk production grew 1.56% year over year nationally, with component-adjusted production up an astonishing 3%. The Southern states posted 7.5% growth. The dairy herd reached 9.425 million heads, the highest in two years.
Class III milk hit $17.45/cwt and Class IV hit $17.96. Both below $18 for the first time since October 2021. The revenue squeeze was real, but feed costs were low enough to keep margins positive and production humming.
Butter prices found temporary support around $2.50/lb after cold storage came in below expectations. But the writing was on the wall: the flush was delivering more fat than America could consume.
June: National dairy month, Nationally low prices
June’s production data told a stark story. Butter production hit 185.5 million pounds, and global buyers had “finally discovered US butter,” as one analyst put it. When the price discount gets large enough, taste and color differences become afterthoughts for industrial users.
But the most revealing number was whole milk powder. WMP production surged 36.19% year to date, a direct consequence of processors desperately trying to find outlets for all the extra fat. More WMP meant more competition on global markets, further depressing prices.
Cream prices ticked up briefly as temperatures rose, but the seasonal tightening was much milder than usual. Butter held around $2.50/lb, propped up by export demand rather than domestic fundamentals.
July: Heat, Then more supply
A nationwide heatwave in early July briefly tightened the cream market. Spot milk prices spiked. Cream multiples rose from 0.85 (flush levels) back toward 1.22. For a few weeks, fresh butter production became expensive again.
It didn’t last.
July butter production reached 180.1 million pounds, another new high. American cheese production grew 5.55% year over year. The new cheese plants were pumping, and every pound of cheese produced also generated liquid whey, which competed for processing capacity with butter.
Butter prices hovered around $2.50/lb, but the floor was softening. Exports through the first five months of the year had added 25 million pounds above the prior year. That was impressive, but not enough to offset the relentless growth in production.
August: The global butterfat market breaks
August was the turning point.
For months, US butter had found a safety valve in exports, particularly to Europe, where butter prices had remained elevated due to their own supply concerns. But in August, European and New Zealand butter production finally caught up with demand.
The “black hole” of European butterfat demand, which had been absorbing butter from the US and Oceania for over a year, reached saturation. European commodity butter buyers signaled they were covered for 2025. The door closed.
Without the export outlet, US butter stocks started building fast. Weekly cold storage volumes reported by Dairy Market News jumped 9% in the first 11 days of August alone. Cream prices fell to their lowest August level in four years.
CME butter dropped below $2/lb.
September: Through the floor
September was brutal. Butter broke through $2/lb and kept falling.
The math was unforgiving. August milk production grew 3.37% year over year. September jumped 3.99%, with the dairy herd at 9.52 million heads. Butter production grew 5.44% year to date. And now, with European prices collapsing simultaneously, US exports faced fierce competition on every trade lane.
Butter fell to $1.805/lb by mid-September. Then $1.62/lb by late September. For the first time since 2020-2021, cheese prices exceeded butter prices, an indicator of just how oversupplied the fat side of the dairy complex had become.
One analyst proposed culling part of the US dairy herd to rebalance supply. When farmers start discussing herd reduction as a market management tool, you know margins have gotten tight.
October: Government shutdown meets price discovery
October added an unusual wrinkle: a US government shutdown took the NASS reporting system offline. No production reports. No stock levels. No official trade data.
The market had to operate on educated guesswork. Vesper’s forecasting tools estimated August butter production at 172 million pounds (the actual number, released later, came in close). But the lack of data increased uncertainty in an already anxious market.
Butter bounced briefly to $1.80/lb on short covering after cold storage showed stocks hadn’t grown as much as feared. But the rally was short-lived. Global competition from Europe and an increasingly active New Zealand (entering their new milk season with strong volumes) kept pressure on.
By month’s end, butter settled lower again. Prices had no fundamental support.
November: The biggest herd since 1993
November data (released after the shutdown ended) confirmed the scale of the supply expansion. The US dairy herd hit 9.575 million cows, the largest since 1993. That’s 208,000 more cows than a year earlier.
Sarina Sharp of the Daily Dairy Report captured the problem: meaningful herd contraction typically requires at least six months of sustained losses. Most producers had only received their first disappointing milk check two weeks earlier. With cheap feed and high beef revenues cushioning the blow, Sharp noted that meaningful herd contraction would take at least six more months.
August butter production surged 8.1% year over year. The spread between CME spot butter ($1.45/lb) and consumer retail prices had grown to $2.77/lb, more than a dollar above normal. Consumers were still paying high prices at the store while the commodity market had already collapsed underneath them.
December: Where’s the bottom?
The year ended with butter at $1.45/lb, down 42% from January.
The Global Dairy Trade auction in early December hammered butterfat markets further: butter plunged 12.4% in a single event to $5,169/mt. AMF dropped 9.8%. The weakness was global, structural, and showed no signs of reversing.
Forward prices for Q1 2026 European butter traded below EUR 4,000/mt. US butter had no pre-Thanksgiving squeeze for the first time in years. Buyers were stocked, sellers had plenty of product, and the seasonal demand bump simply didn’t materialize.
For anyone buying, selling, or producing butter in 2025, the message was clear: the market had fundamentally repriced.
What drove the 2025 butter collapse?
Three forces combined to create the steepest annual decline in US butter prices in recent memory.
More fat than ever. US milk fat production grew 3.27% in H1 2025 alone, driven by bigger herds and record component levels. Butterfat hit a national average of 4.23% in 2024, and kept climbing. Every additional pound of fat needed an outlet.
Record exports bought time, then ran out. US butter and AMF exports through the first seven months of the year shattered records. Over 87 million pounds of butter and 47 million pounds of AMF were shipped. But when European markets saturated in August, the safety valve closed.
Global synchronization. For the first time in years, all major producing regions expanded simultaneously. The US, Europe, New Zealand, and South America all posted higher milk production in H2 2025. There was nowhere to redirect surplus, because everyone had surplus.
What’s next for US butter?
The US butter market moves fast. Every week, new production data, cold storage reports, trade flows, and price shifts reshape the picture.
Our US Weekly covers all of it: butter, cheese, whey, NFDM, milk production, tariffs, and the global forces pulling US dairy prices in every direction. Written by Vesper’s dairy team, delivered to your inbox every Friday.