In today’s complex energy landscape, understanding historical energy data is more critical than ever. This data provides a comprehensive view of past energy consumption, production, and pricing trends, helping businesses, policymakers, and investors make informed decisions. In this article, we will explore the importance of historical energy data, how it is used across different sectors, and real-life examples that highlight its value.
Historical energy data encompasses information on energy production, consumption, pricing, and market dynamics over time. This data is collected from various sources, including government agencies, private sector companies, and international organizations. It covers all forms of energy—such as crude oil, natural gas, electricity, coal, and renewables—providing a long-term perspective on how these commodities have performed and evolved.
Why is Historical Energy Data Important?
Market Analysis and Forecasting
By examining historical trends, analysts can predict future market movements and price fluctuations. For example, understanding past crude oil price cycles—such as the significant price drop in 2014 due to a global oversupply—can help market participants anticipate similar scenarios.
Risk Management and Hedging
Historical data is crucial for developing risk management strategies. Traders and companies use past price data to create hedging strategies that protect against adverse price movements. For example, during the 2008 financial crisis, many energy companies used historical price data to hedge against plummeting oil prices, stabilising their revenues despite market volatility.
Policy Making and Planning
Governments and regulatory bodies rely on historical energy data to formulate policies and plan future energy needs. For example, the European Union uses historical data on electricity consumption and renewable energy output to set targets for carbon emissions reductions and renewable energy adoption.
Investment Decisions
Investors use historical data to evaluate the performance of energy assets and commodities. Understanding historical price trends and demand patterns helps investors make better-informed decisions about where to allocate capital. For instance, the surge in natural gas prices in the early 2000s led many investors to shift their focus from coal to natural gas projects.
Historical Energy Price Trends Over Time: A Closer Look
Energy prices are a key economic indicator, reflecting the balance between supply and demand, geopolitical dynamics, technological advancements, and market speculation. Over time, these prices have exhibited significant volatility, shaped by a myriad of factors. Understanding historical energy price trends is crucial for businesses, investors, policymakers, and consumers to make informed decisions. This article explores the historical trends in energy prices for key commodities—crude oil, natural gas, electricity, and coal—using real-life examples to illustrate how these trends have evolved over time.
1. Crude Oil Price Trends
Crude oil prices have been among the most volatile in the energy sector, with significant fluctuations driven by geopolitical events, supply-demand dynamics, and technological changes.
1970s Oil Crises
The 1970s were marked by two major oil crises that dramatically impacted crude oil prices. The 1973 oil embargo by OPEC (Organization of the Petroleum Exporting Countries) against the United States and other Western nations caused oil prices to quadruple, rising from around $3 per barrel to over $12 per barrel. This embargo was a response to Western support for Israel during the Yom Kippur War. The second crisis, in 1979, followed the Iranian Revolution, which disrupted oil supplies and led to another sharp price increase, with crude oil prices peaking at around $39 per barrel in 1980.
1980s Oil Glut
After the shocks of the 1970s, the 1980s saw a period of relative stability and a significant drop in oil prices, largely due to increased production from non-OPEC countries like the United States, Mexico, and the North Sea fields. By 1986, crude oil prices had plummeted to around $10 per barrel due to an oversupply, triggering economic challenges in oil-exporting countries.
2000s and the Rise of Emerging Markets
The early 2000s saw a gradual increase in oil prices, driven by rising demand from emerging markets, particularly China and India. This period culminated in a peak in 2008 when crude oil prices reached an all-time high of $147 per barrel due to a combination of strong demand, limited spare capacity, and geopolitical tensions in oil-producing regions.
2014 Oil Price Collapse
In 2014, crude oil prices fell sharply from around $100 per barrel to below $50 per barrel. This decline was driven by a surge in U.S. shale oil production, which significantly increased global supply, coupled with OPEC’s decision not to cut production to defend market share. The price collapse had far-reaching effects on the global economy, particularly in oil-dependent countries.
COVID-19 Pandemic Impact (2020)
The COVID-19 pandemic led to an unprecedented decline in global oil demand as lockdowns and travel restrictions reduced consumption. In April 2020, WTI crude oil futures went negative for the first time in history, briefly reaching -$37.63 per barrel, as storage facilities filled up and traders were willing to pay others to take delivery. Although prices recovered later in the year, the pandemic highlighted the fragility of oil markets and their sensitivity to demand shocks.
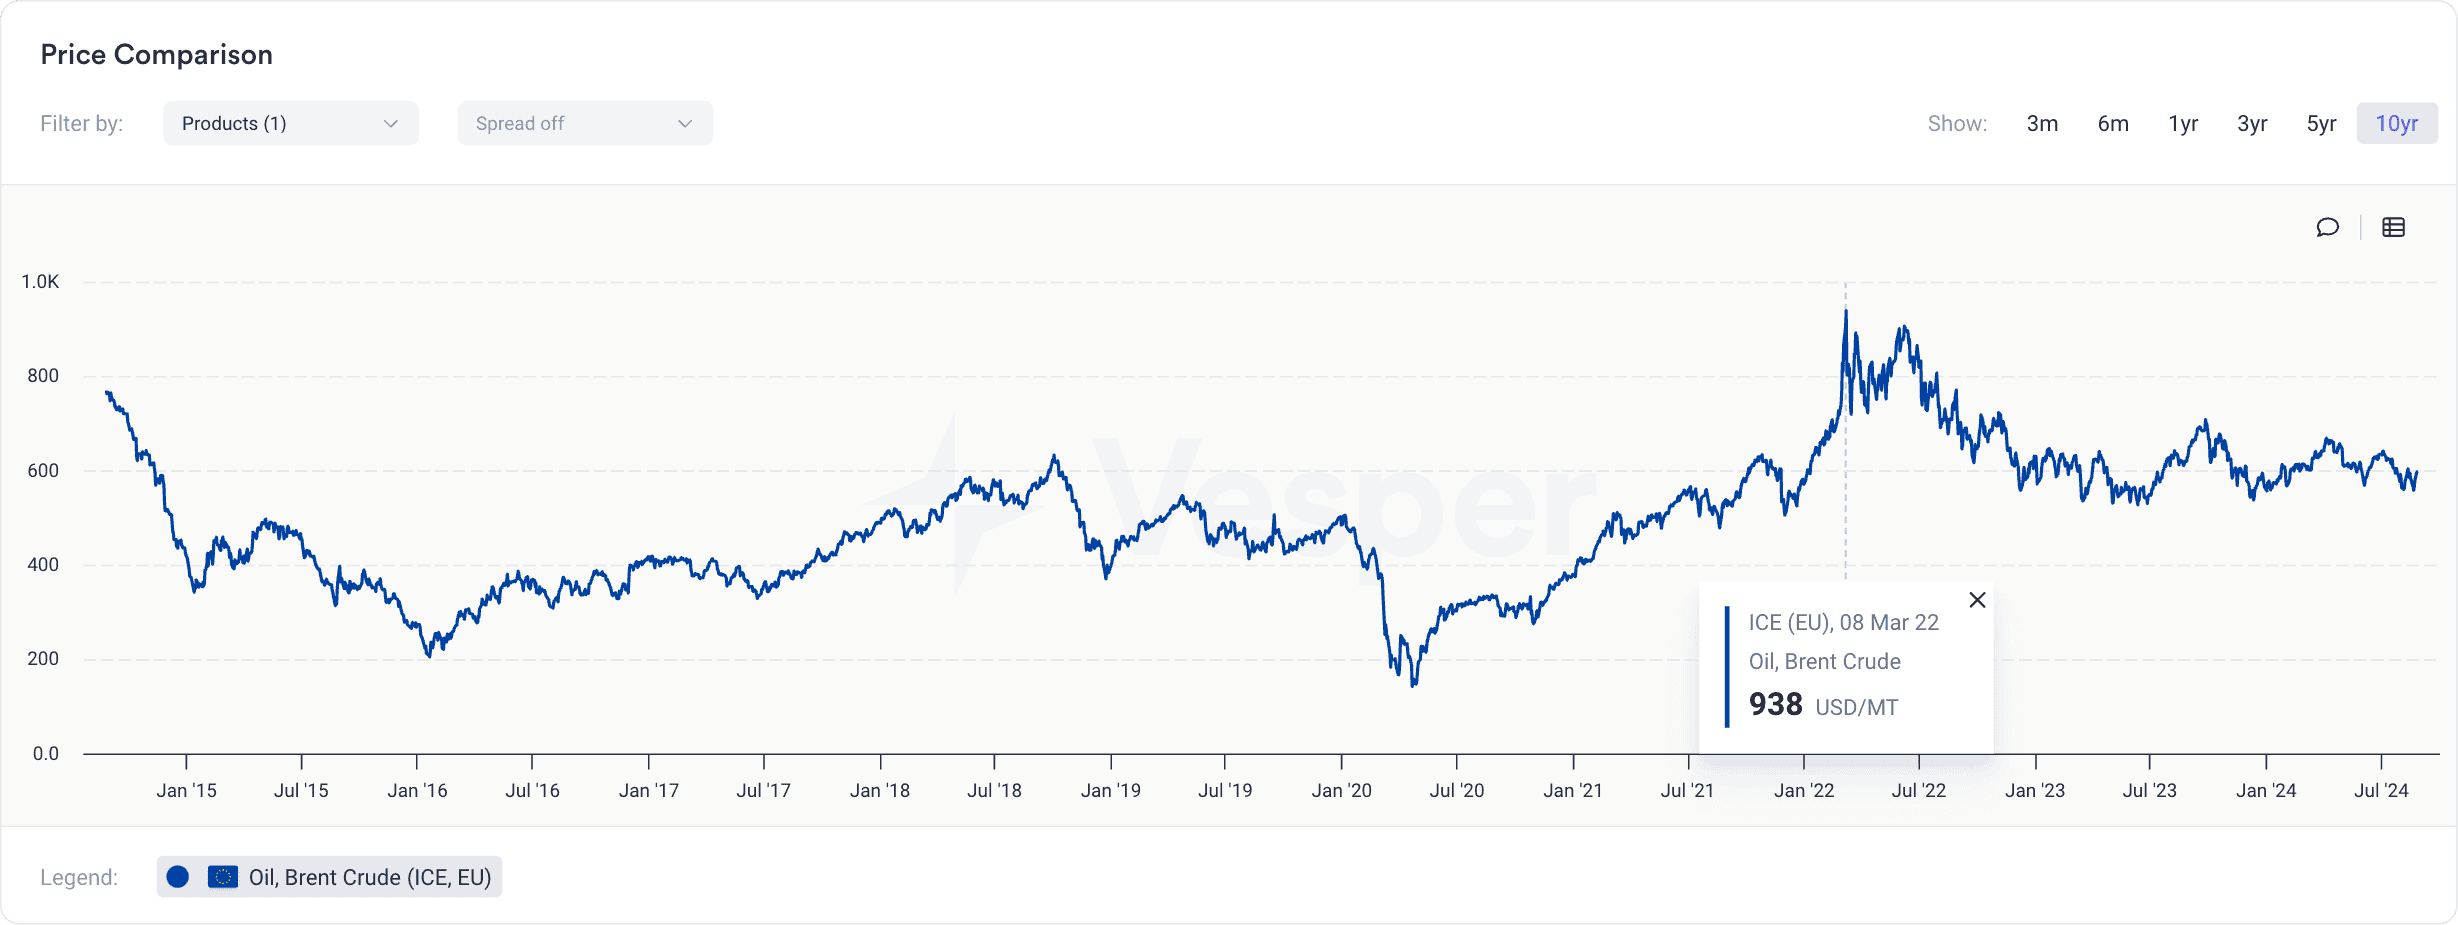
Russia-Ukraine War Impact (2022)
The recent conflict between Russia and Ukraine has caused one of the most significant disruptions in energy markets in recent years. Russia is a major global supplier of crude oil and natural gas, and the invasion of Ukraine in February 2022 led to severe sanctions against Russian oil exports by Western countries. As illustrated in the figure below from Vesper, this disruption caused a sharp spike in crude oil prices, with Brent crude reaching over $130 per barrel in March 2022, the highest level since 2008. The conflict exacerbated concerns about global supply shortages, further contributing to market volatility.
2. Natural Gas Price Trends
Natural gas prices have also experienced significant volatility, influenced by regional supply-demand imbalances, weather patterns, and technological advancements.
1990s to Early 2000s Volatility
The natural gas market in the United States was deregulated in the 1990s, leading to greater price volatility as market forces determined prices. Natural gas prices spiked in the early 2000s due to increased demand for electricity generation and winter heating, reaching over $10 per million British thermal units (MMBtu) in 2005 after Hurricane Katrina disrupted production in the Gulf of Mexico.
Shale Gas Revolution (2008-2015)
The advent of hydraulic fracturing (fracking) technology in the late 2000s transformed the natural gas market in North America. The shale gas revolution significantly increased U.S. natural gas production, leading to a substantial drop in prices. By 2012, natural gas prices had fallen to below $2 per MMBtu, the lowest level in decades, as supply outstripped demand. This price decline made natural gas a more attractive option for electricity generation and industrial use, displacing coal in many regions.
Polar Vortex Events (2014 and 2019)
Extreme cold weather events, such as the Polar Vortex in North America, have caused sharp spikes in natural gas prices due to increased demand for heating. In January 2014, natural gas prices at the Henry Hub reached nearly $8 per MMBtu due to a severe cold snap, highlighting the impact of weather-related demand surges on price volatility.
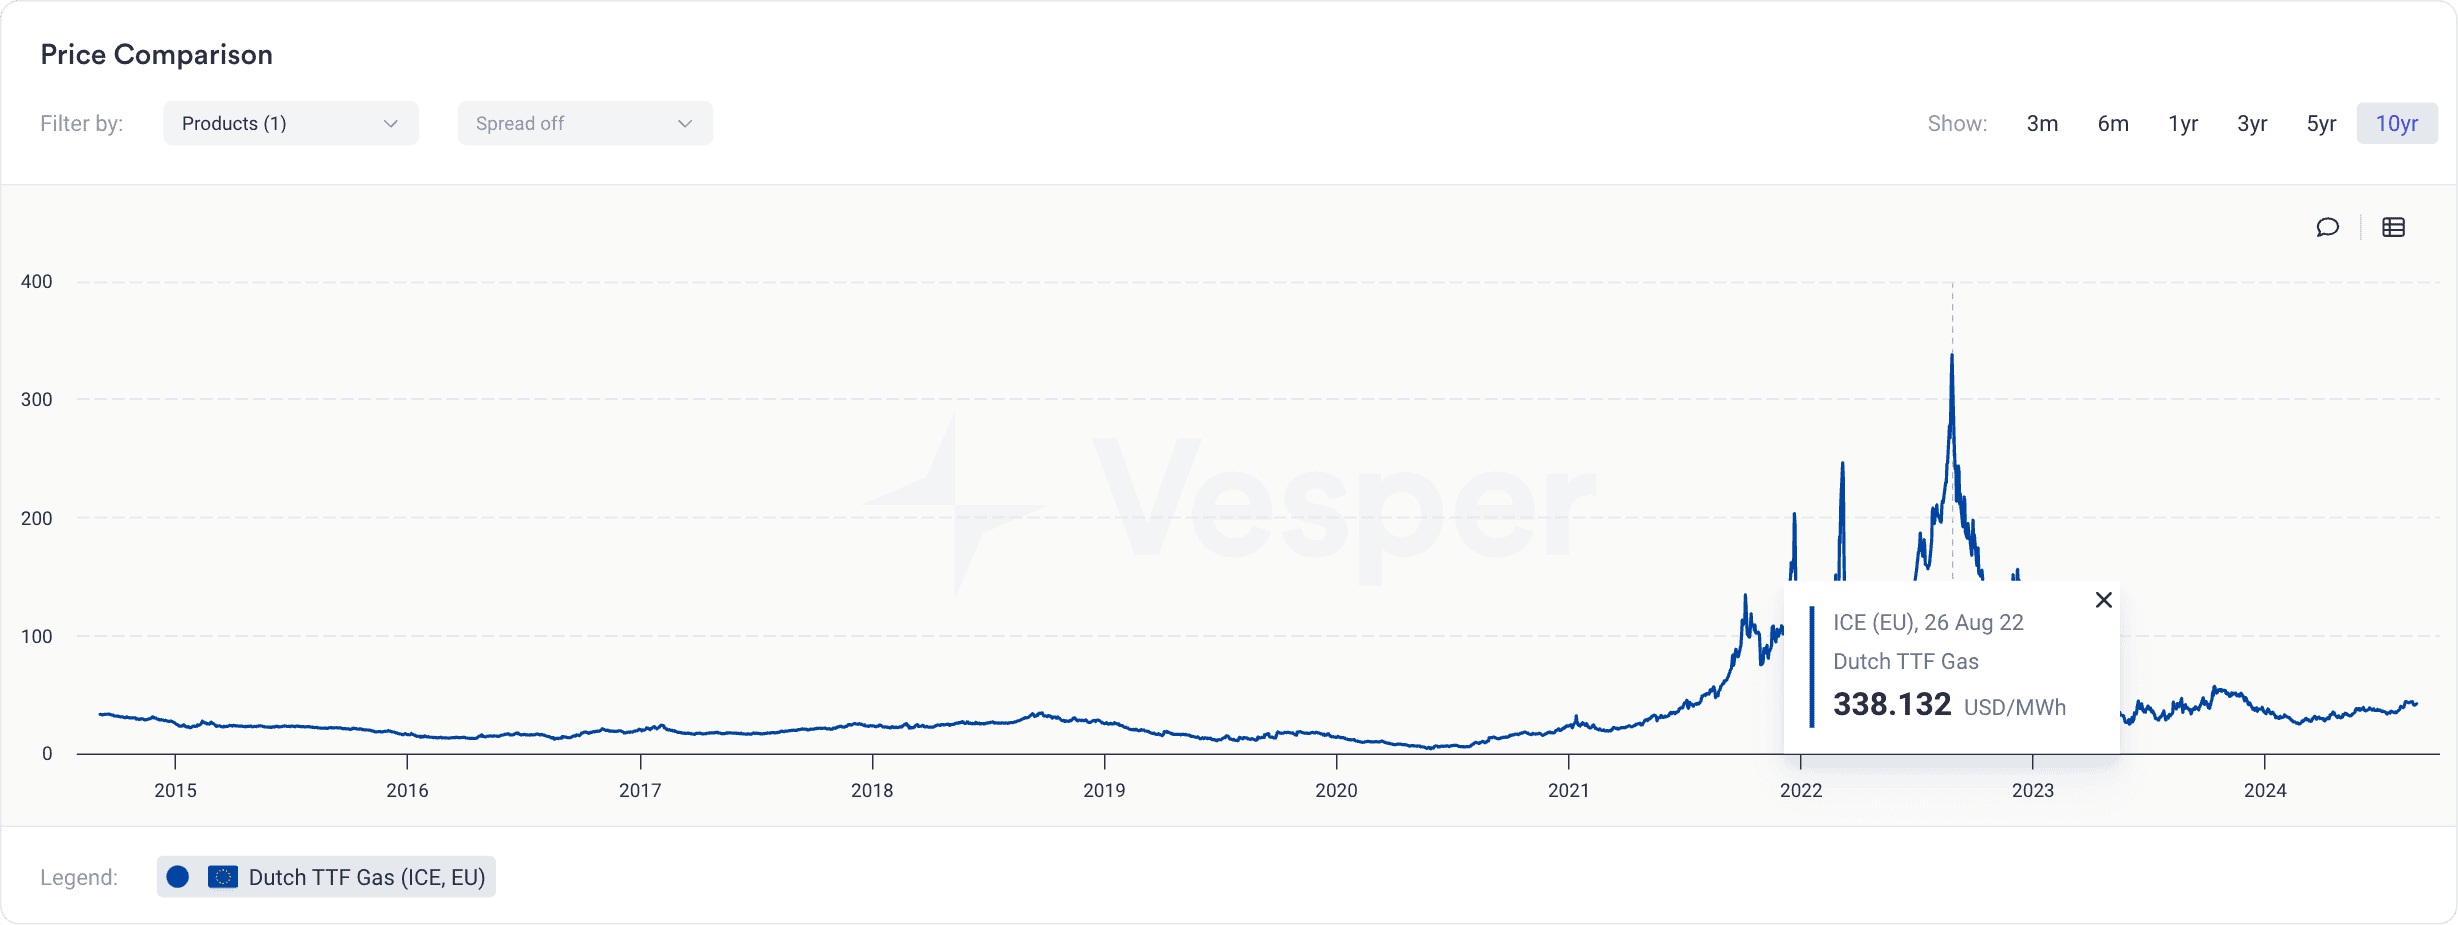
Energy Crisis in Europe (2021-2022)
In 2022, natural gas prices in Europe reached record highs, driven by a combination of factors, including low storage levels, increased demand post-pandemic, and reduced supplies from Russia. As displayed in the figure below from Vesper, The TTF (Title Transfer Facility) gas price benchmark in the Netherlands reached over $338 per MWh, illustrating the impact of geopolitical tensions and supply constraints on natural gas markets.
3. Electricity Price Trends
Electricity prices are influenced by a complex interplay of factors, including fuel costs, weather conditions, regulatory changes, and grid stability.
California Energy Crisis (2000-2001)
One of the most notable electricity price spikes occurred during the California Energy Crisis of 2000-2001. A combination of regulatory failures, market manipulation by energy traders like Enron, and reduced hydroelectric power generation due to drought led to rolling blackouts and a surge in electricity prices. Spot prices on the California Power Exchange soared to over $1,500 per MWh, up from less than $50 per MWh, causing significant economic disruption and leading to reforms in electricity market regulation.
Integration of Renewables in Europe (2010s)
Throughout the 2010s, Europe saw a significant increase in renewable energy capacity, particularly wind and solar. While this shift toward cleaner energy sources helped reduce carbon emissions, it also introduced volatility in electricity prices due to the intermittent nature of renewables. For example, during periods of high wind output in Germany, electricity prices on the EEX (European Energy Exchange) could turn negative as supply exceeds demand, highlighting the challenges of integrating renewables into the grid.
Texas Freeze (February 2021)
The Texas Freeze of February 2021 led to a dramatic spike in electricity prices as extreme cold weather caused power generation failures and rolling blackouts across the state. The spot price of electricity in the ERCOT (Electric Reliability Council of Texas) market surged to its maximum allowable price of $9,000 per MWh, up from typical prices of around $30 per MWh. This crisis underscored the vulnerabilities of electricity grids to extreme weather events and the need for robust energy infrastructure.
4. Coal Price Trends
Coal prices have historically been more stable than those of oil and natural gas but have faced significant declines in recent years due to shifting energy policies and growing environmental concerns.
Steady Demand Growth (2000-2010)
Between 2000 and 2010, coal prices experienced steady growth, driven by rising demand from emerging markets like China and India, where coal was the dominant source of electricity generation. The price of Newcastle coal, a key benchmark, rose from around $25 per ton in the early 2000s to over $120 per ton in 2008, reflecting strong global demand.
Shift Away from Coal (2010-Present)
In the 2010s, coal prices began to decline as developed countries, particularly in Europe and North America, shifted away from coal-fired power plants to reduce carbon emissions. The Paris Agreement in 2015 accelerated this trend, with many countries committing to phase out coal. By 2020, Newcastle coal prices had fallen to around $50 per ton as demand waned, and natural gas and renewables gained market share.
Impact of COVID-19 Pandemic (2020)
The COVID-19 pandemic further depressed coal demand, as lockdowns and economic slowdowns reduced electricity consumption globally. However, coal prices rebounded in 2021 as economic activity resumed, and coal remained a key energy source in Asia. For example, in 2021, Newcastle coal prices surged to over $150 per ton due to strong demand from China and India amid global supply disruptions.
Conclusion
Historical energy price trends provide valuable insights into the dynamics of global energy markets. Understanding these trends helps businesses, policymakers, and investors make informed decisions, manage risks, and develop strategies to navigate the complexities of the energy sector. From the volatility of crude oil and natural gas to the evolving landscape of electricity and coal, historical data offers a window into the past and a guide for the future. For those involved in the energy market, staying informed about historical price movements is essential for anticipating future changes and seizing opportunities in a rapidly changing world.
Where Can I Find Historical Energy Price Data?
There are several reputable sources where you can access historical energy price data, each offering unique features, data types, and levels of detail. Here’s a guide to some of the best places to find historical energy price data:
1. Data Providers and Financial Information Services
- Vesper: Vesper’s commodity intelligence platform offers comprehensive historical data and real-time analytics for a wide range of energy commodities, including crude oil, natural gas, electricity, and coal. Vesper’s platform is designed for professionals looking to understand market trends, develop risk management strategies, and make data-driven decisions.
- Bloomberg: Bloomberg provides extensive historical data on energy prices, including crude oil, natural gas, electricity, and coal. Its platform offers comprehensive analytics tools and customisable data visualizations.
- Refinitiv (formerly Thomson Reuters): Refinitiv is another leading provider of financial market data, including historical energy prices. The Refinitiv Eikon platform offers data on a wide range of energy commodities and markets, with tools for in-depth analysis and trend forecasting.
2. Government Agencies and Public Institutions
- U.S. Energy Information Administration (EIA): The EIA is a leading source of historical energy price data in the United States. It provides detailed data on crude oil, natural gas, coal, electricity, and renewable energy prices. The EIA’s databases allow users to access data over various timeframes, from daily prices to annual averages. For example, you can find historical data on the West Texas Intermediate (WTI) crude oil price, Henry Hub natural gas prices, and U.S. retail gasoline prices.
- International Energy Agency (IEA): The IEA provides a broad range of historical energy data covering global energy markets. It offers data on oil, natural gas, coal, electricity, renewables, and energy efficiency. The IEA’s databases are particularly useful for those looking for international energy price comparisons and trends across different regions.
- Eurostat: Eurostat is the statistical office of the European Union, providing historical data on energy prices within the EU. It covers various energy types, including electricity, natural gas, and petroleum products, with a focus on prices for industrial and household consumers.
3. Commodity Exchanges
- New York Mercantile Exchange (NYMEX): Part of the CME Group, NYMEX is a major marketplace for trading energy commodities, including crude oil, natural gas, heating oil, and gasoline. Historical futures price data for these commodities can be accessed through CME Group’s website or data providers affiliated with NYMEX.
- Intercontinental Exchange (ICE): ICE provides historical price data for various energy commodities, including Brent crude oil, natural gas, and coal. ICE’s historical data offerings are particularly valuable for those interested in European and global energy markets.
- European Energy Exchange (EEX): The EEX offers historical price data for power, natural gas, and other energy commodities across Europe. It provides data on spot and futures prices, making it a valuable resource for understanding market dynamics in European electricity and gas markets.