Why are Historical Sugar Prices Important for Sugar Procurement?
Historical sugar prices provide valuable insights for sugar procurement in various ways:
1. Trend Analysis
Historical sugar prices are crucial for identifying and understanding long-term trends in the market. By analyzing past prices it becomes possible to predict future market movements. This insight helps businesses and investors develop strategies that align with the cyclical nature of the sugar market, ensuring they are better prepared for periods of surplus or shortage.
2. Price Volatility
Sugar prices are often volatile due to factors like weather, global demand shifts, and policy changes. Historical data helps market participants understand the frequency and extent of these price swings. This knowledge is essential for developing risk management strategies, such as hedging, that can protect against unexpected price changes and stabilize financial planning.
3. Benchmarking
Using historical data as a benchmark allows analysts to compare current market conditions with historical norms. By evaluating today’s prices, production volumes, and other key metrics against past averages, businesses can assess whether the market is behaving typically or if there are unusual dynamics at play. This comparison is vital for making informed decisions in a volatile market.
4. Economic Indicators
The sugar market is often a reflection of broader economic trends, especially in major producing countries. Historical sugar data can indicate the health of these economies, as changes in sugar production or prices may signal broader economic shifts. Analysts use this information to assess potential impacts on global trade, inflation, and economic growth, making it an important tool for understanding the economic context in which the sugar market operates.
Where Can I Find Historical Sugar Price Data?
Finding historical sugar price data is essential for everyone involved in the sugar industry, whether for trading, market analysis, or research. This data can be accessed from various reliable sources, each offering valuable insights:
Government and International Agencies
Websites like the Food and Agriculture Organization (FAO) and the United States Department of Agriculture (USDA) provide extensive historical data on sugar production, consumption, and prices. These platforms are excellent for obtaining long-term data sets that are critical for understanding market trends.
Commodity Exchanges
Major commodity exchanges, such as the Intercontinental Exchange (ICE) offer historical price data for sugar futures. This data is invaluable for traders and analysts who need to track price movements and develop trading strategies.
Industry Reports and Publications
Reports from industry organizations like the International Sugar Organization (ISO) provide detailed analyses and historical data on global sugar markets. These reports often include price trends, production statistics, and forecasts, which are crucial for informed decision-making.
Commodity Intelligence Platforms
Platforms like Bloomberg, Thomson Reuters or Vesper offer comprehensive historical data on sugar prices. These platforms are widely used by professionals for in-depth analysis and real-time data access.
Academic and Research Institutions
Universities and research institutions often publish studies and papers that include historical sugar price data. These can be valuable resources for researchers and analysts looking to understand the factors influencing market dynamics over time.
What Factors Have Influenced Sugar Prices Historically?
When discussing the main factors that have historically influenced sugar prices, it’s essential to consider a wide range of economic, environmental, and political factors that have played significant roles over time. Here are some of the primary influences, along with examples.
1. Supply and Demand Dynamics
Global Production Levels
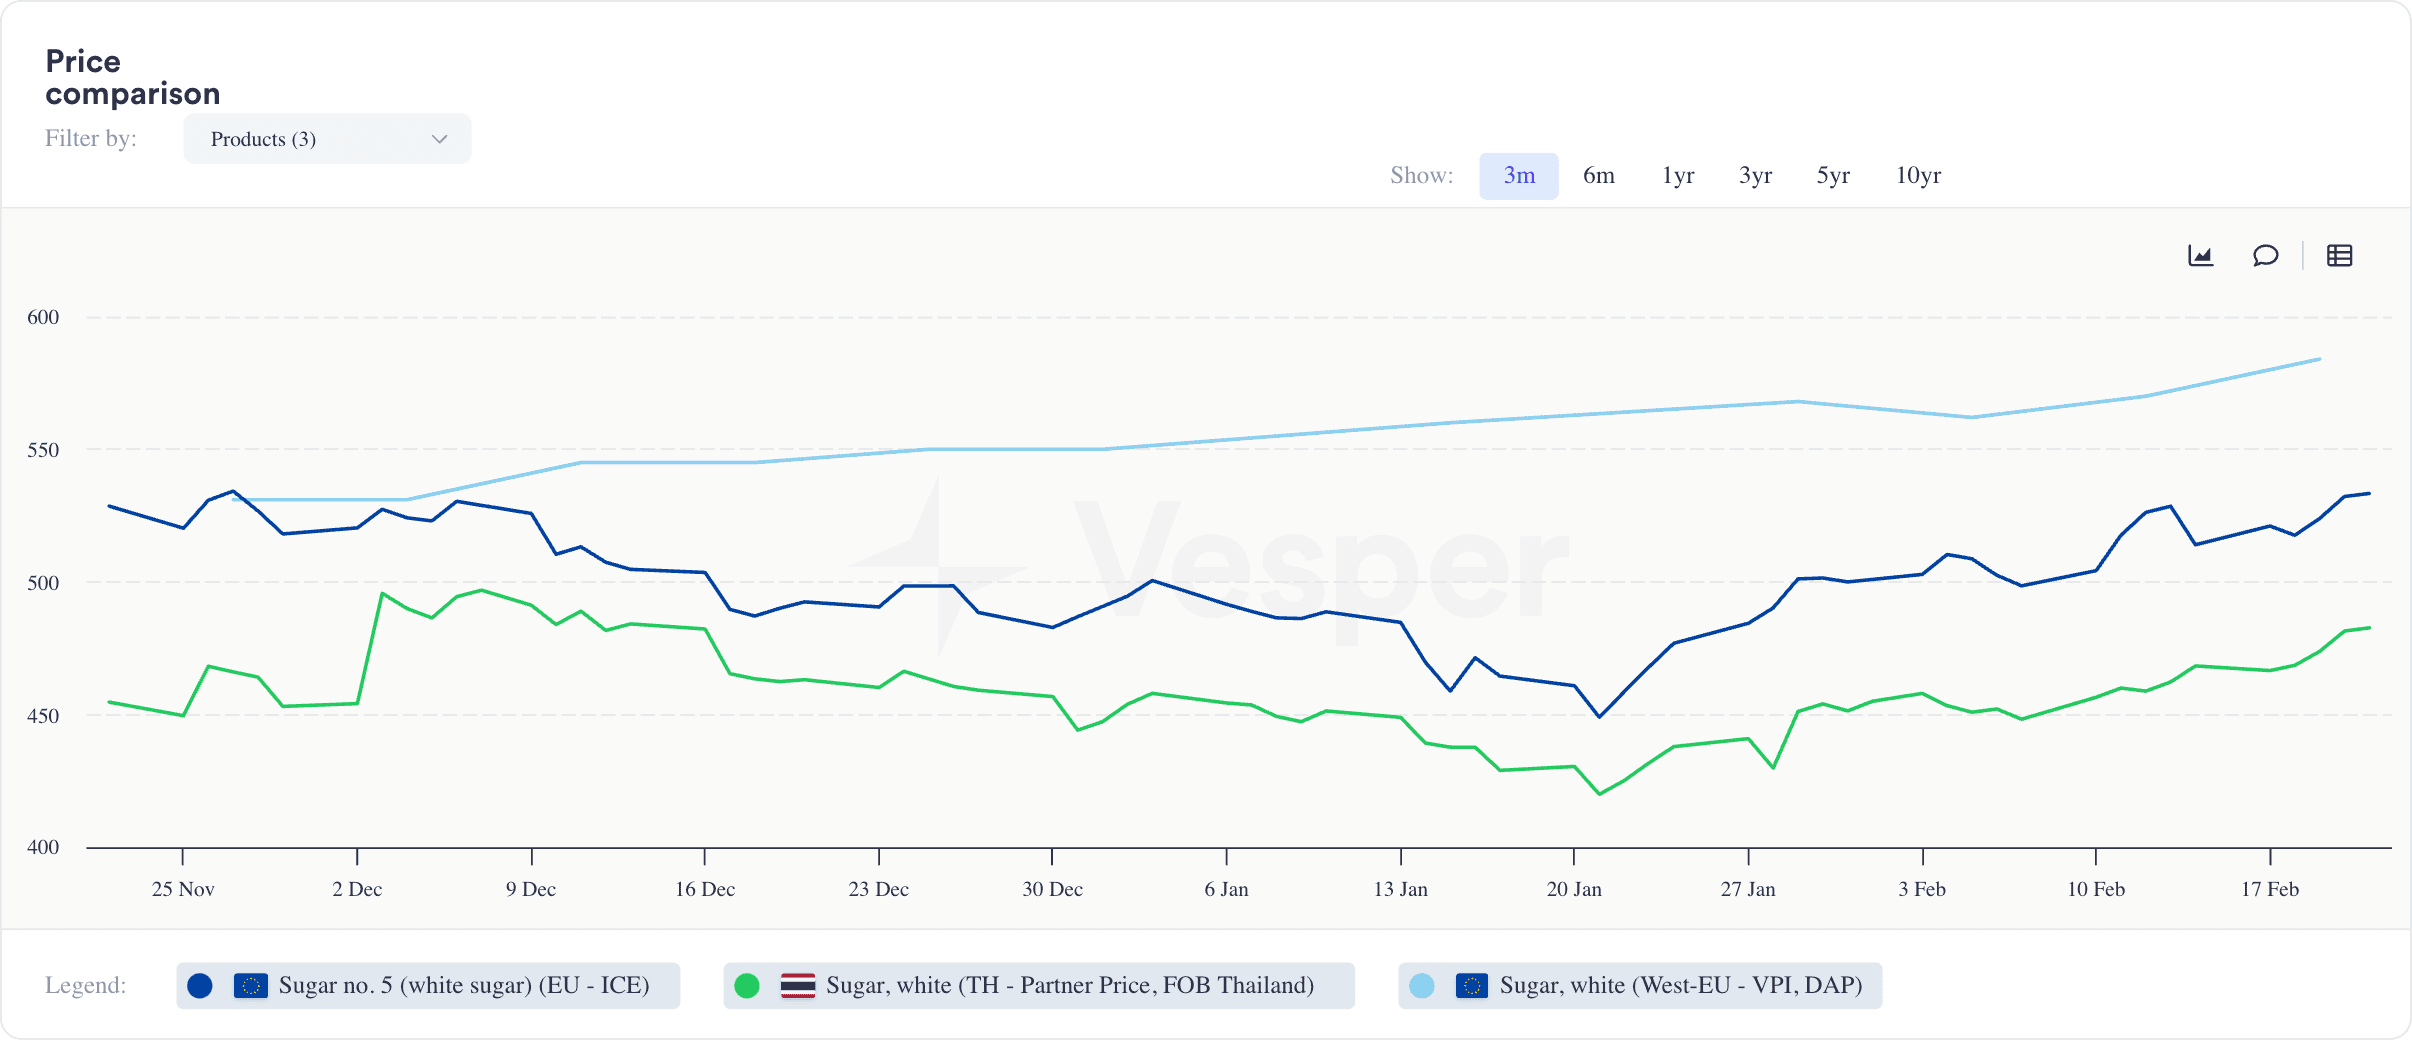
Historically, fluctuations in sugar prices are closely tied to supply levels from major producers like Brazil, India, and Thailand. As seen in recent trends for instance, the expansion of Brazil’s sugar output has led to downward pressure on global prices.
Recorded in February 2025, Brazil’s sugar production for the 2024/25 season is expected to reach 46.88 million metric tons (MT)—a significant increase compared to previous years, see Vesper’s production figure below.

This surge in supply has played a crucial role in shaping global sugar prices, with both white sugar (EU – ICE) and raw sugar (US – ICE) experiencing price corrections, see Vesper’s pricing figure below.
Consumption Trends
Changes in global dietary habits, especially the growing consumption of processed foods in emerging markets, have led to increased demand for sugar. Over the years, global sugar consumption has consistently risen. In 2010, worldwide sugar consumption was approximately 165 million tonnes. By 2020, it had grown to around 173 million tonnes, reflecting a compound annual growth rate (CAGR) of about 0.5%. This increase has been largely driven by rising demand in developing countries, particularly in Asia. For example, sugar consumption in India grew from about 23 million tonnes in 2010 to over 26 million tonnes by 2020.
2. Climatic Conditions
Weather Events
Sugarcane and sugar beet crops are highly sensitive to climatic conditions, with extreme weather events like those caused by the El Niño or El Niña pattern significantly disrupting production.
For instance, India’s sugar production in December 2024 was projected to fall below consumption levels for the first time in eight years due to extreme weather conditions—both drought and excessive rainfall—affecting key sugar-producing states like Maharashtra, Karnataka, and Uttar Pradesh.
Precipitation data from September to November 2024 on Vesper, shows inconsistent rainfall patterns, with some regions experiencing water stress while others suffered from flooding, both of which impacted sugarcane yields and quality, see Figure below. This weather-driven decline, from 32 to 27 million metric tons, led the Indian government to extend its sugar export ban to ensure domestic supply and boost ethanol production. By tracking weather-related trends, such as precipitation anomalies and temperature shifts, Vesper’s commodity intelligence platform helps stakeholders anticipate production shortfalls and market disruptions. This kind of real-time data is crucial for decision-making in agriculture, trade, and food industries.

Climate Change
Long-term changes in climate are also affecting sugar production. Regions like South Asia are experiencing more unpredictable monsoon seasons, which directly impact sugarcane farming. Similarly, in Brazil, the occurrence of unexpected frosts or prolonged dry periods can devastate crops.
3. Political and Economic Policies
Subsidies and Tariffs
Government interventions such as subsidies and tariffs have a profound effect on sugar prices. In the European Union, for example, the Common Agricultural Policy (CAP) provides subsidies to sugar beet farmers, which helps stabilize prices within the EU but can distort global prices. Similarly, import tariffs on sugar in the United States have historically kept domestic prices higher than global averages.
Export Restrictions
Countries that are major sugar exporters, like India and Thailand, sometimes impose export restrictions to secure domestic supply and control local prices. For instance, during the 2016-2017 sugar season, India, one of the world’s largest sugar producers and exporters, faced a severe drought that drastically reduced sugarcane yields, particularly in major producing states like Maharashtra and Karnataka. The reduced output led to fears of domestic shortages and rising prices within India.
In response, the Indian government implemented strict export restrictions to ensure sufficient domestic supply. These restrictions included imposing export duties and limiting the quantity of sugar that could be shipped abroad. As a result, global sugar markets experienced price increases due to the reduced availability of Indian sugar on the international market.
4. Currency Fluctuations
Exchange Rates
As sugar is traded internationally, the strength of major currencies can significantly impact prices. The Brazilian real (BRL) has a significant impact on sugar prices because Brazil is the world’s largest sugar exporter. When the real weakens against other currencies, Brazilian sugar becomes cheaper for foreign buyers, which can lead to increased exports and, at times, lower global prices. For example, in 2015, the real depreciated by about 30% against the US dollar, dropping from around BRL 2.7 per USD in January 2015 to BRL 4.0 per USD by the end of the year. This depreciation made Brazilian sugar more competitive on the global market, contributing to a decline in international sugar prices.
6. Technological Advancements
Improved Farming Techniques
Advances in agricultural technology, such as the development of drought-resistant sugarcane varieties or more efficient irrigation systems, have the potential to increase yields and reduce production costs. For instance, Brazil has been at the forefront of bioengineering sugarcane to be more resistant to pests and adverse weather, which has helped stabilize production and mitigate some price volatility.
7. Market Speculation
Commodities Trading
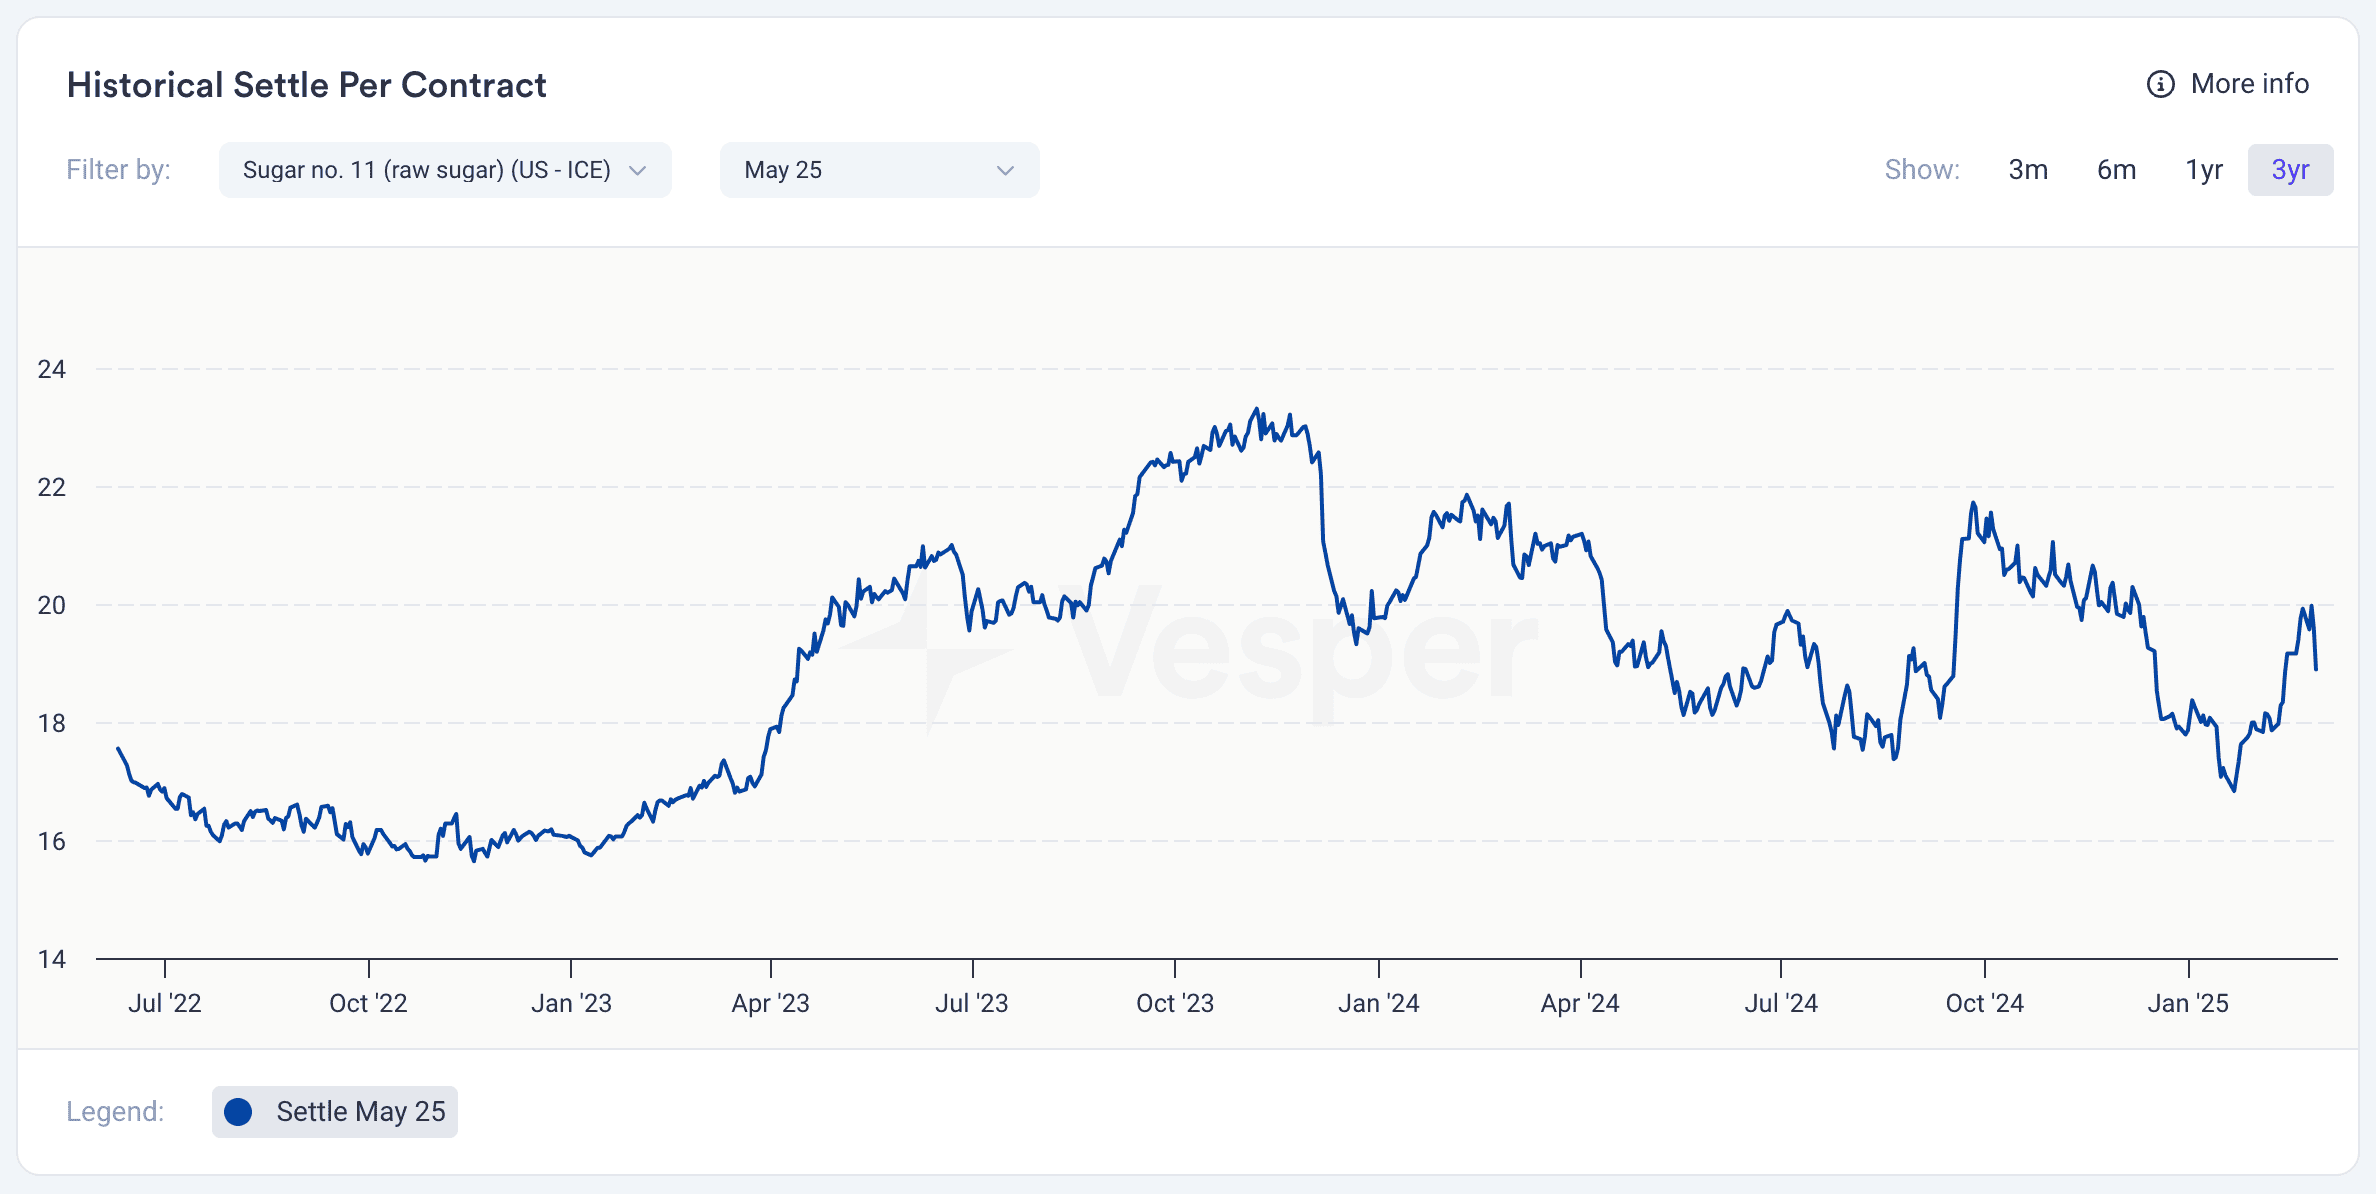
Sugar, like many other commodities, is subject to speculation on global markets. Traders’ perceptions of future supply and demand can lead to significant price swings.
In late 2024 for instance, speculation about a global sugar shortage intensified after India extended its sugar export ban due to reduced production. Traders anticipated tighter supply in the global market, leading to increased speculative buying. Vesper’s Historical Settle Per Contract graph below shows a clear price spike of Sugar No. 11 in Q4 2024.
8. Global Health Trends
Sugar Consumption Policies
Growing health concerns about sugar consumption, particularly in relation to obesity and diabetes, have driven significant policy changes that impact sugar demand. A prime example of this is Mexico’s 2014 introduction of a soda tax. This tax led to a substantial reduction in the consumption of sugary drinks, with purchases dropping by nearly 10% over two years. The decreased demand for sugary beverages translated into a reduction in domestic sugar demand, which also had implications for global sugar markets.
Similarly, in 2018, the United Kingdom introduced its own sugar tax, which pushed beverage manufacturers to reformulate their products with lower sugar content. This led to a decline in sugar consumption within the UK. While the impact on global sugar demand was less pronounced compared to Mexico, the UK’s policy still contributed to a broader trend of reducing sugar demand as health-driven policies gained traction worldwide.
9. Energy Prices
Cost of Production
The process of refining sugar, especially white sugar, is highly energy-intensive. Rising energy costs, particularly for natural gas and electricity, can significantly drive up production costs. For example, the energy crisis in Europe in 2021 led to increased costs for processing sugar beets, which in turn contributed to higher sugar prices. This issue became especially apparent when natural gas prices peaked on 28 October 2022, reaching their highest level in three years, as shown in the figure below. The sugar industry’s reliance on energy-intensive processes meant that these price spikes had a direct impact on production costs and market prices.

In conclusion, historical sugar price data is a crucial resource for understanding market dynamics, making informed decisions, and forecasting future trends. By leveraging data from various sources and analyzing real-life examples, stakeholders can gain deeper insights into the factors driving sugar prices and make more informed strategic decisions.
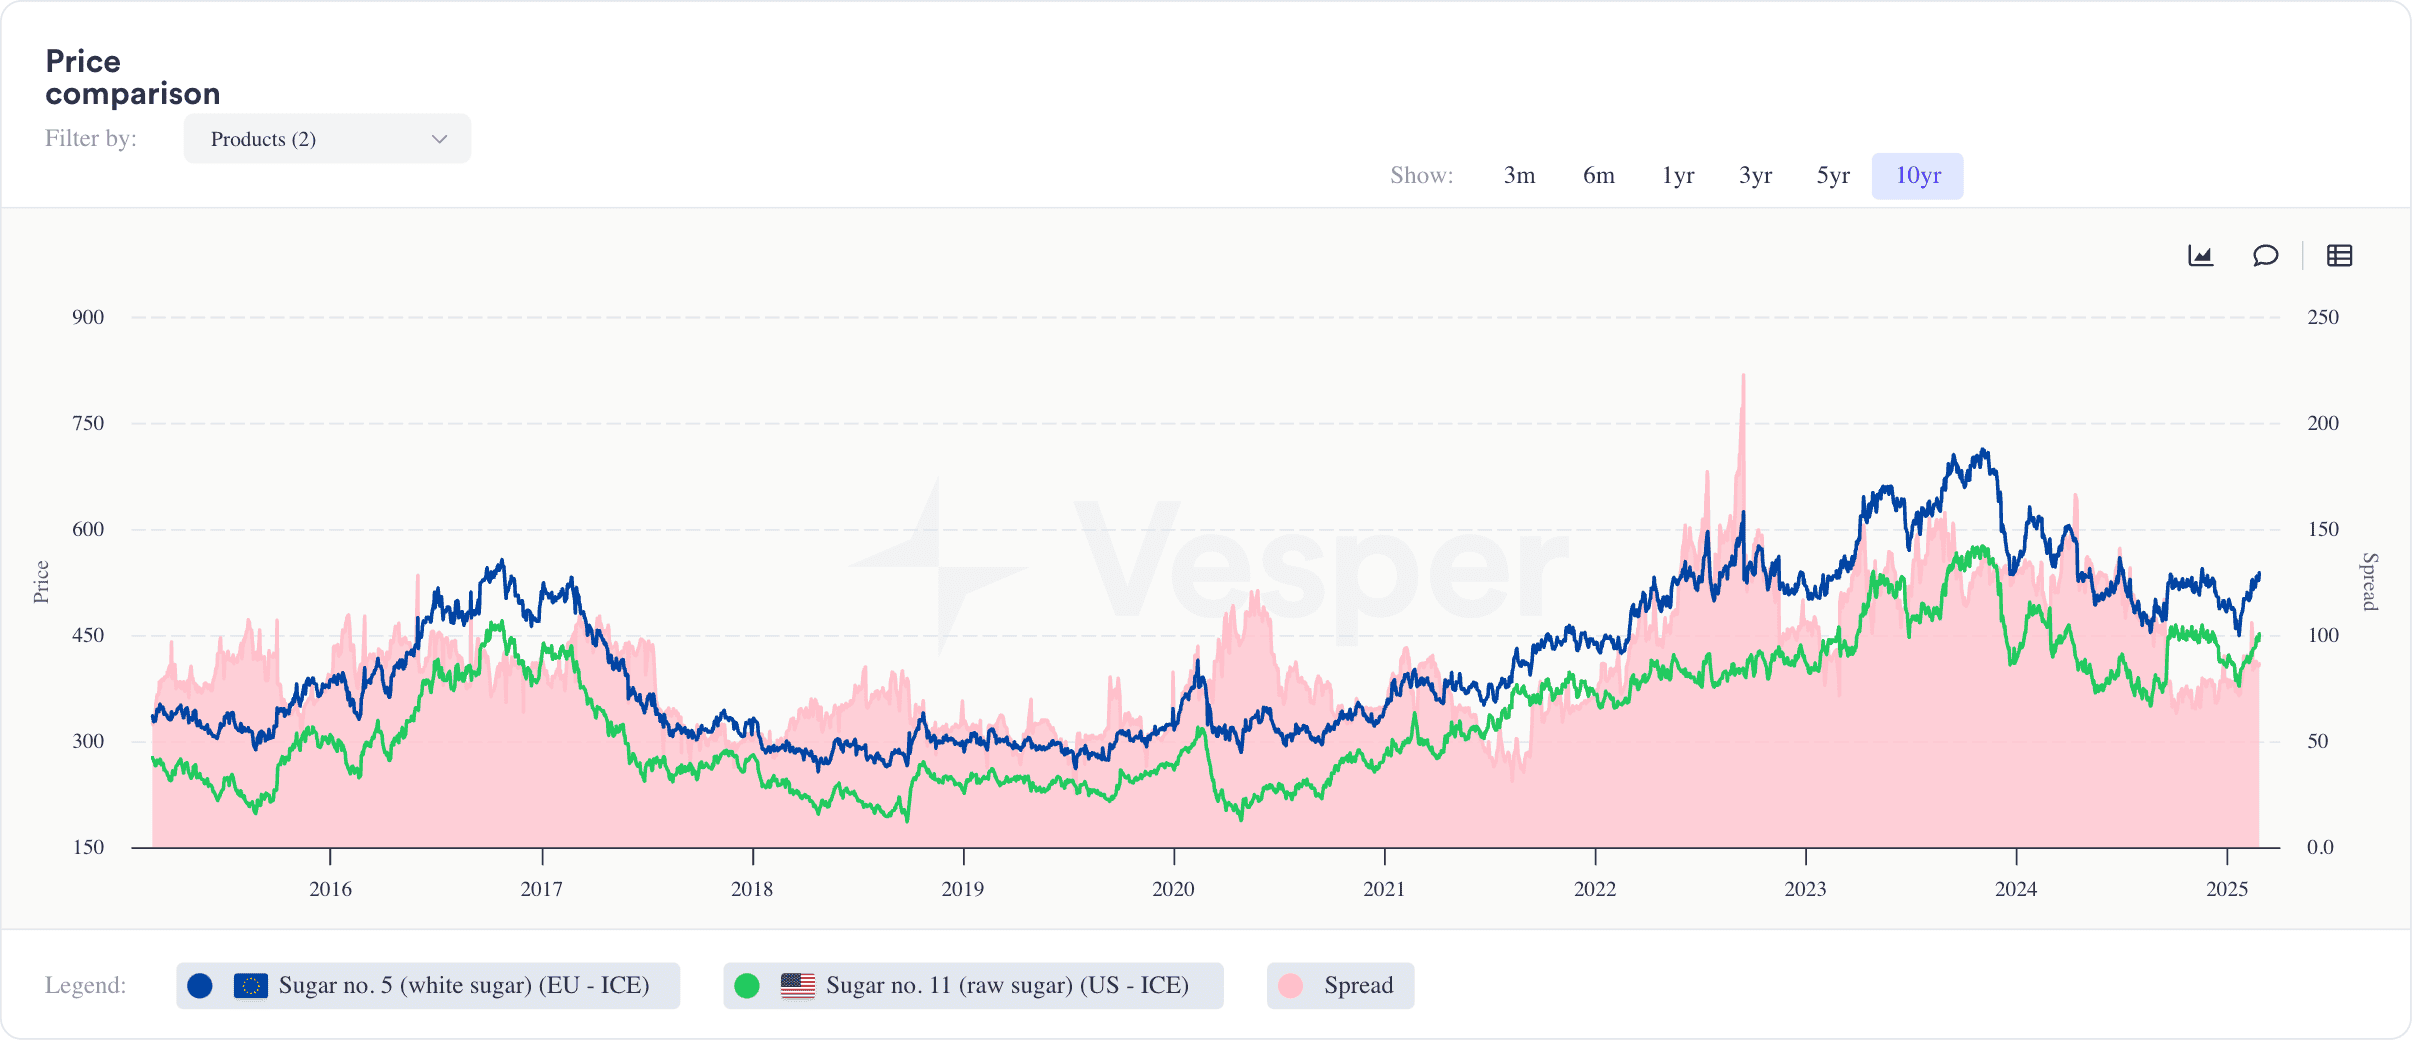
Historical Sugar Prices: Key Trends and Examples of Price Changes Over the Years
Over the past decade, sugar prices have shown significant volatility, with notable spikes around 2016 and again from 2020 onwards, as illustrated in the figure below. Since 2020, sugar prices have consistently risen, marking the most substantial increase in recent years. This surge can be attributed to a combination of factors including supply chain disruptions, adverse weather conditions, and strategic trade policies, all within a context of growing global demand.
The End of EU Sugar Quotas
In 2017, the European Union (EU) abolished its sugar production quotas, a significant policy shift that had controlled sugar production in member states since 1968. Before the quota removal, the EU had a cap on production of around 13.5 million tonnes of sugar annually. The removal of the quota allowed EU farmers to produce sugar without limits, leading to an increase in production to around 21 million tonnes in 2017-2018. This increase in supply put downward pressure on sugar prices within the EU and also had ripple effects on global prices.

Impact of COVID-19
The COVID-19 pandemic initially disrupted labor and logistics, severely affecting the global sugar supply. However, as economies began to recover, there was a surge in demand for sugar, especially in processed foods and beverages, further straining supply.
Climatic Influences
Climatic events have also played a major role in driving up sugar prices. For instance, the El Niño phenomenon that began in 2023 led to drought conditions in key sugar-producing regions like Asia, while Brazil, another major producer, faced unpredictable rainfall. These conditions reduced sugar cane yields, tightening global supply.
Trade Policies and Export Restrictions
Trade policies have significantly influenced global sugar prices. India, one of the largest sugar exporters, imposed export restrictions to protect its domestic market amid production challenges, creating a supply gap in the global market. Brazil, despite record sugarcane harvests, has also been impacted by global price trends, with investors responding by increasing their stakes in the sugar market.
These combined factors have resulted in the continued rise and volatility of sugar prices year over year.
FAQ
How did the abolition of EU sugar quotas in 2017 affect sugar prices?
The European Union abolished its sugar production quotas in 2017, a policy that had been in place since 1968. This led to an increase in sugar production within the EU, resulting in downward pressure on prices due to the sudden surge in supply. Understanding such policy changes is essential for procurement managers to anticipate market shifts.
What caused the surge in sugar prices during the “Dance of the Millions”?
Several factors contributed to the surge in sugar prices during this period:
- Global Demand: Post-World War I, there was a heightened demand for sugar, especially from countries whose own production had been disrupted by the war.
- Speculation: Investors anticipated continued price increases, leading to speculative investments in sugar production and land.
- Supply Constraints: European beet sugar production had not yet recovered from wartime disruptions, limiting global supply.
How did the 1970s commodities boom affect sugar prices?
During the 1970s, a surge in commodity prices, influenced by geopolitical events and economic policies, led to significant increases in sugar prices. Factors such as the oil crisis and global economic shifts contributed to this trend.
What was the impact of the Jones–Costigan Amendment on sugar prices during the Great Depression?
The Jones–Costigan Amendment, enacted in 1934, aimed to support the struggling U.S. sugar industry during the Great Depression by imposing tariffs and quotas, along with direct subsidies to sugar growers. This intervention sought to stabilize domestic sugar prices amidst declining agricultural prices and economic hardship.
What role did the Chadbourne Agreement play in stabilizing sugar prices during the 1930s?
In response to plummeting sugar prices during the Great Depression, the Chadbourne Agreement was established in 1931. This international pact aimed to stabilize prices by reducing sugar production and setting export quotas among participating nations. Despite these efforts, challenges such as non-participation by key countries and overproduction in others limited its effectiveness.