The labor shortages in Malaysia during 2022 were primarily due to the COVID-19 pandemic and related government restrictions. Malaysia’s palm oil industry heavily relies on foreign workers, particularly from countries like Indonesia, Bangladesh, and Nepal, to perform the physically demanding tasks of harvesting and processing palm oil.
What Are the Key Components of Oils and Fats Supply and Demand Data?
Vegetable oil supply and demand data is essential for understanding the balance between how much vegetable oil is available on the market and how much is required by consumers and industries. The term “vegetable oil supply and demand data” encompasses a wide range of key metrics that are crucial for stakeholders across the sector, including production volumes, stock levels, export and import figures, and consumer consumption across different regions and product categories.
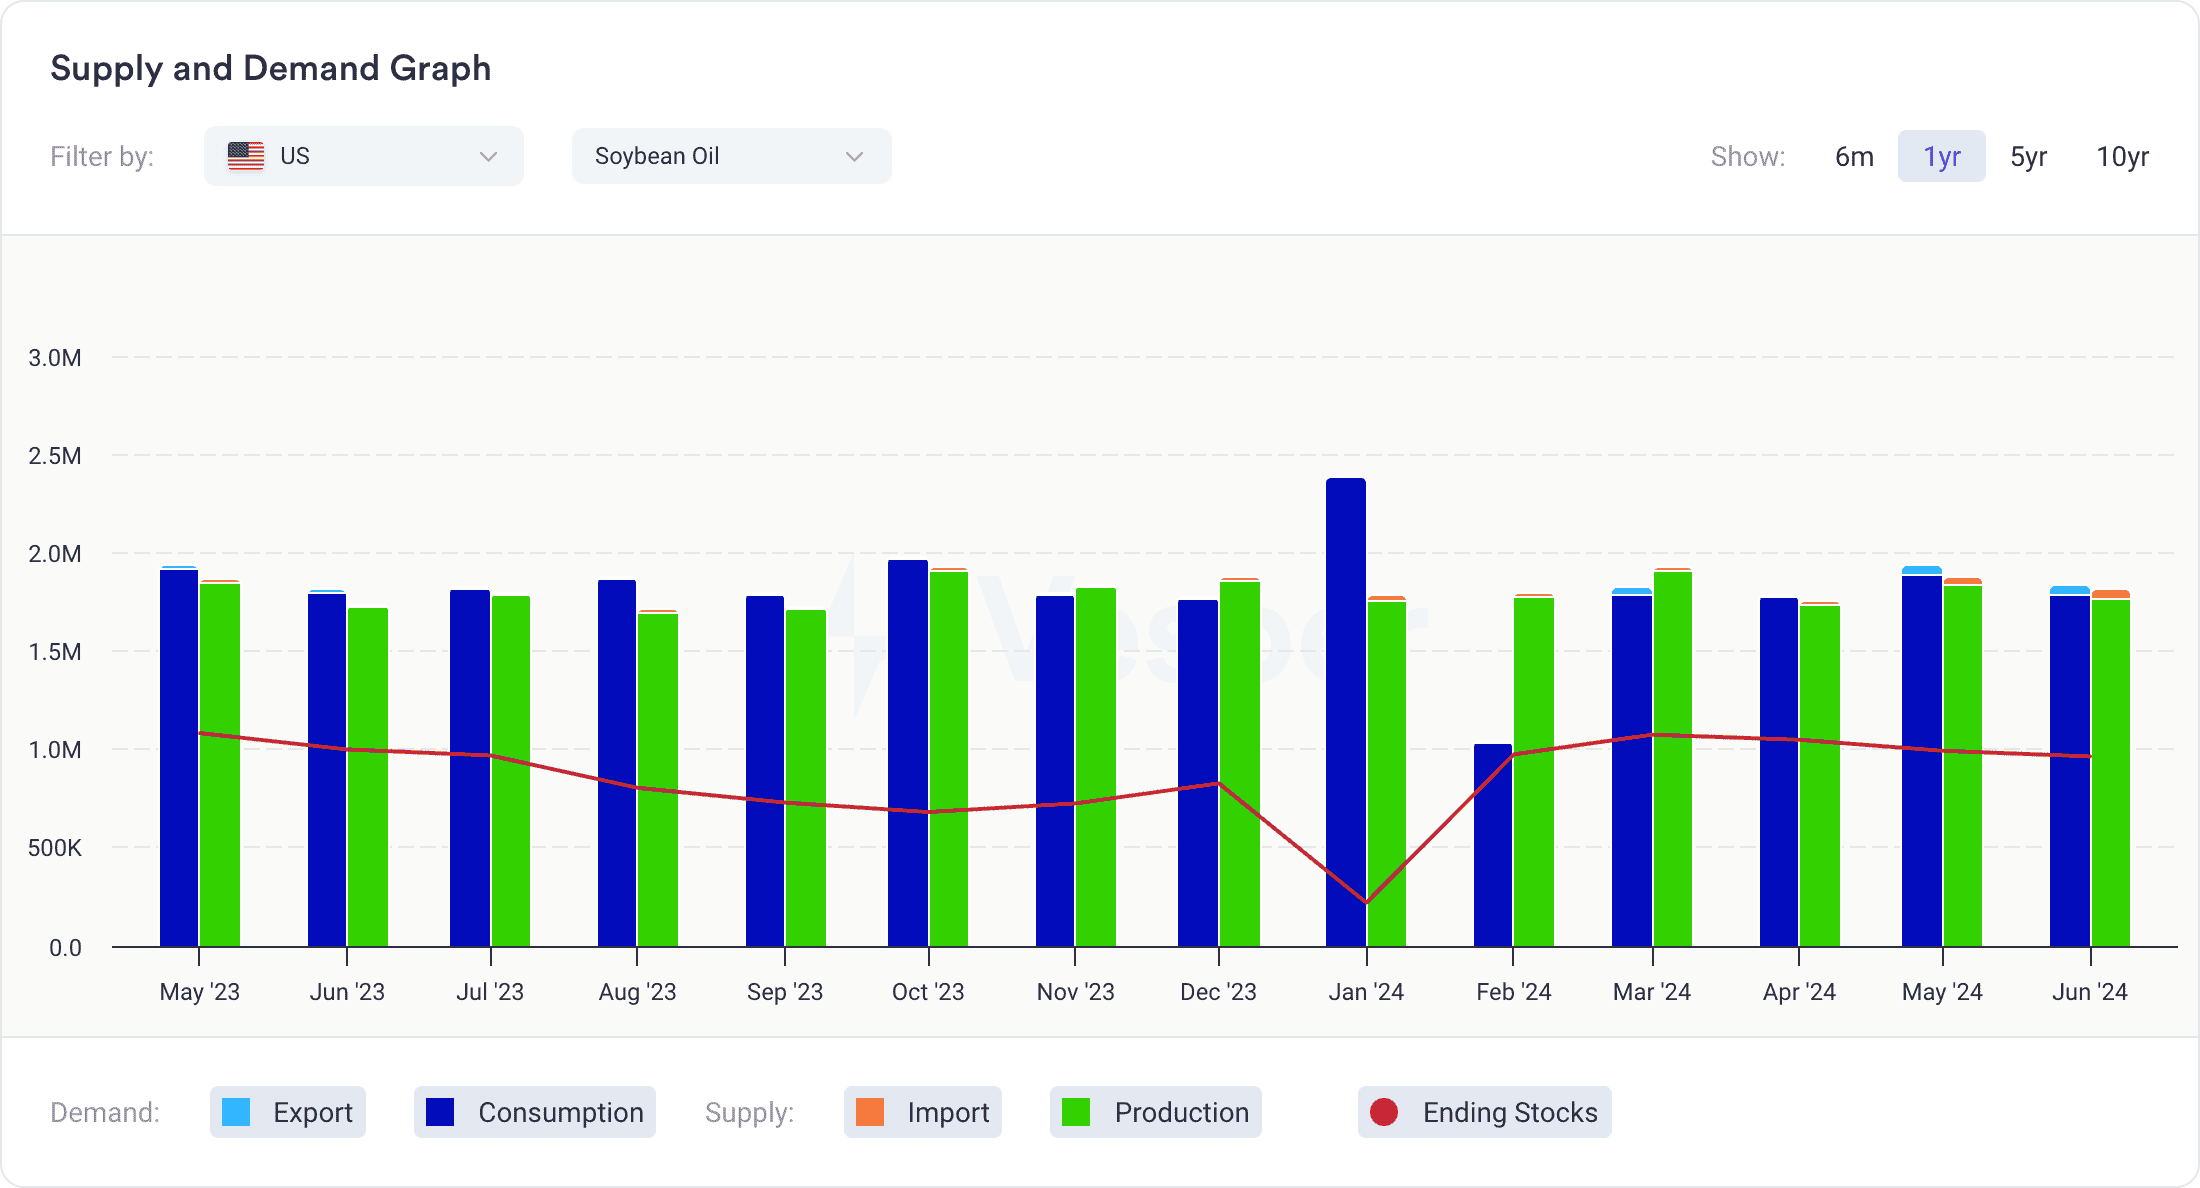
The graph below serves as an excellent example of how vegetable oil supply and demand data can be visualized, using U.S. soybean oil data from the past year as a reference.
TIP: Visit Vesper’s Oils & Fats product page to explore our comprehensive oils and fats data and insights.
Supply
Production: The green bars represent the total production output of soybean oil each month. Monitoring these production levels is essential for assessing the capacity of U.S. producers to meet both domestic and international demand. As seen in the graph, production remains relatively stable throughout the year, with slight fluctuations that reflect seasonal variations and changes in agricultural yield.
Import: The orange slivers at the top of each bar indicate the volume of soybean oil imported into the U.S. This import data is critical for understanding the role of external supply sources in the U.S. market. Imports become particularly important when domestic production does not meet demand, necessitating supplementation from international markets. In this graph, imports are minimal, suggesting that U.S. production is largely self-sufficient with limited reliance on external sources.
Demand
Consumption: The blue bars represent the total quantity of soybean oil consumed within the U.S. during each month. Consumption trends are relatively consistent, with noticeable peaks, particularly in January 2024, which could correspond with increased demand during the winter season or specific market events. This steady consumption pattern highlights the ongoing demand for soybean oil in various sectors, including food production and industrial uses.
Export: The light blue bars, integrated within the blue consumption bars, depict the volume of soybean oil exported from the U.S. to international markets. These export figures are crucial for understanding global demand and the role of the U.S. in balancing local production with international consumption needs. The graph shows that exports are a consistent part of the U.S. soybean oil market, although the volume appears stable with no significant spikes.
Ending Stocks
Ending Stocks: The red line represents the ending stocks of soybean oil at the close of each month. This line is vital for assessing market balance—whether supply is exceeding demand or vice versa. A declining trend in ending stocks, as seen over the course of the year, indicates that demand may be outpacing supply, which could lead to tighter market conditions and potential price increases if the trend continues.
What are the Main Drivers of Oils & Fats Supply and Demand Fluctuations?
Understanding the factors that drive fluctuations in the supply and demand of oils and fats is crucial for predicting market trends and making informed decisions. These fluctuations are influenced by a variety of factors, which can broadly be categorized into the following main drivers:
Seasonal Production Variability
Weather and Climate Conditions: The production of oilseeds, such as soybeans, palm, and sunflower, is highly dependent on weather conditions. Factors like temperature, rainfall, and extreme weather events such as droughts or floods can significantly impact crop yields. For instance, adverse weather conditions during key planting or harvesting periods can lead to reduced oilseed production, which in turn affects the availability of vegetable oils.
Input Costs and Availability
Seed and Fertilizer Prices: The cost and availability of inputs like seeds, fertilizers, and pesticides directly influence the production cost of oilseeds. When these input costs rise, it can reduce the profitability of oilseed cultivation, leading to lower production volumes. Conversely, lower input costs can encourage higher production, thereby increasing the supply of vegetable oils.
Labor and Equipment Costs: The cost and availability of labor and agricultural equipment also play a role in determining production levels. Higher labor or equipment costs can lead to reduced planting areas or less intensive farming practices, affecting overall output.
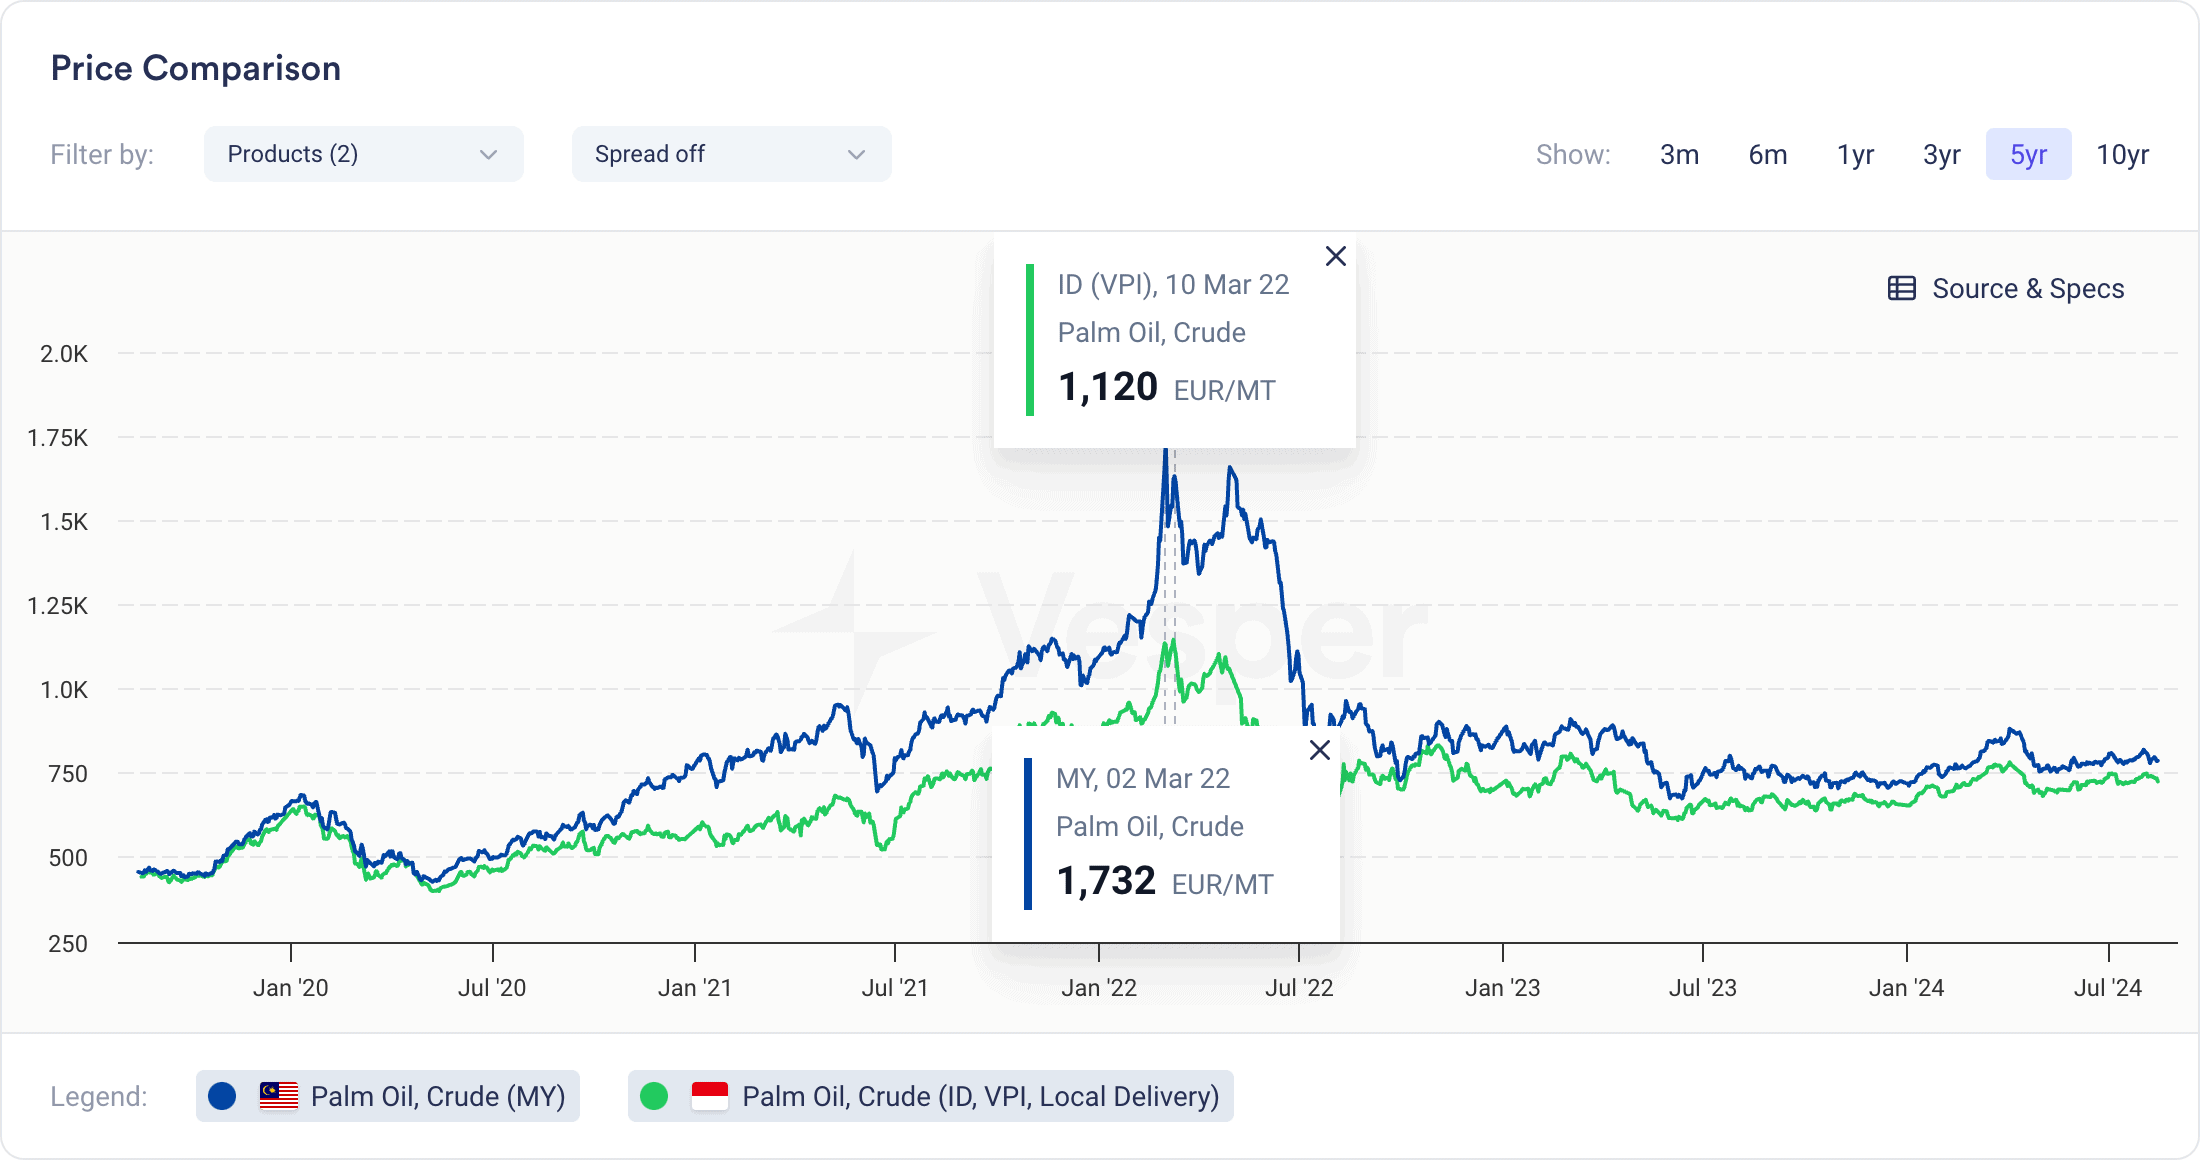
In March 2022, for instance, palm oil prices saw an unprecedented surge, with Malaysian prices exceeding 1,700 EUR/MT and Indonesian prices hitting 1,120 EUR/MT. This spike was fueled by labor shortages, logistical challenges, and rising demand. The extreme price increase surprised many market participants and highlighted the vulnerability of global supply chains to disruptions.
Global Market Demand
Food Industry Requirements: The demand for vegetable oils is closely tied to the food industry, where these oils are used in cooking, food processing, and manufacturing. Shifts in consumer preferences, such as increased demand for healthier oils like olive or sunflower oil, can significantly influence overall demand.
Biodiesel Production: The demand for vegetable oils used in biodiesel production is another critical driver. As policies supporting renewable energy sources become more widespread, the demand for oils like soybean and palm oil, which are key feedstocks for biodiesel, increases, affecting overall market dynamics.
Trade Policies and Tariffs
Import/Export Regulations: Changes in trade policies, such as tariffs, quotas, and export restrictions, can either restrict or expand access to global markets. These changes directly impact the supply and demand for oils and fats.
Geopolitical Events: Geopolitical tensions, trade disputes, or sanctions can significantly disrupt global trade in vegetable oils, leading to imbalances in supply and demand. These disruptions often cause considerable price volatility in the market.
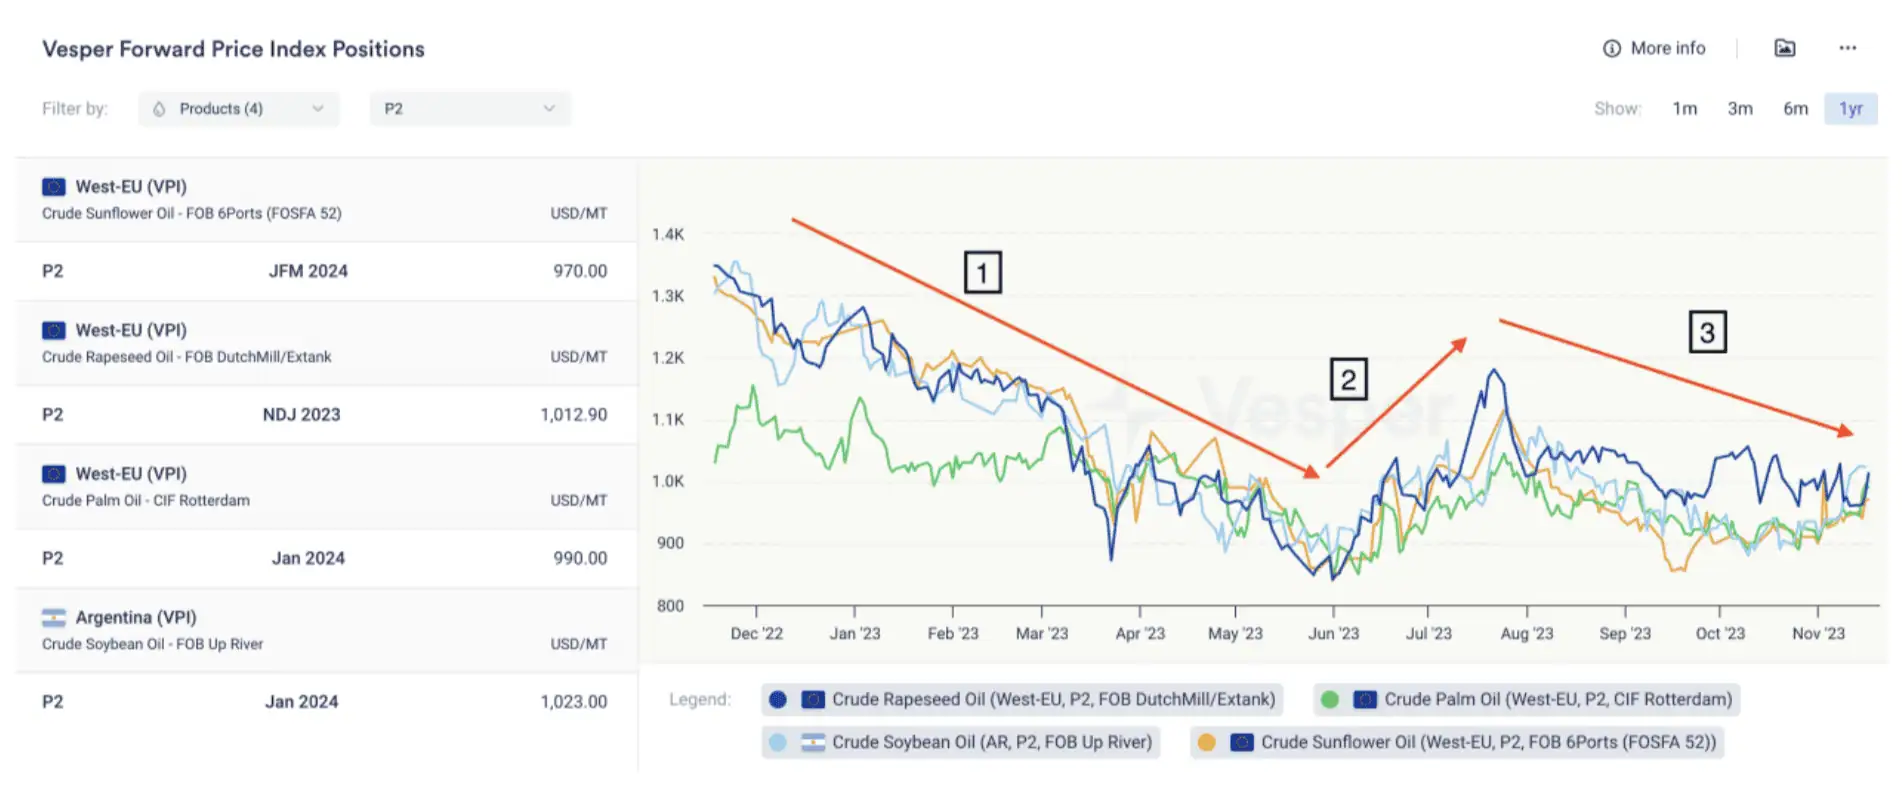
In the figure below, the second price shift, which began in June and continued through late July, reflects an upward trend in prices which coincided with Russia’s withdrawal from the Black Sea Grain Deal on July 17, 2023, followed by drone strikes on Ukraine’s river ports. Additionally, the Indonesian government’s introduction of a mandatory 35% biodiesel blending mandate (B35) on August 1st increased domestic palm oil demand, further driving up global prices.
Global Supply Chain Disruptions
Natural Disasters and Pandemics: Global supply chain disruptions, such as those caused by natural disasters or pandemics, can have profound effects on the oils and fats market. Events like the COVID-19 pandemic exposed vulnerabilities in global supply chains, leading to shortages in both raw materials and finished products. These disruptions can lead to sudden and sharp fluctuations in supply and demand, creating challenges for producers, traders, and consumers alike.
How Global Vegetable Oil Supply and Demand Affect Local Markets: A Case Study of China’s Biodiesel Dumping in Europe
The dynamics of global vegetable oil supply and demand have profound effects on local markets, with the European biodiesel sector offering a prime example through the case of China’s biodiesel dumping. Starting in 2023, the European market saw a significant influx of biodiesel imports from China at exceptionally low prices—a practice widely recognized as dumping. This surge of cheap Chinese biodiesel had immediate and far-reaching consequences for the European market.
Impact on European Biodiesel and Vegetable Oil Prices
The influx of low-cost biodiesel from China led to a marked decrease in European biodiesel prices. By early 2023, this downward pressure had also extended to vegetable oil prices, which are integral to biodiesel production, as illustrated by the sharp decline of arrow 1 in the figure below.
Regulatory Response from the European Union
In an effort to protect the local market from the detrimental effects of this dumping, the European Commission announced on July 19, 2024, that it would impose provisional anti-dumping duties on imports of Chinese biodiesel and renewable diesel. These duties, set to be enforced by mid-August 2024, ranged from 12.8% to 36.4%. This move was aimed at leveling the playing field for European producers by mitigating the impact of unfair pricing practices.