What is an Oils and Fats Price Index, and Why is it Important?
The Oils and Fats Price Index is an aggregate measure that tracks the prices of various vegetable oils and fats across different markets. It serves as a key indicator for industry stakeholders—producers, traders, buyers, and policymakers—offering insights into market trends and price movements.
Each stakeholder uses the index for different purposes: buyers leverage it to negotiate better prices, while sellers use it to benchmark their selling prices and ensure competitiveness. Despite these varied uses, the index is published with a common goal: to enhance market transparency and provide accurate data that helps navigate the global oils and fats market effectively.
Understanding the Basics of an Oils and Fats Price Index
The Oils and Fats Price Index is typically calculated by aggregating prices of various vegetable oils and fats, such as soybean oil, sunflower oil, coconut oil, and olive oil.
These prices are monitored across different geographical regions—ranging from specific countries to entire continents—providing a comprehensive view of the global market. The index helps to standardize prices by converting them into common metrics such as metric tonnes, liters, or pounds, and it often presents benchmarks in different currencies to accommodate the diverse needs of stakeholders worldwide.
How to Assess the Reliability of an Oils and Fats Price Index/Benchmark?
Assessing the reliability of an Oils and Fats Price Index or benchmark is crucial for making informed decisions, whether you’re involved in trading, procurement, or analysis within the industry. Here are some key factors to consider when evaluating the reliability of such indices:
1. Data Source and Transparency
Source of Data: The reliability of a price index is significantly influenced by the sources of the data it uses. Reputable indices usually gather data from a diverse group of market participants, including buyers, sellers, and traders, to gain a more comprehensive understanding of the market.
Transparency: Reliable indices should be transparent about their data collection methods, including the frequency of updates and the markets they cover. Transparency ensures that users understand how the prices are derived, which is essential for evaluating the index’s accuracy and reliability.
2. Methodology
Calculation Method: The methodology behind how the index or benchmark is calculated is vital. A reliable index should use a well-documented, consistent, and robust methodology that accurately reflects market conditions. This includes how the data is weighted, how outliers are handled, and how adjustments are made for market anomalies.
Periodic Reviews and Adjustments: The methodology should be periodically reviewed and adjusted to reflect changes in the market, such as shifts in trade flows, changes in major producing regions, or the introduction of new products.
3. Frequency of Updates
Timeliness: The frequency with which the index is updated is another critical factor. Markets for oils and fats can be volatile, with prices changing rapidly due to factors like weather conditions, geopolitical events, and shifts in supply and demand. A reliable index will update its prices frequently enough to capture these changes, providing users with timely and relevant information.
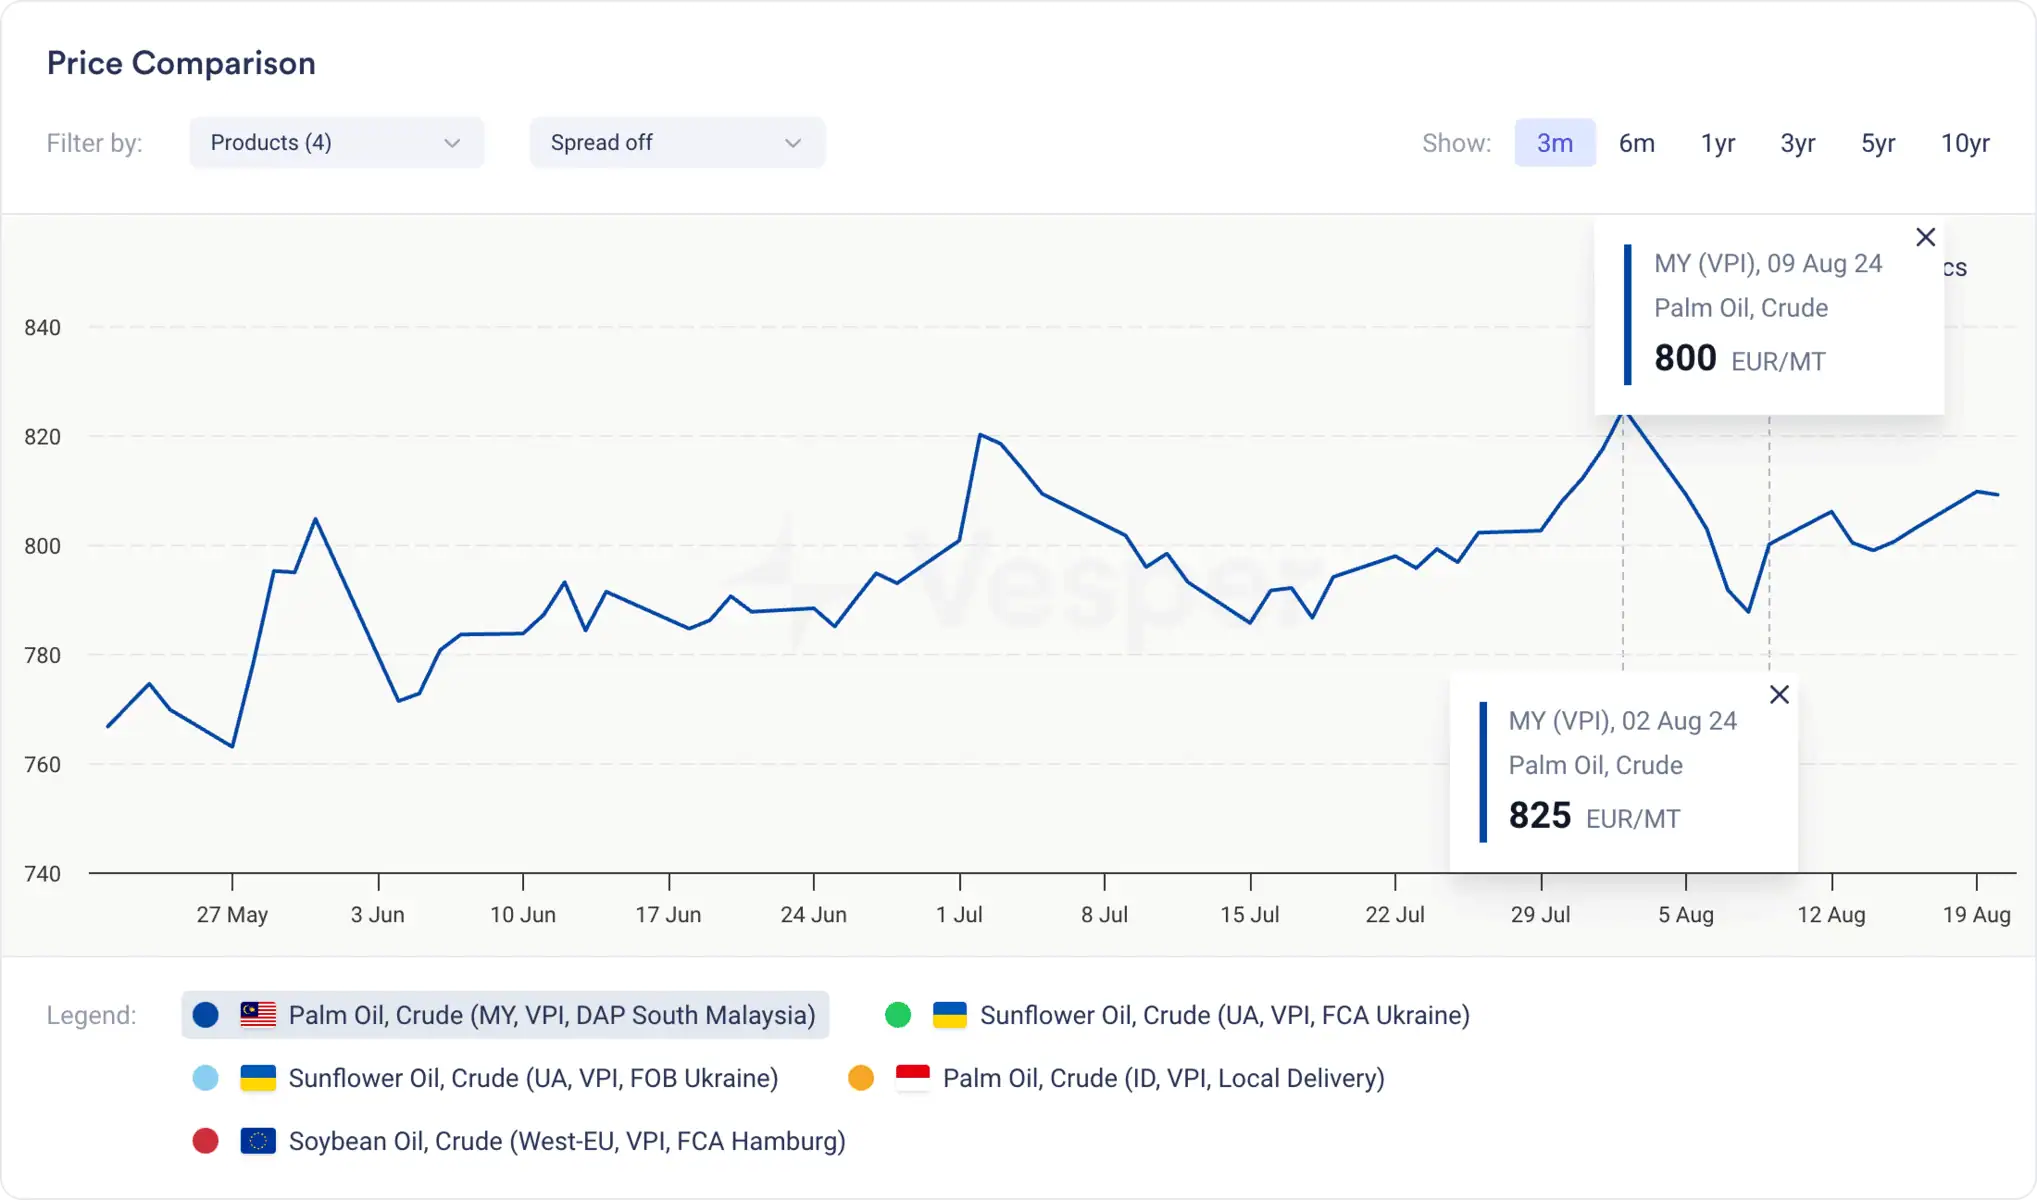
For instance, as seen in the figure below, the Vesper Price Index (VPI) on Vesper’s Commodity Intelligence platform demonstrates the importance of timely updates. In just a few days, the price of crude palm oil decreased by almost 50 EUR/MT, from 825 EUR/MT on 2 August 2024 to 788 EUR/MT by 8 August 2024. Without access to an updated benchmark like this, you might not realize that you’re overpaying for your commodities or selling your products for too little, potentially leading to significant financial losses. This rapid shift underscores the necessity of having access to frequently updated benchmarks to stay informed and make informed decisions in such a dynamic market.
4. Independence and Objectivity
Independence: The organization providing the index should be independent, with no vested interests in the prices being reported. This ensures that the index is free from bias and manipulation.
Reputation: The credibility and reputation of the institution behind the index also play a role. Established organizations with a history of providing accurate and objective data are generally more reliable.
5. Correlation with Other Indices
Cross-Validation: A reliable price index should correlate well with other established indices or benchmarks in the oils and fats sector. By comparing the index with others, users can gauge its accuracy and consistency. Significant deviations might indicate potential issues with the data or methodology.
6. User Feedback and Industry Acceptance
Feedback Mechanism: A reliable index provider often has mechanisms for user feedback, allowing market participants to report discrepancies or suggest improvements. This engagement helps maintain the index’s accuracy and relevance.
Industry Acceptance: Finally, the level of acceptance and usage of the index within the industry is a good indicator of its reliability. Indices widely used by traders, analysts, and other stakeholders tend to have proven their reliability over time.
How is the Oils and Fats Price Index Used as a Benchmark for Contracts? Spot vs. Forward Pricing
When negotiating contracts in the vegetable oils and fats market, both spot and forward price indices play a crucial role as benchmarks. These indices serve as reference points for buyers and sellers, helping them agree on fair prices for commodities that are either immediately available or scheduled for future delivery.
Spot Prices as Benchmarks
Spot prices represent the current market value of a commodity, reflecting the price at which a transaction can occur immediately. These prices are influenced by real-time supply and demand dynamics, offering a clear snapshot of the market’s present condition.
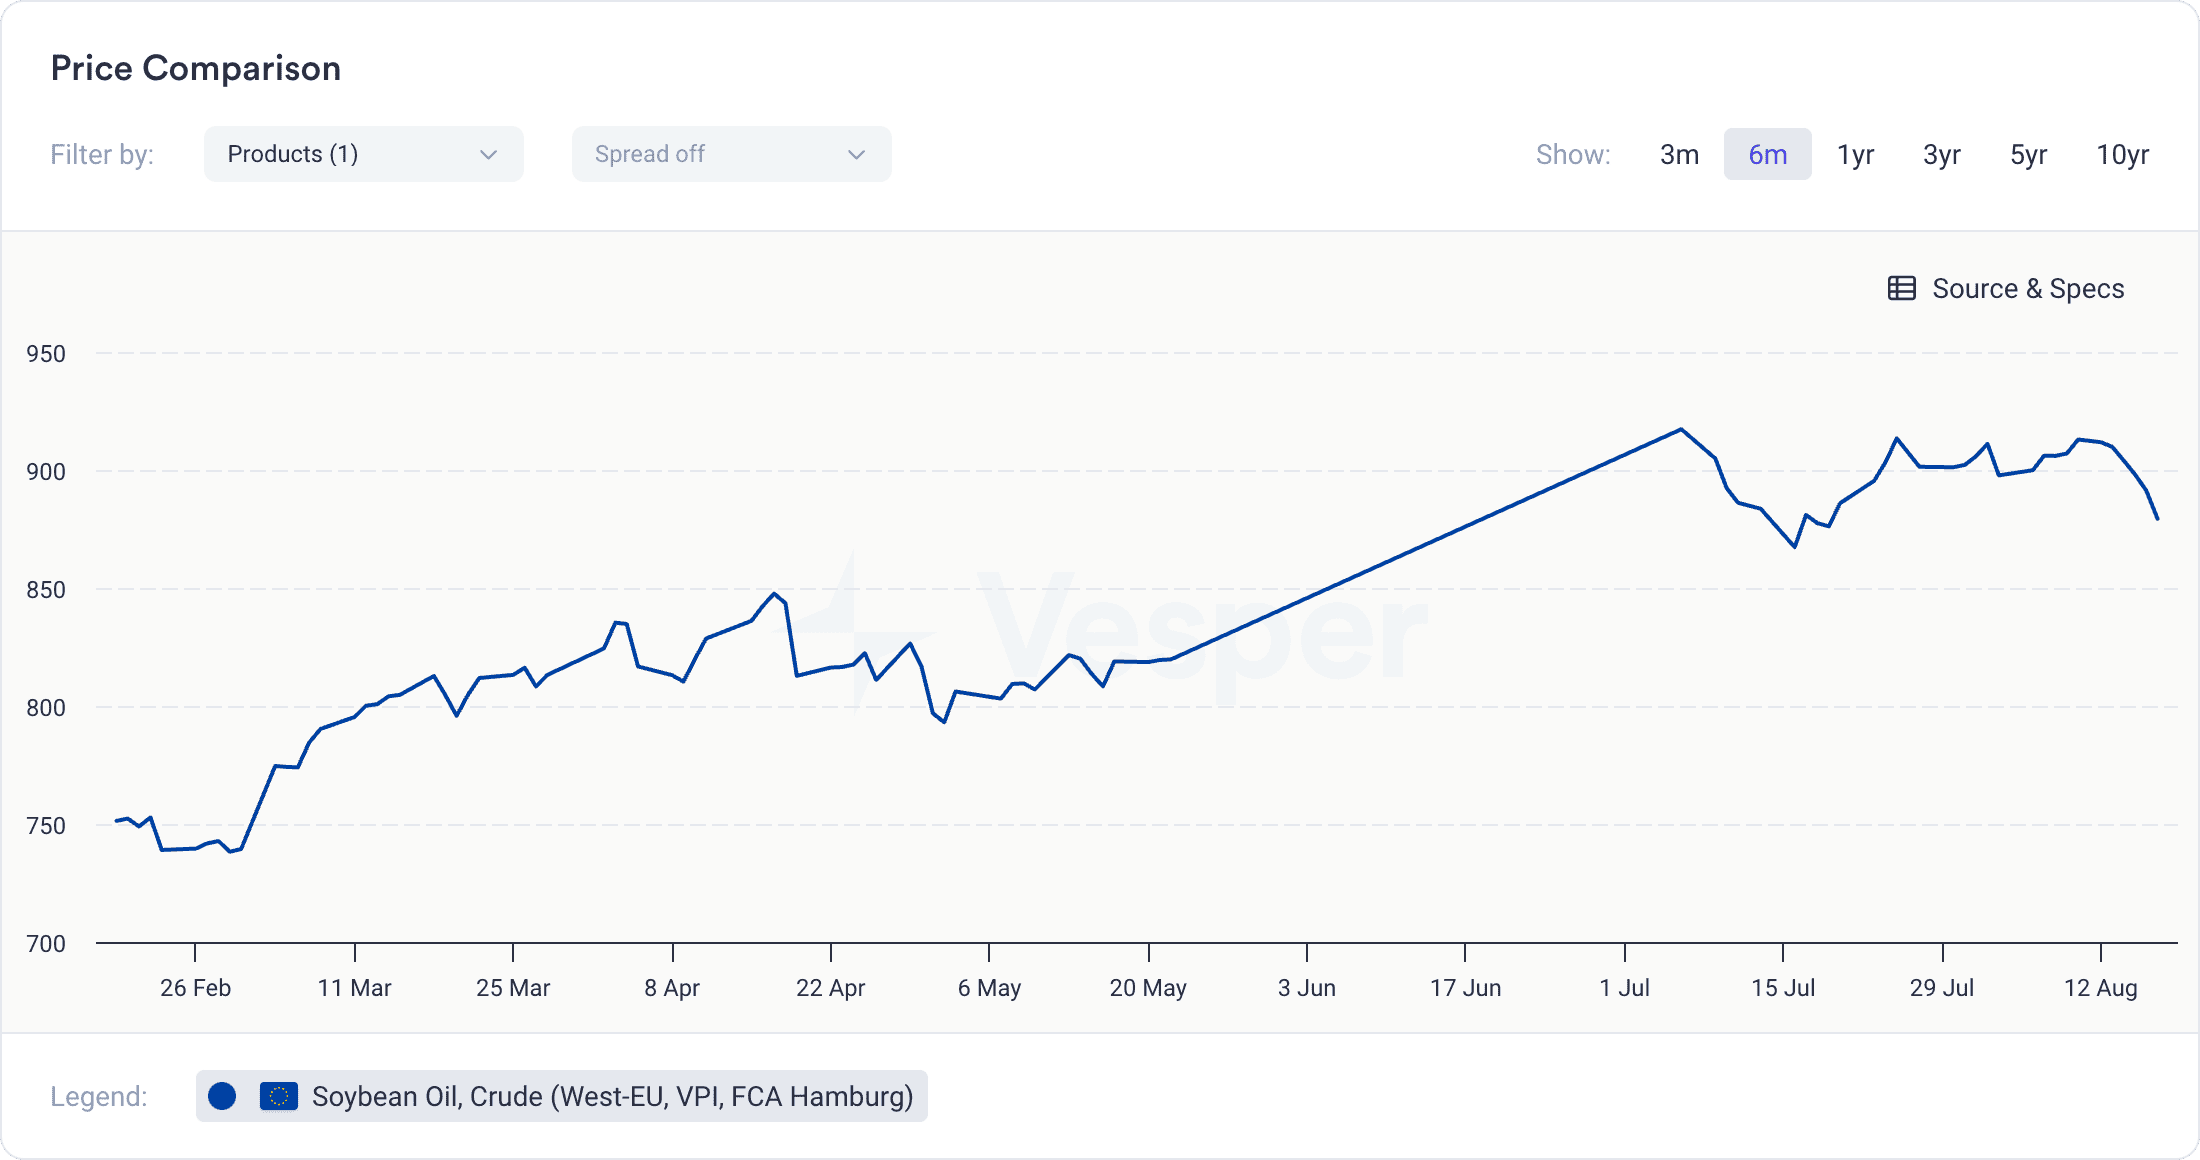
In the figure below, for instance, we observe the price trend for crude soybean oil in the West EU market from February 2024 to August 2024, according to Vesper’s Price Index. The price steadily increased from around 750 EUR/MT in March 2024 to over 900 EUR/MT by August 2024. This rise reflects the underlying market conditions during this period, such as potential shortages or heightened demand. When setting up contracts for immediate delivery, both buyers and sellers would refer to this index to ensure that their transaction reflects the current market reality, thereby avoiding overpayment or underselling.
Forward Prices as Benchmarks
Forward prices, on the other hand, are agreed upon for transactions that will take place at a future date. These prices incorporate expectations about future market conditions, including potential risks and fluctuations. By locking in a price today for a future transaction, both parties can hedge against uncertainties such as changes in supply, transportation costs, or market demand.
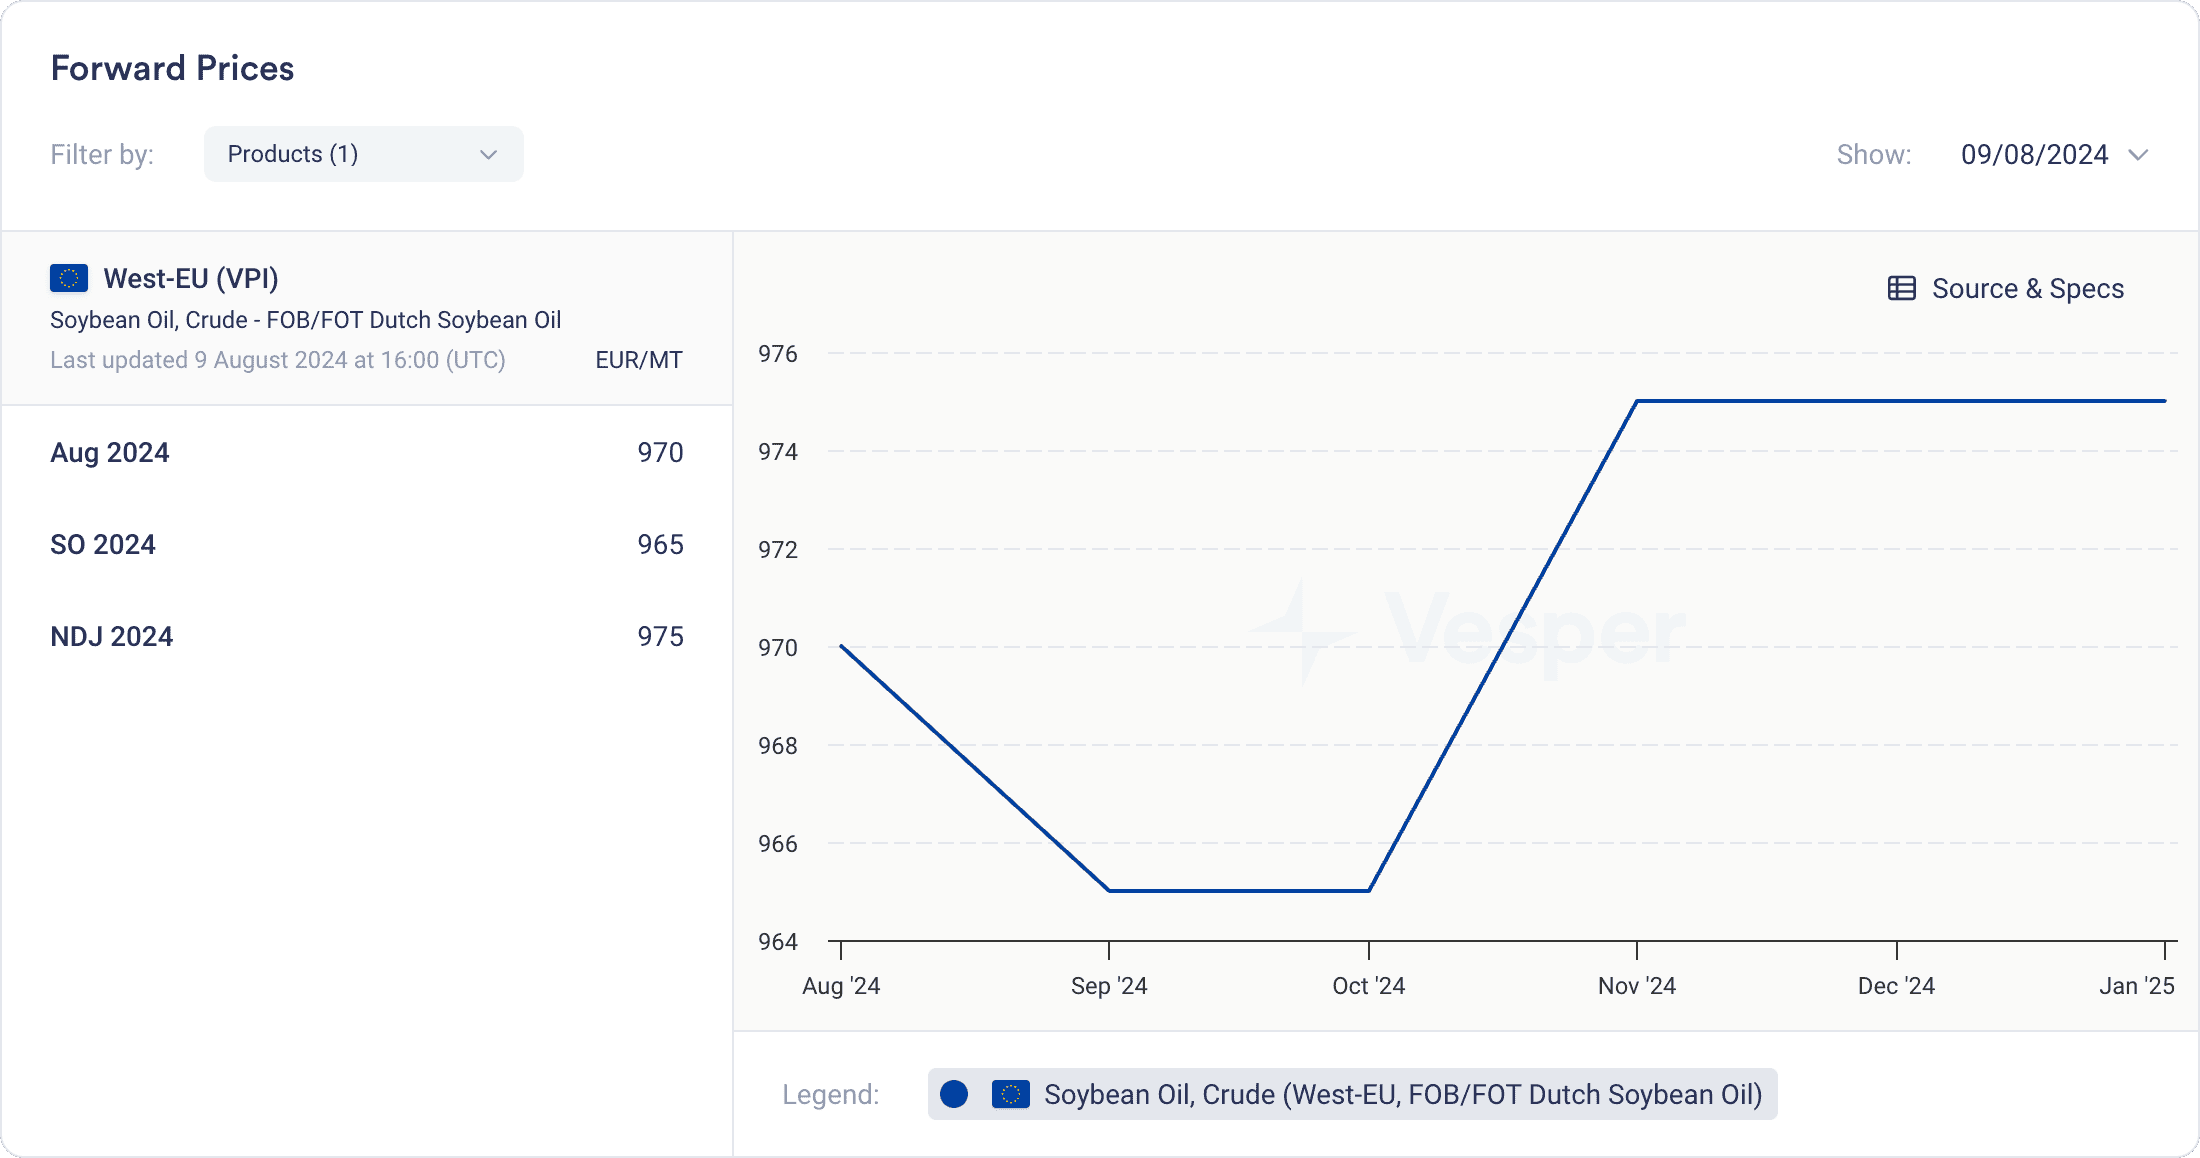
In the figure below, the prices for crude soybean oil (West EU) are displayed for three different future periods: August 2024, September-October 2024, and November-December-January (NDJ) 2024, according to Vesper’s Forward Pricing Index. The prices show a slight decrease from 970 EUR/MT in August to 965 EUR/MT in the September-October period, before rising again to 975 EUR/MT for the NDJ period. This forward pricing reflects market expectations about future conditions, such as seasonal fluctuations or anticipated changes in global supply chains. When a food company, for example, wants to secure a price for delivery in several months, they would use this forward index to agree on a price today, mitigating the risk of price increases in the future.
FAQ
What role does the Oils and Fats Price Index play in risk management?
The Oils and Fats Price Index helps businesses hedge against price volatility by providing a benchmark for setting contracts and assessing market trends, thereby reducing the risk of unexpected price fluctuations.
How can the Oils and Fats Price Index strengthen negotiation power?
The Index offers objective, data-driven insights into market prices, enabling buyers and sellers to negotiate more effectively based on real-time pricing trends.
How can historical oils and fats price benchmarks help in predicting future market trends?
Historical benchmarks reveal patterns and cycles in the market, which can be analyzed to forecast future price movements and trends, aiding in strategic decision-making.
How can businesses use an Oils and Fats Price Index to optimize their procurement strategies?
By monitoring the Index, businesses can time their purchases to coincide with favorable market conditions, locking in lower prices and improving cost efficiency.
What are the key factors influencing an Oils and Fats Price Index?
Key factors include supply and demand dynamics, geopolitical events, currency exchange rates, energy prices, and seasonal production cycles.
Curious about our pricing benchmarks for oils and fats? Start a free trial or request a personalized demo to experience our data and insights firsthand.