What is Historical Vegetable Oils and Fats Data?
Historical vegetable oils and fats data encompasses comprehensive records and metrics related to the production, trade, consumption, and pricing of various vegetable oils and fats over time. This data includes a wide array of variables, such as production volumes, price movements, weather patterns, biodiesel demand, and trade dynamics.
Why is Historical Data Important in the Vegetable Oils and Fats Industry?
By analyzing historical data, stakeholders in the vegetable oils and fats industry can identify trends, understand market drivers, and make informed decisions. Below, we explore how different stakeholders can leverage this data to enhance decision-making and optimize business outcomes.
1. For Buyers
Historical data is crucial for buyers as it helps them forecast prices and time their purchases to secure better rates. Additionally, by understanding historical trends, buyers can anticipate potential supply disruptions, helping them mitigate risks by diversifying sources or stockpiling inventory.
2. For Sellers
Sellers benefit from historical data by using it to understand market demand cycles and adjust pricing strategies, maximizing revenue during peak periods. It also informs production planning, aligning output with market demand to avoid overproduction or shortages. Moreover, historical data enables sellers to benchmark their performance against competitors, identifying areas for improvement in market positioning.
3. For Traders
For traders, historical data is essential for predicting market movements and timing trades for maximum profitability. It helps identify arbitrage opportunities by analyzing price discrepancies between different markets or regions. Furthermore, traders use historical data to develop risk management strategies, preparing for market reactions based on past events, which allows them to manage their positions more effectively.
What Historical Data Points are Most Valuable for Decision-Making in the Oils and Fats Sector?
1. Historical Price Trends between Various Vegetable Oils
Many vegetable oils can be substituted for one another in various applications, including cooking, food processing, and biodiesel production. For instance, if the price of palm oil rises significantly, buyers may switch to soybean oil, which can drive up the demand and price of soybean oil. This substitutability creates a competitive market where the prices of these oils are closely linked.
The image below illustrates the price trends of soybean oil (represented by the blue line) and crude palm oil (represented by the green line) over the past six months, along with the spread between the two (highlighted in pink). The spread is an important metric because it reflects the relative cost difference between these two major vegetable oils.
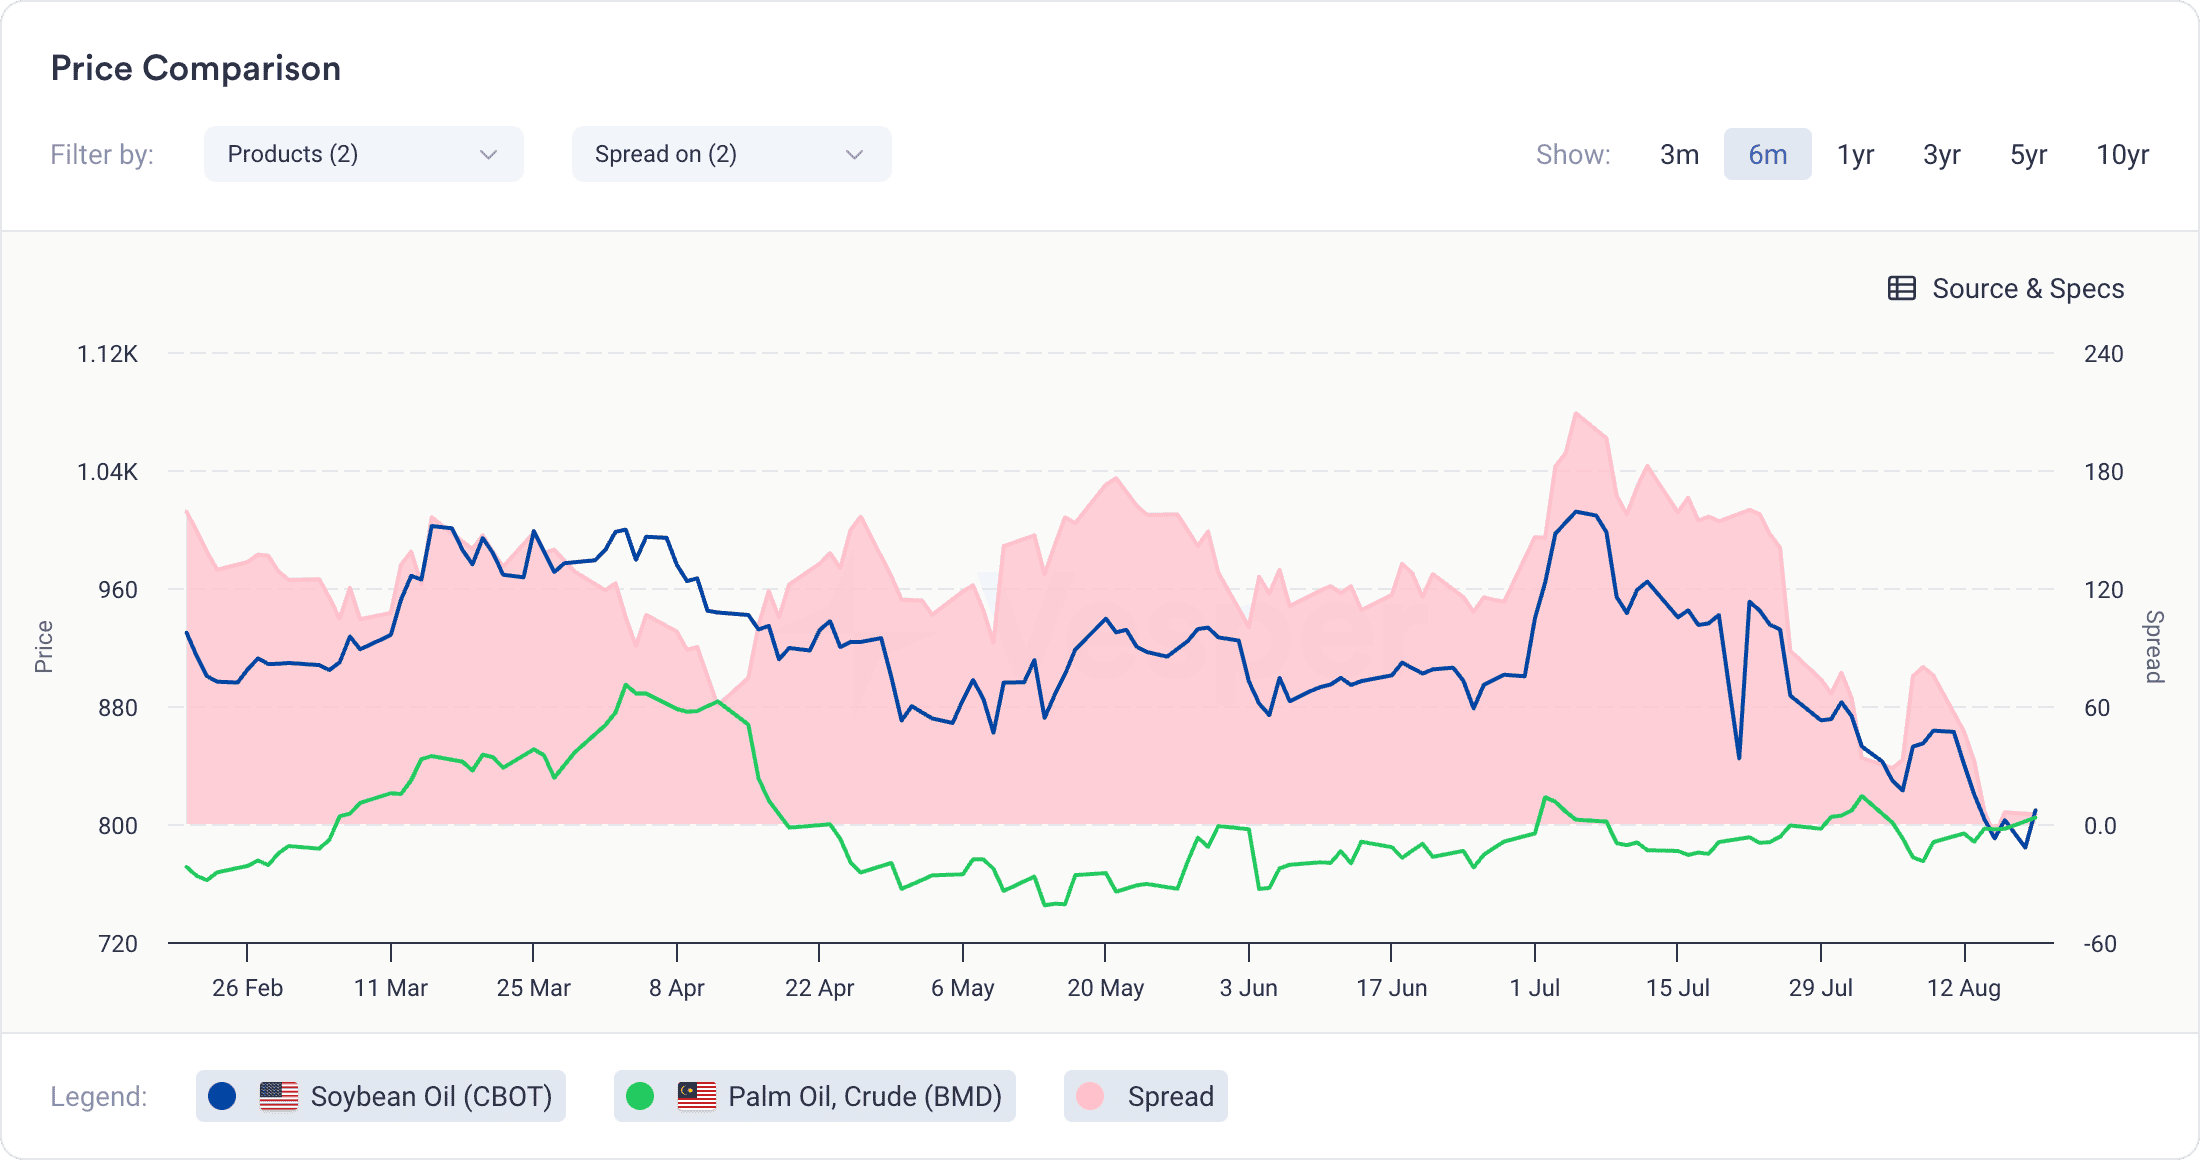
When the spread is large, meaning the price of one oil is significantly higher than the other, buyers are more likely to switch to the cheaper alternative. For example, if soybean oil is considerably more expensive than palm oil, as indicated by a wide spread, manufacturers might shift to using palm oil in their products to save on costs. This shift in demand can then lead to adjustments in the market, potentially raising the price of palm oil due to increased demand, and stabilizing or even reducing the price of soybean oil as demand for it drops.
2. Historical Price Trends between Vegetable Oils and Brent Crude Oil
The relationship between Brent crude oil prices and vegetable oils, particularly in the context of biodiesel production, is crucial. Historical crude oil data is significant because it directly influences the demand for vegetable oils as feedstock for biodiesel. When crude oil prices are high, biodiesel becomes a more attractive alternative, leading to increased demand for vegetable oils and, consequently, pushing their prices up.
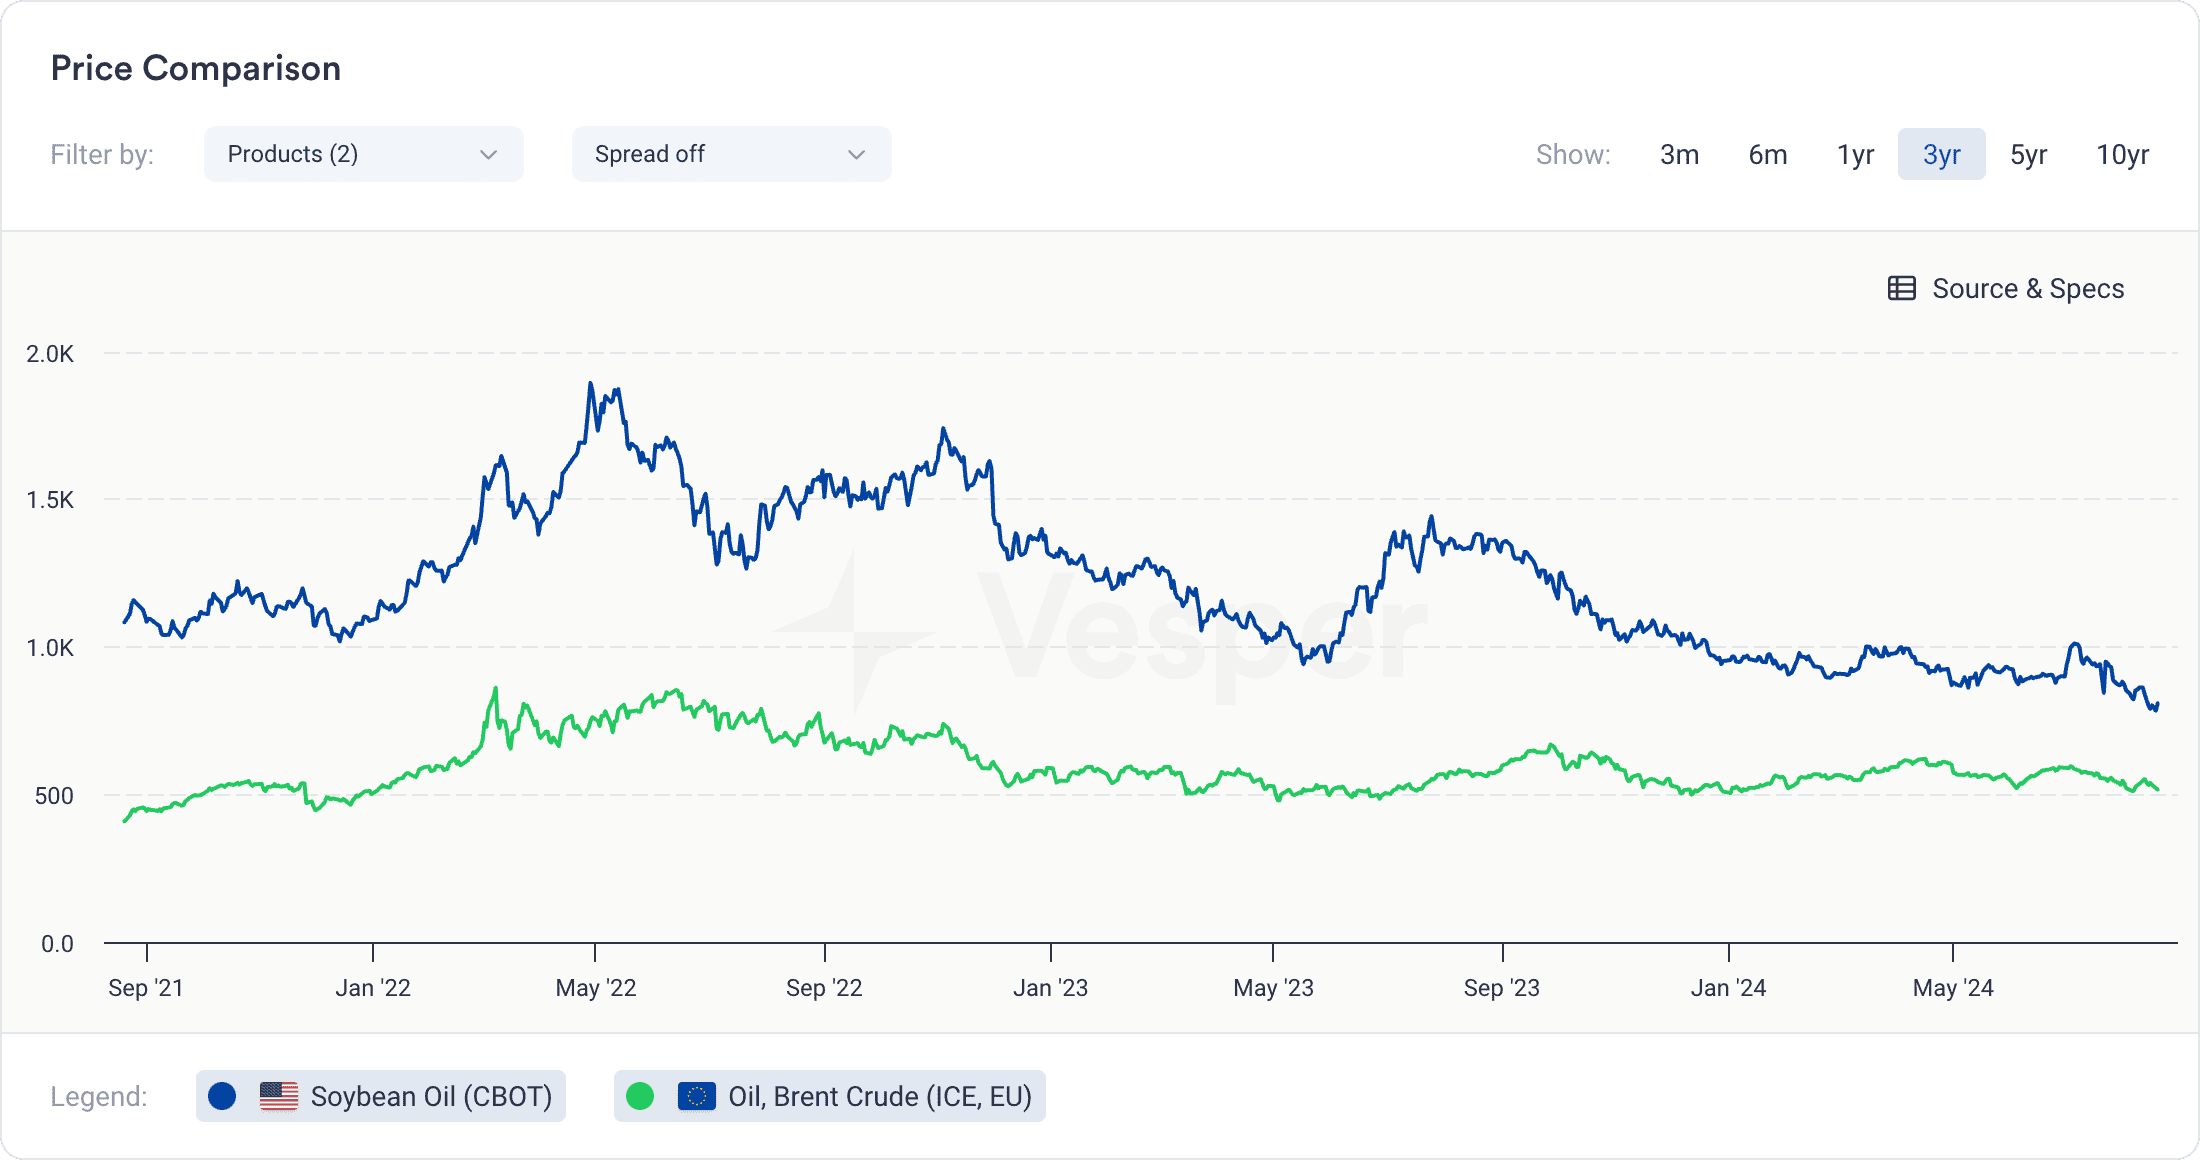
The image below illustrates this relationship over a three-year period, comparing the prices of soybean oil (blue line) and Brent crude oil (green line). The graph shows that soybean oil prices tend to rise when Brent crude prices increase, reflecting the higher demand for biodiesel as a substitute for conventional diesel fuel. This correlation underscores the importance of monitoring crude oil prices when analyzing the vegetable oil market, particularly for those involved in biodiesel production and trading.
3. Historical Oils and Fats Production and Yield Data
By examining the yields of oilseeds such as palm fruit, soybeans, and sunflower seeds across different regions and time periods, stakeholders gain valuable insights into productivity trends. This data also sheds light on the impact of weather patterns, which is essential for anticipating future supply levels.
Another key data point is historical production volumes. By tracking production volumes by country and region, industry participants can better understand global supply dynamics. This information is particularly important when considering the influence of major producing countries like Indonesia, Malaysia, and Brazil. Together, these historical data points offer a comprehensive view of past production trends, enabling more accurate predictions and strategic planning for the future.
4. Historical Weather and Climate Data
Historical weather and climate data play a pivotal role in understanding and forecasting the impacts on crop yields and price volatility in the oils and fats sector. Past weather patterns, particularly events like El Niño and La Niña, provide valuable insights into potential future supply disruptions.
For instance, El Niño, characterized by warmer Pacific sea surface temperatures, often results in drier conditions in Southeast Asia, which can severely affect palm oil production in countries like Malaysia and Indonesia. A notable example is the 2015-2016 El Niño, during which Malaysia’s palm oil production dropped by 15-20% due to extended dry seasons that stressed oil palm trees, leading to a nearly 25% surge in palm oil prices.
Similarly, La Niña, associated with cooler Pacific sea surface temperatures, has historically triggered droughts in key soybean-producing regions such as Brazil, Argentina, and the United States. In 2012, a severe La Niña-induced drought led to an 8% decline in U.S. soybean production, which, coupled with similar declines in South America, caused soybean prices to spike by over 30%. These examples underscore the importance of long-term climate data, including rainfall patterns, temperature changes, and extreme weather events, for assessing risks to production and making informed strategic decisions regarding crop planting and harvesting.
5. Consumption and Demand Data
Historical data on global and regional consumption patterns of oils and fats are essential for understanding demand growth, shifts in consumer preferences, or seasonal demand fluctuations. This also includes data like import/export volumes, which help in understanding global trade flows and dependencies.
The figure below shows a clear trend in China’s soybean oil import demand linked to seasonal fluctuations, particularly around the Chinese New Year.
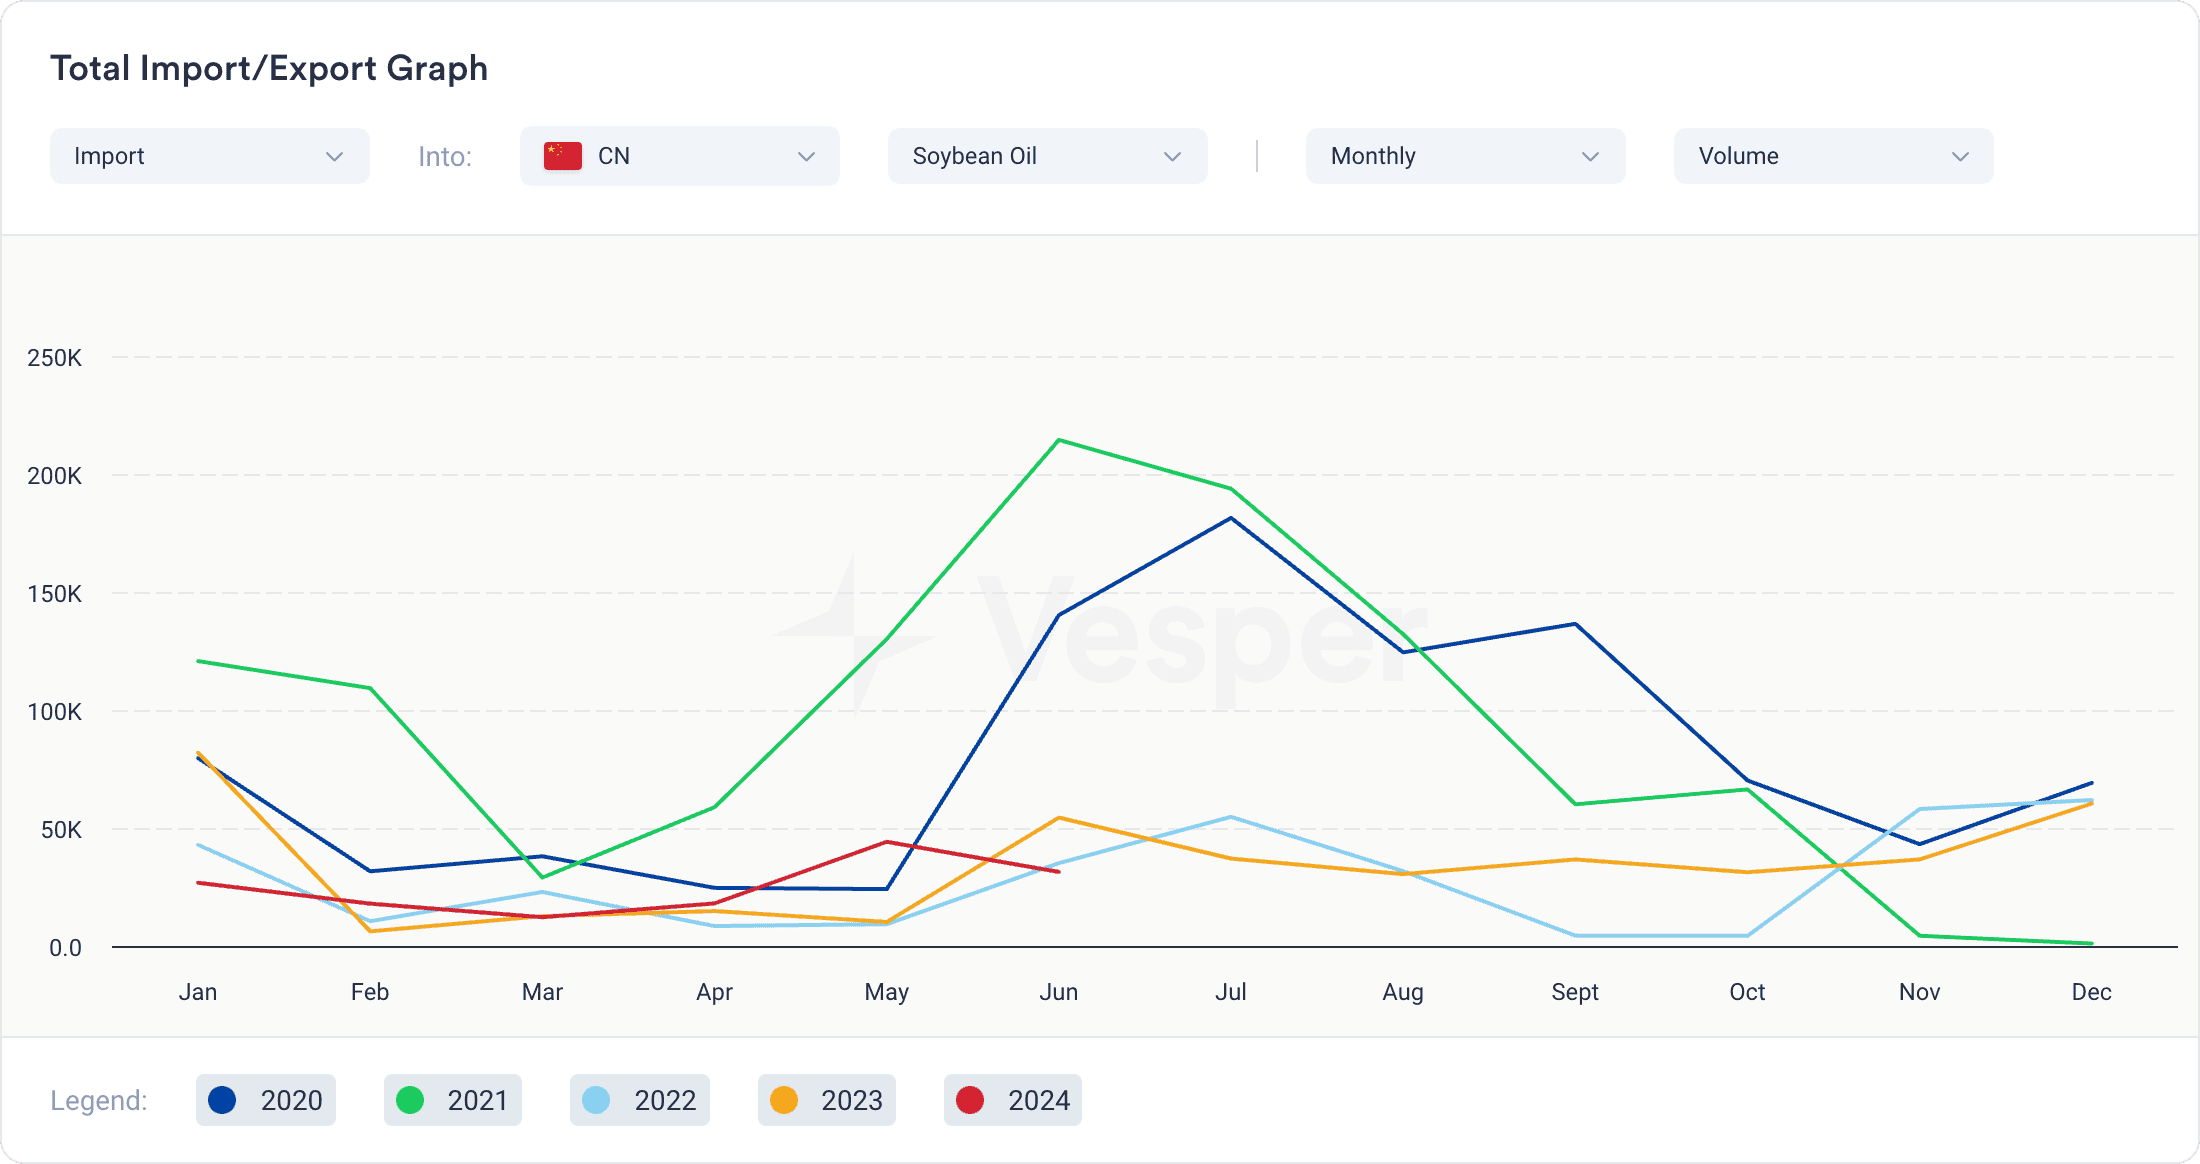
- Early Year Dip: Imports typically decline in January and February, coinciding with the Chinese New Year when business activities slow down.
- Mid-Year Increase: Imports rise significantly from April to June as industries recover post-New Year and prepare for increased mid-year consumption.
- End-Year Stability or Increase: Imports stabilize or slightly increase from October to December, likely due to preparations for the winter season and the upcoming New Year festivities.
Data on recurring demand spikes, such as those during the Chinese New Year, Ramadan, or the celebration of Diwali, can help in planning inventory and pricing strategies.
Curious about our historical data for oils and fats? Start a free trial or request a personalized demo to explore our comprehensive insights and see the data in action.