Grain commodities such as corn, oats, wheat, and barley have been fundamental to the agricultural industry and global food supply for centuries. Understanding their historical data is crucial for traders, producers, and policymakers alike. The examination of historical grain data reveals not only the fluctuations in prices but also the key factors influencing production, import/export volumes, and market behavior. In this article, we will dive into the long-term trends in grain production, analyze historical grain prices, and discuss how global weather patterns and policies have shaped the market.
Long-Term Trends in Grain Production and Yields
Grain production has witnessed significant growth over the past decades due to advancements in agricultural technologies, better farming practices, and a response to increasing global demand. Key grains like corn, wheat, and oats remain essential for food, animal feed, and biofuels. According to data from the USDA, U.S. corn production has increased by over 68% from 2000 to 2020, making it one of the fastest-growing grain sectors globally.
Similarly, wheat production in the United States has maintained steady growth despite challenges. From 2000 to 2024, wheat yields have risen, with winter wheat accounting for nearly 70% of total U.S. wheat production, reflecting its dominance in food consumption.
Innovations in Agricultural Practices
Over the years, improvements in seed technology, particularly through genetic modifications (GMOs) and hybrid seeds, have significantly contributed to increased yields. These technologies have made crops more resilient to adverse conditions like drought and pests, resulting in better overall productivity. For example, corn yields have more than doubled in some regions over the past 20 years due to these innovations.
Precision agriculture has further optimized grain production, allowing farmers to use inputs such as fertilizers and water more efficiently. This has led to sustained yield improvements, even in regions that face environmental challenges like erratic weather patterns and soil degradation.
Pricing Trends and Regional Fluctuations
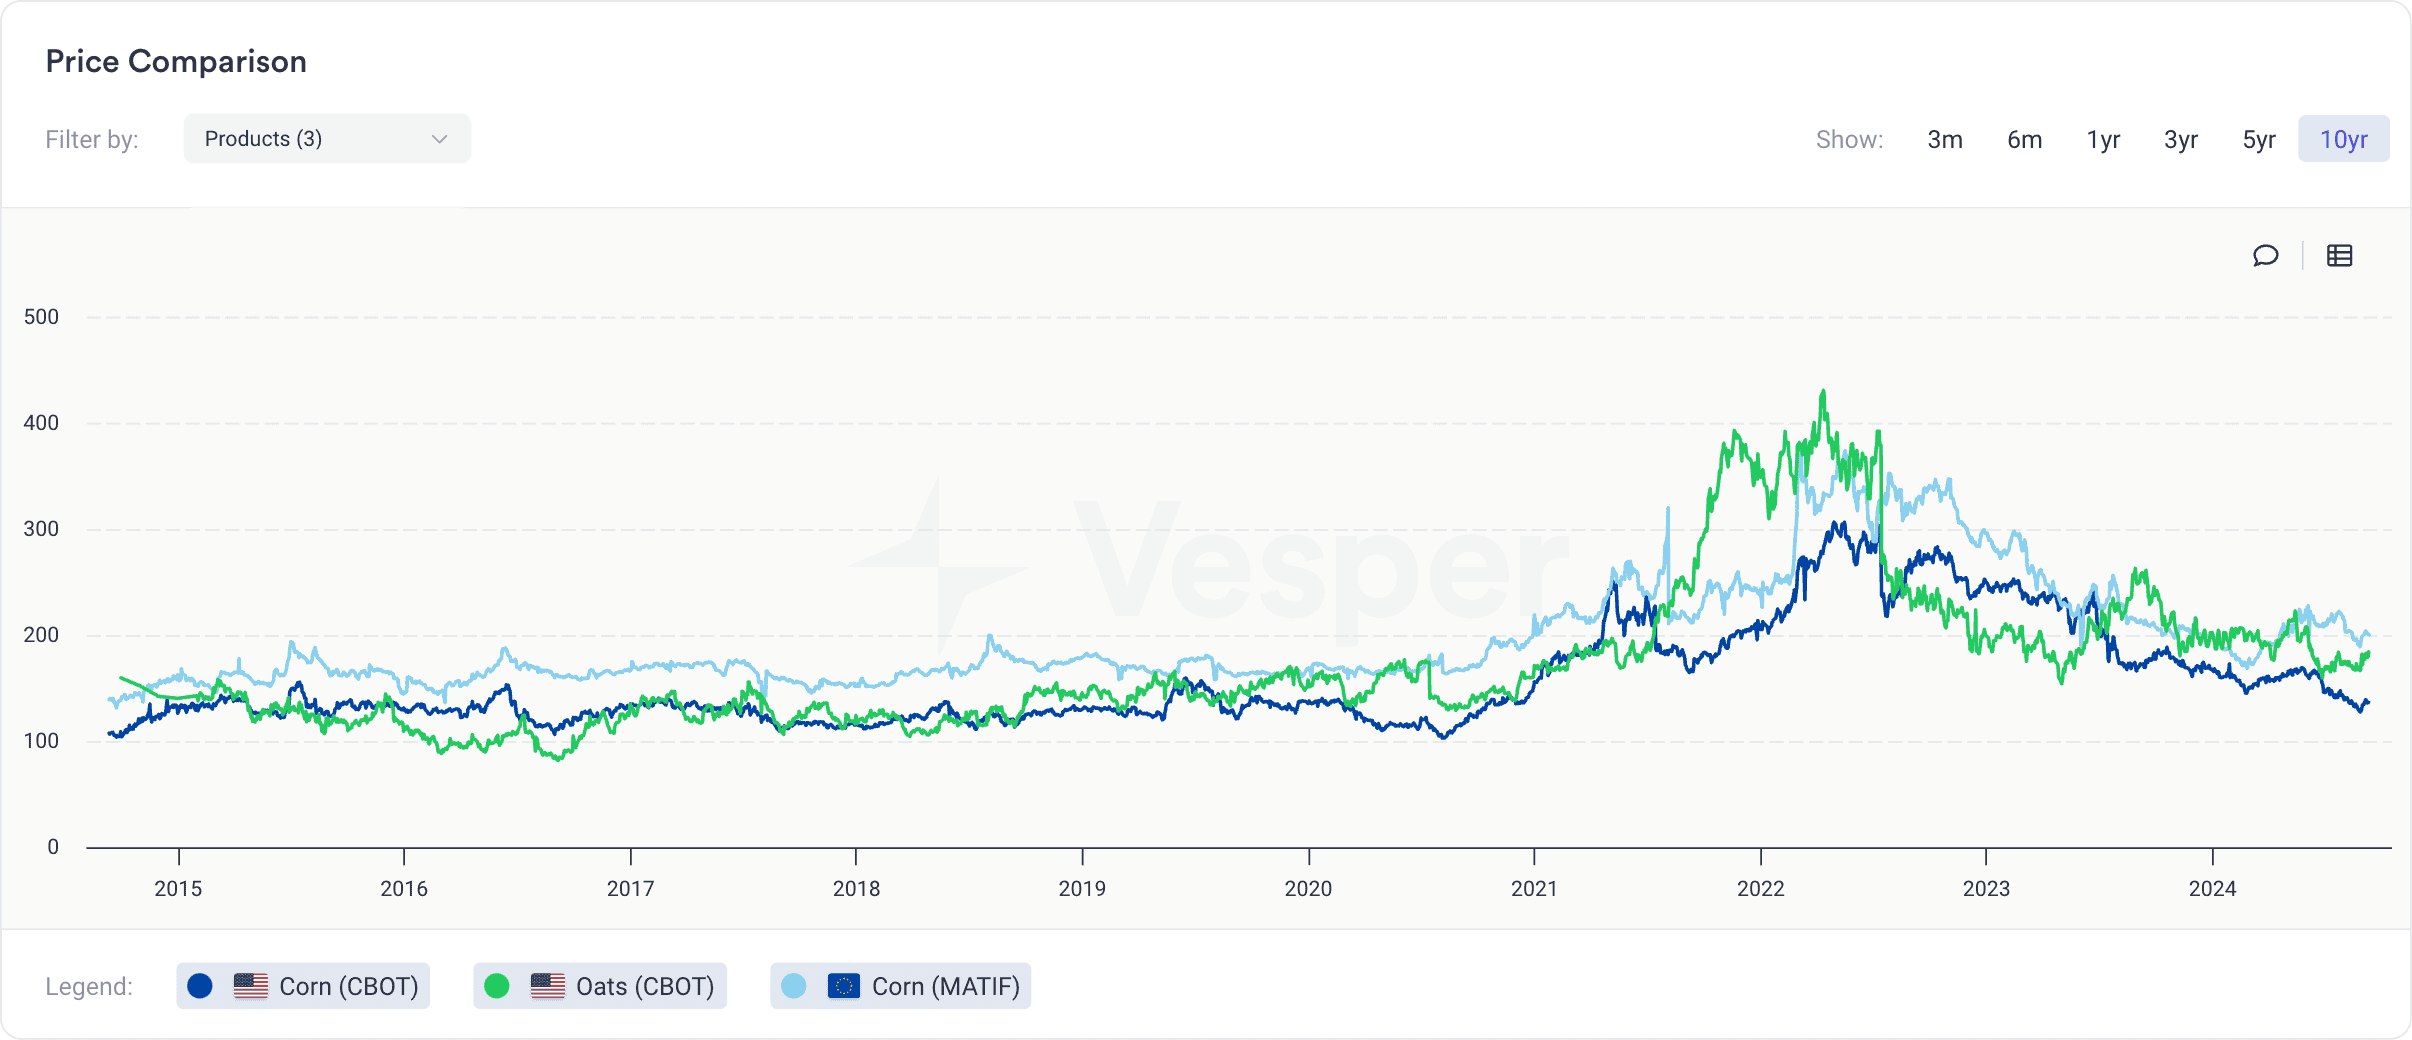
Grain prices, however, have not followed a steady upward trend. They are largely influenced by supply-demand dynamics and external factors like weather, trade policies, and geopolitical tensions. For example, corn prices surged in 2020 due to supply chain disruptions caused by the COVID-19 pandemic, as well as high demand for biofuels, as shown in the price comparison widget from Vesper below.

Moreover, geopolitical tensions, such as the Russia-Ukraine conflict in 2022, significantly impacted grain prices. Both countries are key producers and exporters of grains like wheat and corn. As the conflict disrupted supply chains and reduced global grain exports, prices surged.
Similarly, wheat prices spiked in 2022 during the Russia-Ukraine conflict, as both countries are major global exporters. Data from USDA shows that wheat prices increased by 15-20% in 2023 due to the ongoing impacts of this geopolitical conflict, which disrupted global trade flows and reduced supplies from key exporting regions.
Major Factors Influencing Historical Grain Import/Export Volumes
Grain trade volumes have been shaped by a wide range of factors, including population growth, changing diets, weather events, and, of course, trade policies. Over the last several decades, regions like the Middle East, North Africa, and Southeast Asia have experienced rising grain imports due to their inability to produce enough grains to meet domestic demand. Countries like the United States, Brazil, and the European Union remain key grain exporters that supply these regions.
The following are real-life examples of major events that had a substantial impact on global grain trade volumes:
- U.S.-China Trade War (2018-2020):
One of the most prominent recent examples of disrupted grain trade occurred during the U.S.-China trade war, which began in 2018. China, the world’s largest importer of soybeans, imposed retaliatory tariffs on U.S. agricultural products, including grains like soybeans and corn. As a result, U.S. exports to China plummeted, and U.S. soybean farmers were particularly hard-hit, with exports to China dropping by over 75% in 2018. This led to a massive surplus of soybeans in the U.S., causing domestic prices to fall and forcing farmers to store excess crops in silos. Brazil stepped in to fill the gap, significantly increasing its soybean exports to China, reshaping global grain trade flows. - The Black Sea Grain Initiative (2022-2023):
Another significant example is the impact of the Russia-Ukraine conflict, which severely disrupted global wheat exports. Ukraine, known as the “breadbasket of Europe,” is one of the world’s top exporters of wheat and sunflower oil. When the conflict escalated in 2022, it became impossible for Ukraine to continue its usual export activities through the Black Sea, where much of its grain is transported. This caused wheat prices to spike globally, with an increase of up to 40% in certain markets.
In response, the United Nations and Turkey brokered the Black Sea Grain Initiative, which allowed limited grain exports from Ukrainian ports. This initiative helped stabilize prices temporarily, but ongoing disruptions in the region continued to influence wheat availability globally. - COVID-19 Pandemic:
The global COVID-19 pandemic also had a considerable impact on grain trade volumes. Lockdowns and restrictions disrupted supply chains, including transportation and labor shortages, which affected the production and export of grains. For example, in 2020, U.S. corn exports fell sharply due to reduced demand from ethanol producers, who were impacted by lower fuel consumption during lockdowns. Additionally, export restrictions in some countries led to price increases in importing nations, further highlighting the vulnerabilities in global grain trade systems.
Impact of Global Historical Weather Patterns on Grain Production
Weather disruptions have always been a significant determinant of grain production and pricing. Droughts, floods, temperature extremes, and long-term climatic phenomena like El Niño and La Niña have repeatedly caused fluctuations in grain yields and subsequent price changes in global markets. Below are specific examples that illustrate the impact of these weather events on grain production and their resulting influence on prices.
1. The 2012 U.S. Drought
The 2012 drought is one of the most severe weather events to hit the U.S. grain belt in recent history. It affected nearly 80% of U.S. agricultural land, particularly in the Midwest, a critical region for corn and soybean production. The U.S. Department of Agriculture (USDA) reported that corn yields dropped by nearly 25% from their typical levels. As the world’s largest exporter of corn, the U.S. shortfall sent global corn prices skyrocketing, increasing by as much as 50% by the end of the year.
The price surge had a domino effect across various sectors reliant on corn, such as livestock feed and biofuel production, where rising input costs led to increased prices for beef, poultry, and ethanol. The U.S. drought also caused the FAO Food Price Index to increase sharply, triggering concerns about food security, especially in regions heavily reliant on U.S. grain exports.
2. Brazil’s 2020/2021 Growing Season Drought
Brazil, the world’s second-largest corn exporter after the U.S., experienced a severe drought during its 2020/2021 growing season. The drought affected Brazil’s key grain-producing regions, particularly impacting the production of its second corn crop, known as the safrinha. This crop typically accounts for nearly 75% of Brazil’s annual corn production.
Due to poor rainfall during critical growth stages, Brazil’s corn production fell by over 15%, resulting in reduced exports and driving corn prices to record highs both domestically and internationally.
With lower output from both the U.S. and Brazil, global corn supplies tightened, which drove prices up further. Brazil’s reduced corn output also led to significant price increases for livestock feed, which affected meat production costs globally.
3. El Niño and La Niña Events
The El Niño Southern Oscillation (ENSO) is another significant weather phenomenon that has historically impacted global grain production. El Niño typically leads to warmer and drier conditions in several grain-producing regions, including Southeast Asia, Australia, and parts of South America, which can reduce yields for crops like rice, wheat, and corn. During El Niño events, grain prices often rise due to decreased global supply.
For example, during the 2015-2016 El Niño, Australia, a key wheat exporter, experienced lower-than-average rainfall, reducing wheat yields and increasing prices globally. Similarly, Indonesia and the Philippines, major rice producers, saw reductions in rice output, leading to higher rice prices throughout Southeast Asia.
On the other hand, La Niña tends to bring cooler and wetter conditions. In some regions, such as the American Midwest, these conditions can enhance yields by providing sufficient moisture during the growing season. However, in other areas like parts of South America, La Niña can lead to excessive rainfall, causing flooding and crop damage. For instance, during the 2020-2021 La Niña, flooding in Argentina, another key corn and soybean producer, hampered crop production, leading to further tightening of global grain supplies and pushing prices higher.
4. The Russian Heatwave of 2010
The Russian heatwave of 2010 is another prime example of how extreme weather events can impact grain prices globally. Russia, one of the world’s largest wheat producers, experienced record high temperatures and widespread wildfires, which destroyed 30% of its wheat crop. In response, the Russian government imposed a ban on wheat exports to secure domestic supply. This export ban triggered a surge in wheat prices globally, with prices increasing by 60% over a few months.
Countries in the Middle East and North Africa, which rely heavily on Russian wheat imports, were particularly affected. The resulting high food prices contributed to social unrest in the region, highlighting how weather-induced production shortfalls can have far-reaching consequences beyond the agricultural market.
Key Policy Changes and Their Effects on Grain Prices and Production
Government policies have historically played a critical role in shaping grain markets. Agricultural subsidies, tariffs, and export restrictions can all influence grain production and prices. When countries implement export bans or restrictions, it can lead to significant price hikes on the global market. Below is an overview of key policy changes and their effects on grain prices and production:
- U.S. Farm Bill (1996, 2014):
The 1996 Farm Bill introduced “decoupling” policies, allowing farmers more flexibility in crop selection, which led to oversupply and lower grain prices. The 2014 Farm Bill expanded crop insurance, encouraging stable grain production despite market volatility.
Effect: These policies helped stabilize production but contributed to periods of oversupply, lowering prices globally. - India’s Export Ban (2007-2008):
India, one of the world’s largest rice producers, imposed an export ban on non-basmati rice to secure domestic supply during the global food crisis. This action caused rice prices to nearly triple globally.
Effect: The export ban caused a significant spike in global rice prices, increasing food insecurity in importing nations. - China’s Grain Stockpiling (2010s):
China stockpiled grains to ensure food security, purchasing at inflated domestic prices. When China began releasing these reserves, it flooded the global market and caused prices to drop.
Effect: Artificial price inflation followed by a market glut, causing price swings in global grain markets. - EU Common Agricultural Policy (CAP) Reforms:
CAP reforms aimed to reduce overproduction by decoupling subsidies from yields and shifting focus to environmental sustainability. This resulted in more stable grain prices within the EU but occasional reductions in supply.
Effect: Reduced oversupply and stabilized prices but sometimes limited production, leading to higher prices. - Ukraine’s Export Quotas (2020-2021):
Ukraine introduced grain export quotas during the COVID-19 pandemic, reducing wheat and corn supplies to global markets, which led to price increases.
Effect: Restricted supply from a major producer led to higher global prices for wheat and corn, worsening global food supply concerns. - U.S. Renewable Fuel Standard (RFS, 2005):
The 2005 Renewable Fuel Standard (RFS) mandated increased ethanol production, primarily from corn. This boosted corn demand significantly, leading to higher corn prices and shifts in planting patterns.
Effect: Corn prices surged by up to 60% between 2006 and 2008 due to increased demand for biofuels, impacting food prices globally and sparking debates on food vs. fuel.
The Value of Understanding Historical Grains Data
For industry professionals and market participants, understanding historical grains data is essential for making informed decisions. By examining long-term trends in production, prices, and trade, stakeholders can better anticipate future market movements and respond to disruptions in the supply chain. Additionally, keeping a close eye on policy changes and global weather patterns can help market participants navigate periods of volatility.