Grain prices can vary significantly across different regions and markets due to a complex web of factors. In this article, we’ll explore the main drivers behind these regional differences, look at current spot prices for major grains, and discuss how these prices compare domestically and internationally. Additionally, we’ll delve into the difference between organic and conventional grain prices and show how price comparison tools can be a game-changer for buyers and sellers.
Factors Driving Regional Differences in Grain Pricing
Several factors influence grain prices, including:
- Supply and Demand Dynamics: Grain prices fluctuate based on local and global supply and demand. If a particular region faces droughts or other climate challenges, this can lead to reduced grain supply and push prices higher. Conversely, bumper crops can lower prices when supply exceeds demand. For example, during the 2022 drought in Argentina, soybean production was severely impacted, which led to higher local prices due to reduced supply.
- Transportation Costs: The cost to transport grains from producing regions to consuming regions plays a significant role. Countries with easy access to export ports often have lower transportation costs, which can result in lower grain prices compared to landlocked regions. Grain prices in landlocked countries like Kazakhstan are often higher due to the additional cost of transporting grains to export ports, compared to countries like Brazil that have direct access to ports.
- Exchange Rates: The fluctuation of currency values can affect the price of grains, especially for countries that import grains. A weaker domestic currency means higher prices for imported grains, while stronger currencies make imports cheaper.
- Government Policies: Trade agreements, tariffs, and subsidies impact grain prices. Countries that impose tariffs on imported grains will see higher local prices as a result of the added cost. Similarly, subsidies for local grain production can lower domestic grain prices. India’s 2022 export ban on wheat to protect domestic supply led to a significant price increase in the global wheat market, as many countries scrambled to find alternative sources.
A Case Study on Regional Wheat Feed Price Differences
Understanding the factors that drive regional differences in grain pricing is essential for analyzing both domestic and international markets. These influences—ranging from supply and demand dynamics to transportation costs and government policies—create noticeable price gaps between regions. As we dive deeper into how domestic and international grain prices compare, it becomes clear that these key factors shape the landscape of global trade, offering both challenges and opportunities for buyers and sellers in different markets.
Now, let’s explore how these factors impact grain prices across regions, using a real-world example. The chart below from Vesper demonstrates these variations using feed wheat prices across key regions.
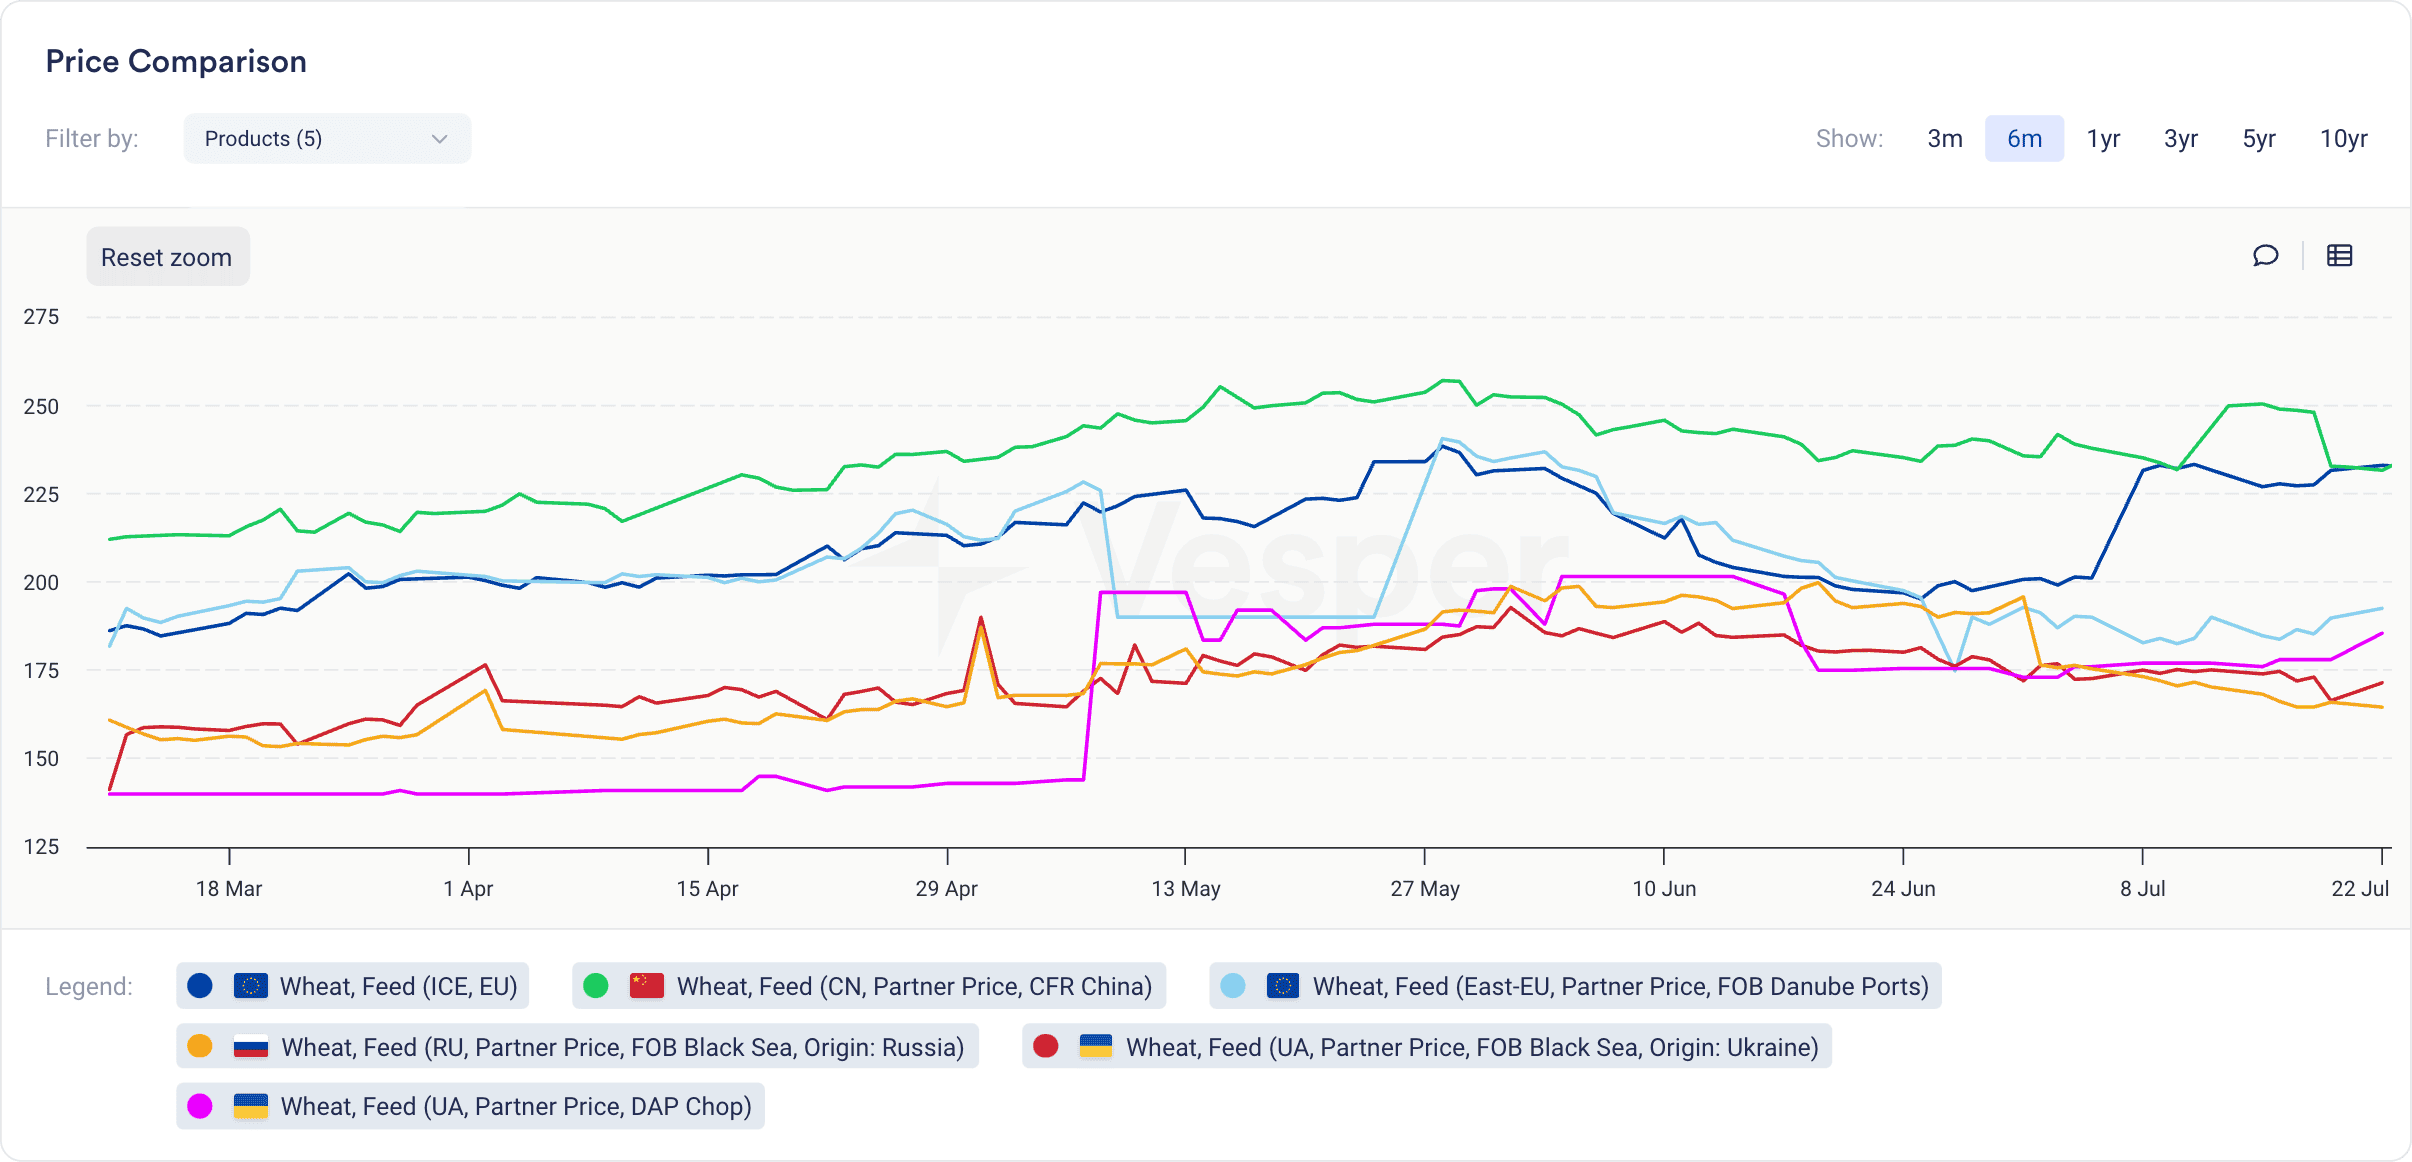
One striking difference is the higher wheat prices in China, driven by its growing demand for feed wheat due to the expanding livestock industry. However, domestic production in China often falls short of meeting this demand, especially for feed-quality wheat, pushing prices higher.
In contrast, Ukrainian wheat feed prices tend to be significantly lower. Ukraine, as one of the largest wheat producers globally, benefits from its vast, fertile land and abundant supply. Additionally, lower production costs—such as cheaper labor, land, and inputs like fertilizers—help keep prices competitive. The devaluation of the Ukrainian hryvnia further enhances Ukraine’s price competitiveness on the global market, as it becomes more affordable for foreign buyers.
Understanding these regional price differences helps buyers and sellers make informed decisions. They can capitalize on lower prices in certain areas or anticipate price fluctuations driven by local conditions and market forces.
Comparing Spot Prices Across Regions: Advantages for Buyers and Sellers
Spot prices for grains can vary widely depending on the region, reflecting the factors mentioned above. In key producing areas, like the U.S., Brazil, and China, these prices fluctuate based on local conditions.
Using corn as an example, the figure below from Vesper’s commodity intelligence platform provides a price comparison across various regions and exchanges over the past six months.
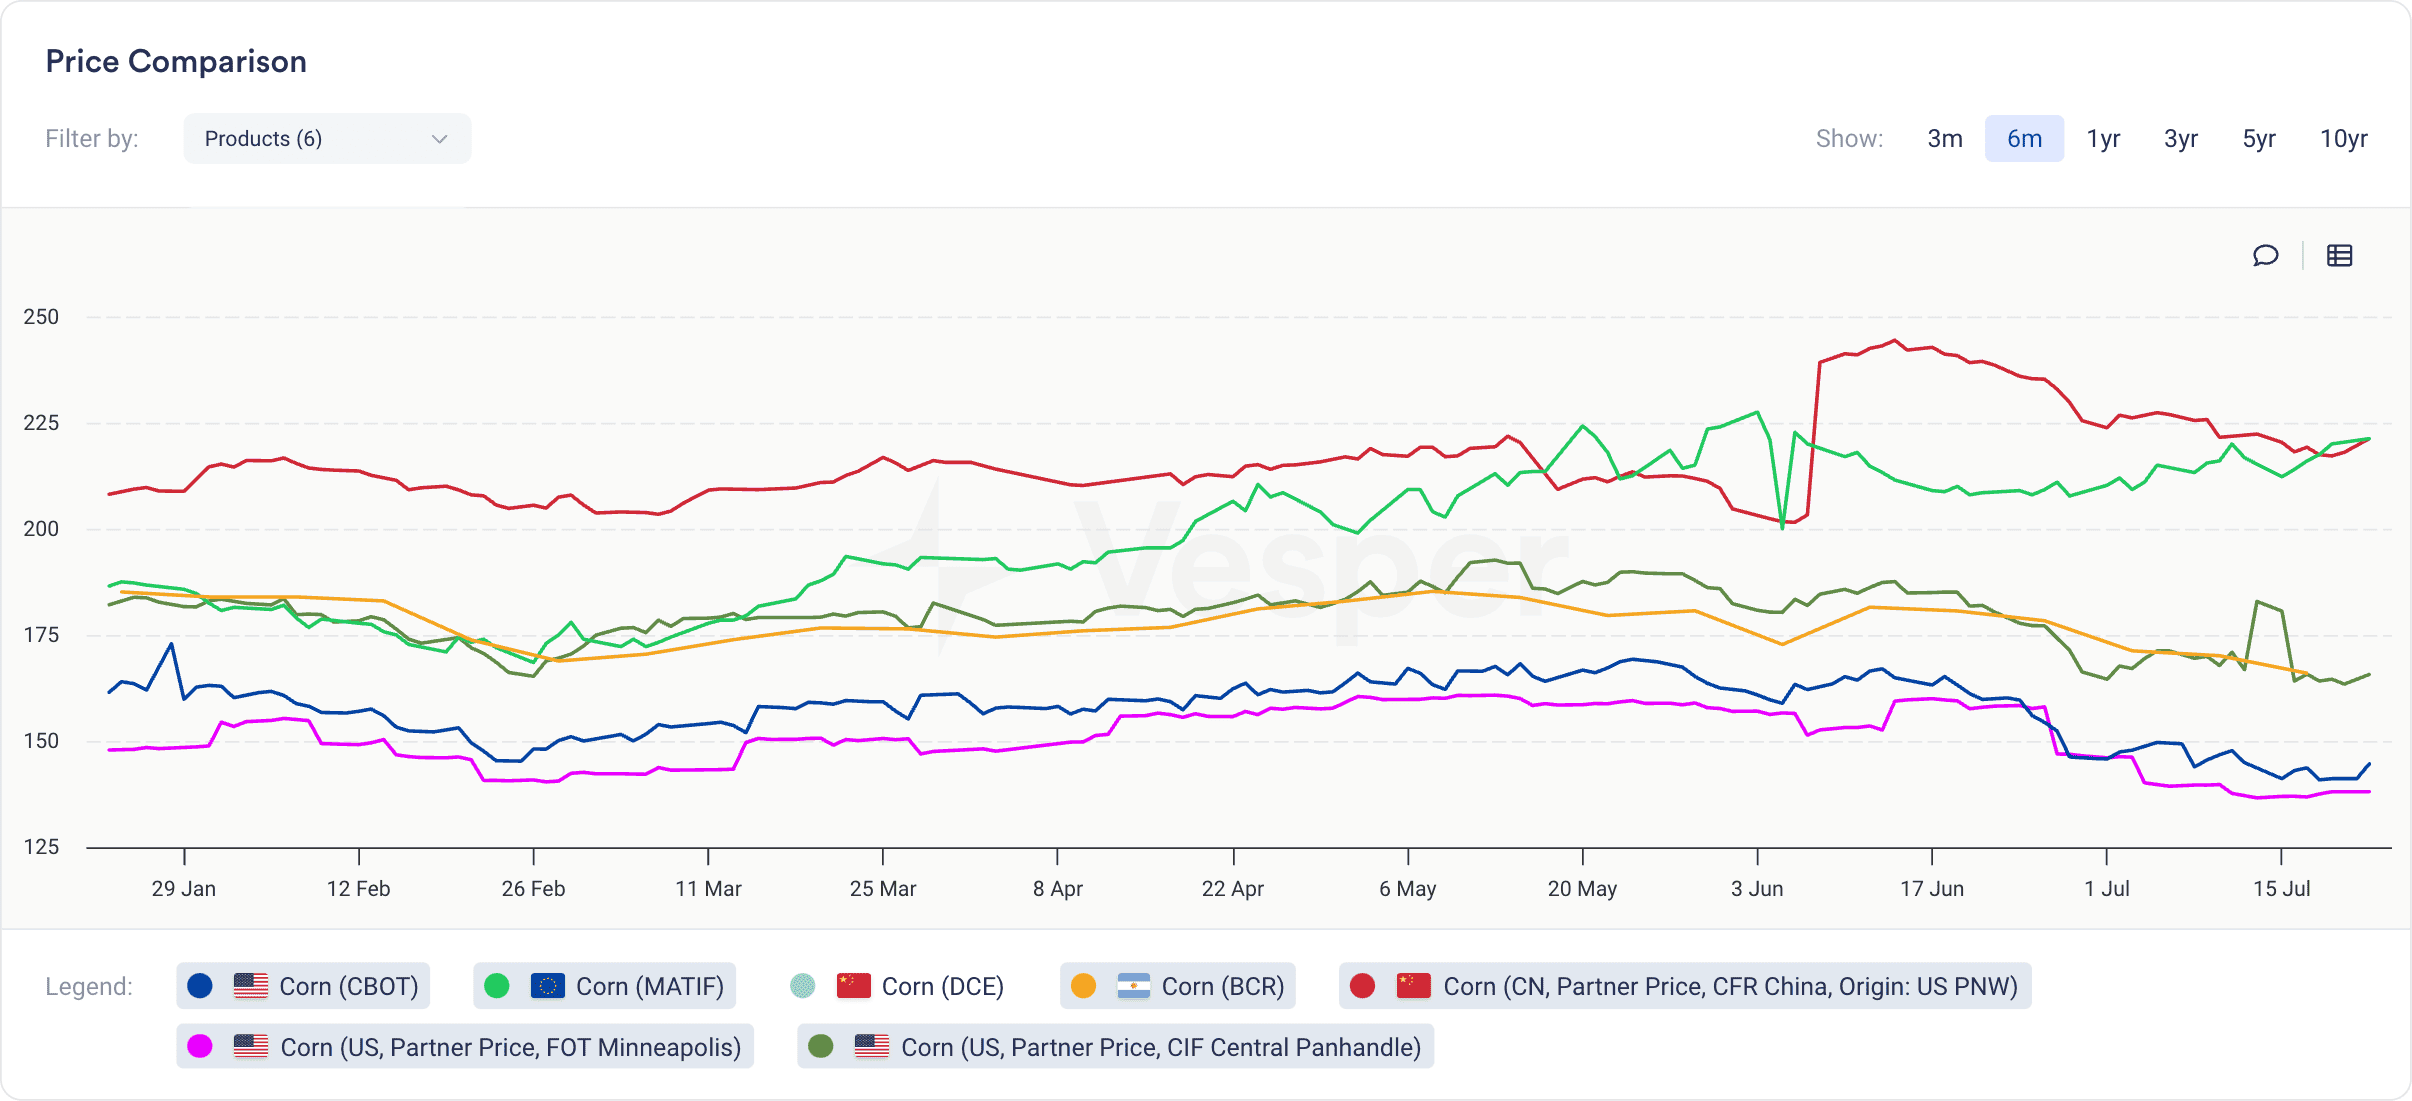
Having access to a tool like Vesper’s platform, which provides up-to-date spot prices across multiple key regions, can be incredibly advantageous for both buyers and sellers in the grain market. The ability to compare spot prices for Corn, as shown in the chart, across regions such as the U.S. (CBOT), EU (MATIF), China (DCE, CN), and Argentina (BCR), allows for more informed decision-making.
For buyers, this comparison offers the chance to identify cost-saving opportunities. If corn prices are lower in one region (for instance, the U.S.), buyers can take advantage of this by sourcing corn from that region, assuming transportation and import logistics remain favorable. Additionally, by spotting upward trends in key exporting regions like China or Argentina, buyers can make early purchasing decisions to avoid price hikes.
For sellers, the advantage lies in the ability to optimize market timing and identify profitable export opportunities. If corn prices in one market, such as China (CN), show a steep rise, sellers from regions with lower prices (such as the U.S. or Argentina) can position themselves to fill the demand gap. This comparison helps them stay ahead of competitors and maximize profits by selling into higher-priced markets.
The attached chart illustrates these dynamics clearly: while corn prices in the U.S. and Europe have shown more stability over the past six months, Chinese prices (both DCE and CN) have experienced significant fluctuations. Sellers and exporters from other regions can leverage these price spikes for profit, while buyers looking to source competitively may turn their attention to more stable markets like the U.S. (CBOT).
Organic vs. Conventional Grain Prices
Organic grains typically command higher prices compared to conventional grains due to stricter farming standards, lower yields, and higher production costs. Both consumers and producers interested in sustainable agriculture are often willing to pay a premium for these organic products, but the price difference can vary significantly by region.
For example, in Vesper’s price comparison graph below, we see a clear distinction between organic and conventional corn prices. The green line represents Organic Corn (AGM), consistently priced higher than Conventional Corn (AGM), shown by the blue line. Over the past year, organic corn prices remain stable and elevated around $300/MT, while conventional corn prices fluctuate below $225/MT.
This price gap is driven by factors like the limited supply of organic corn and the additional costs associated with organic farming practices. Organic farming is often less common, so the available supply of organic grains is smaller, leading to higher prices. Additionally, organic products may need to be transported over longer distances to reach markets, further contributing to their price premium.