What are the main elements of Dairy Supply and Demand Data?
Dairy supply and demand data is crucial for understanding the balance between how much dairy is on the market and how much is needed by consumers. The term “dairy supply and demand data” encompasses a variety of key metrics that are crucial for stakeholders across the sector, and it typically includes metrics such as production volumes, stock levels, export and import figures, and consumer consumption across different regions and product categories.
The graph below is an excellent example of how dairy supply and demand data is visualized, using US butter data from the past six months as a reference.
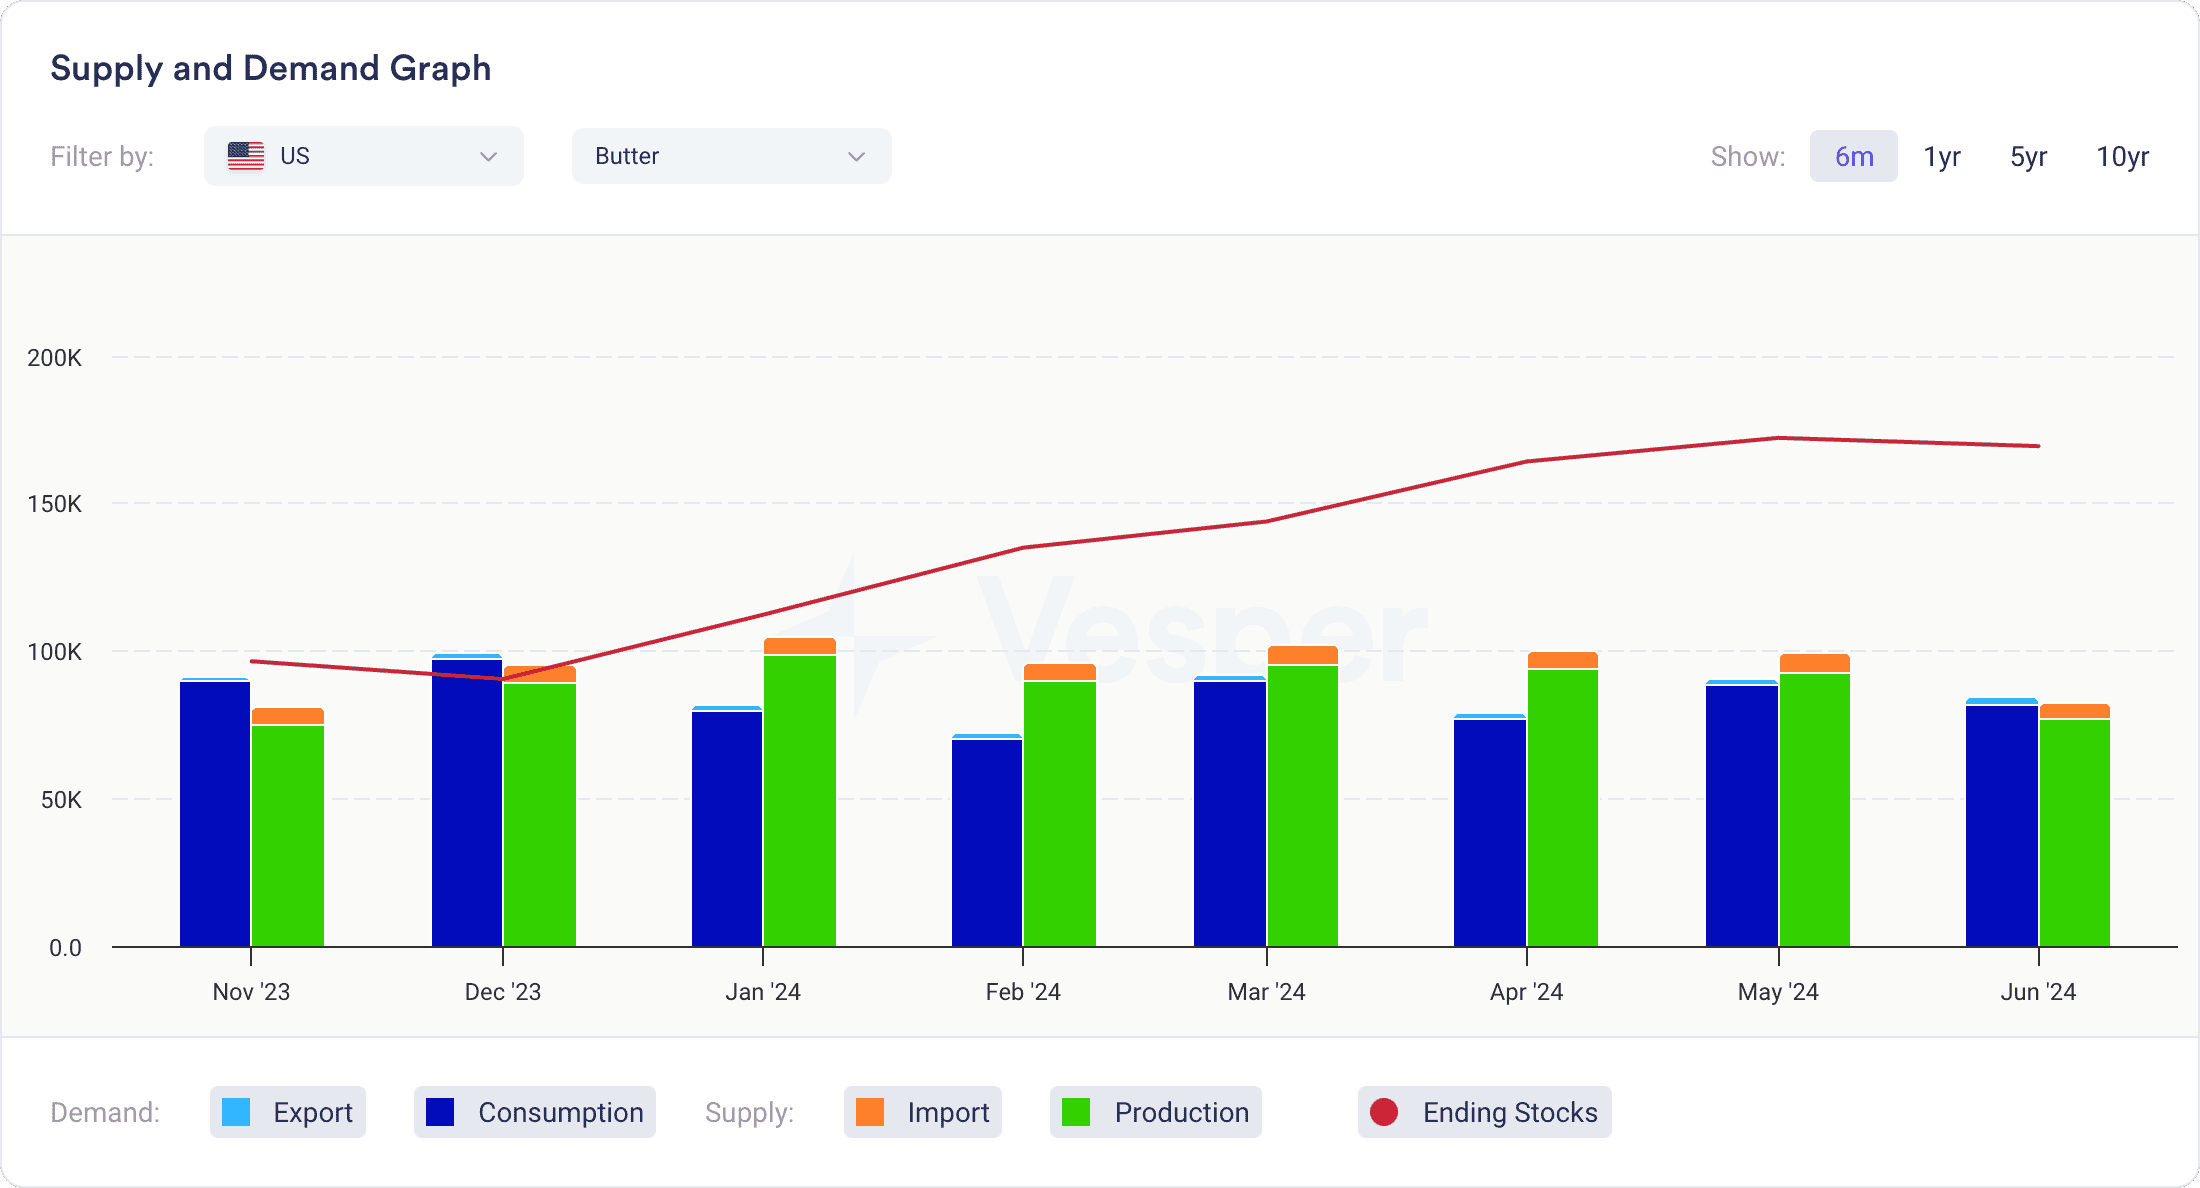
The graph highlights several essential data types categorized under supply, demand, and ending stocks:
Supply
- Production: Shown in green, this data represents the total production output of dairy products. Monitoring production levels helps assess the capacity of local producers to meet demand.
- Import: The orange bars depict the volume of dairy products imported into a region, reflecting external supply sources. Imports are particularly important when local production does not meet demand, necessitating supplementation from other regions.
Demand
- Consumption: Represented by the blue bars, this data shows the total quantity of dairy products consumed within a specified period.
- Export: Indicated by the light blue bars, this data provides insights into the volume of dairy products exported to international markets. Export figures are vital for understanding global demand and the role of trade in balancing local production and consumption.
Ending Stocks
The red line represents the remaining stock at the end of each period after accounting for all supply (production + imports) and demand (consumption + exports) factors. High ending stocks typically indicate that supply has exceeded demand, leading to a surplus, while low ending stocks suggest that demand has outstripped supply, potentially leading to shortages in the future.
What are the Main Drivers of Dairy Supply and Demand Fluctuations?
Understanding the factors that drive fluctuations in dairy supply and demand is crucial for predicting supply and demand levels. These fluctuations are influenced by a variety of factors, which can broadly be categorized into the following main drivers:
- Seasonal Production Variability
- Weather and Climate Conditions: Dairy production is highly seasonal, with factors like temperature and rainfall affecting milk yield and quality. For instance, warmer seasons often lead to higher milk production, while extreme weather can reduce output.
- Feed Costs and Availability
- Feed Prices: The cost of feed is a significant factor influencing dairy production. When feed costs rise, it can reduce profitability for farmers, leading to lower production levels. Conversely, lower feed costs can encourage higher production.
- Feed Quality: The quality of feed also impacts milk yield and quality, thereby affecting overall supply.
- Global Market Demand
- Consumer Preferences: Shifts in consumer preferences, such as increased demand for plant-based alternatives or particular dairy products like cheese or butter, can significantly influence demand.
- Economic Conditions: Economic downturns can decrease consumer spending on dairy products, while economic growth can boost demand.
- Trade Policies and Tariffs
- Import/Export Regulations: Changes in trade policies, such as tariffs and quotas, can either restrict or enhance access to international markets, impacting both supply and demand.
- Geopolitical Events: Events like trade disputes or sanctions can disrupt the global dairy trade, leading to supply and demand imbalances.
- Global Supply Chain Disruptions
- Topics like “Pandemics or Natural Disasters” have gained significant attention, particularly following events like the COVID-19 pandemic, which had a profound impact on both dairy supply and demand.
How Global Dairy Supply and Demand can Affect Local Markets: A Case Study of China’s SMP Market
Global dairy supply and demand dynamics significantly influence local markets, and China’s skim milk powder (SMP) sector offers a prime example. As one of the largest consumers of dairy, China’s fluctuating demand for SMP has a ripple effect on global producers, particularly in the U.S. and New Zealand.
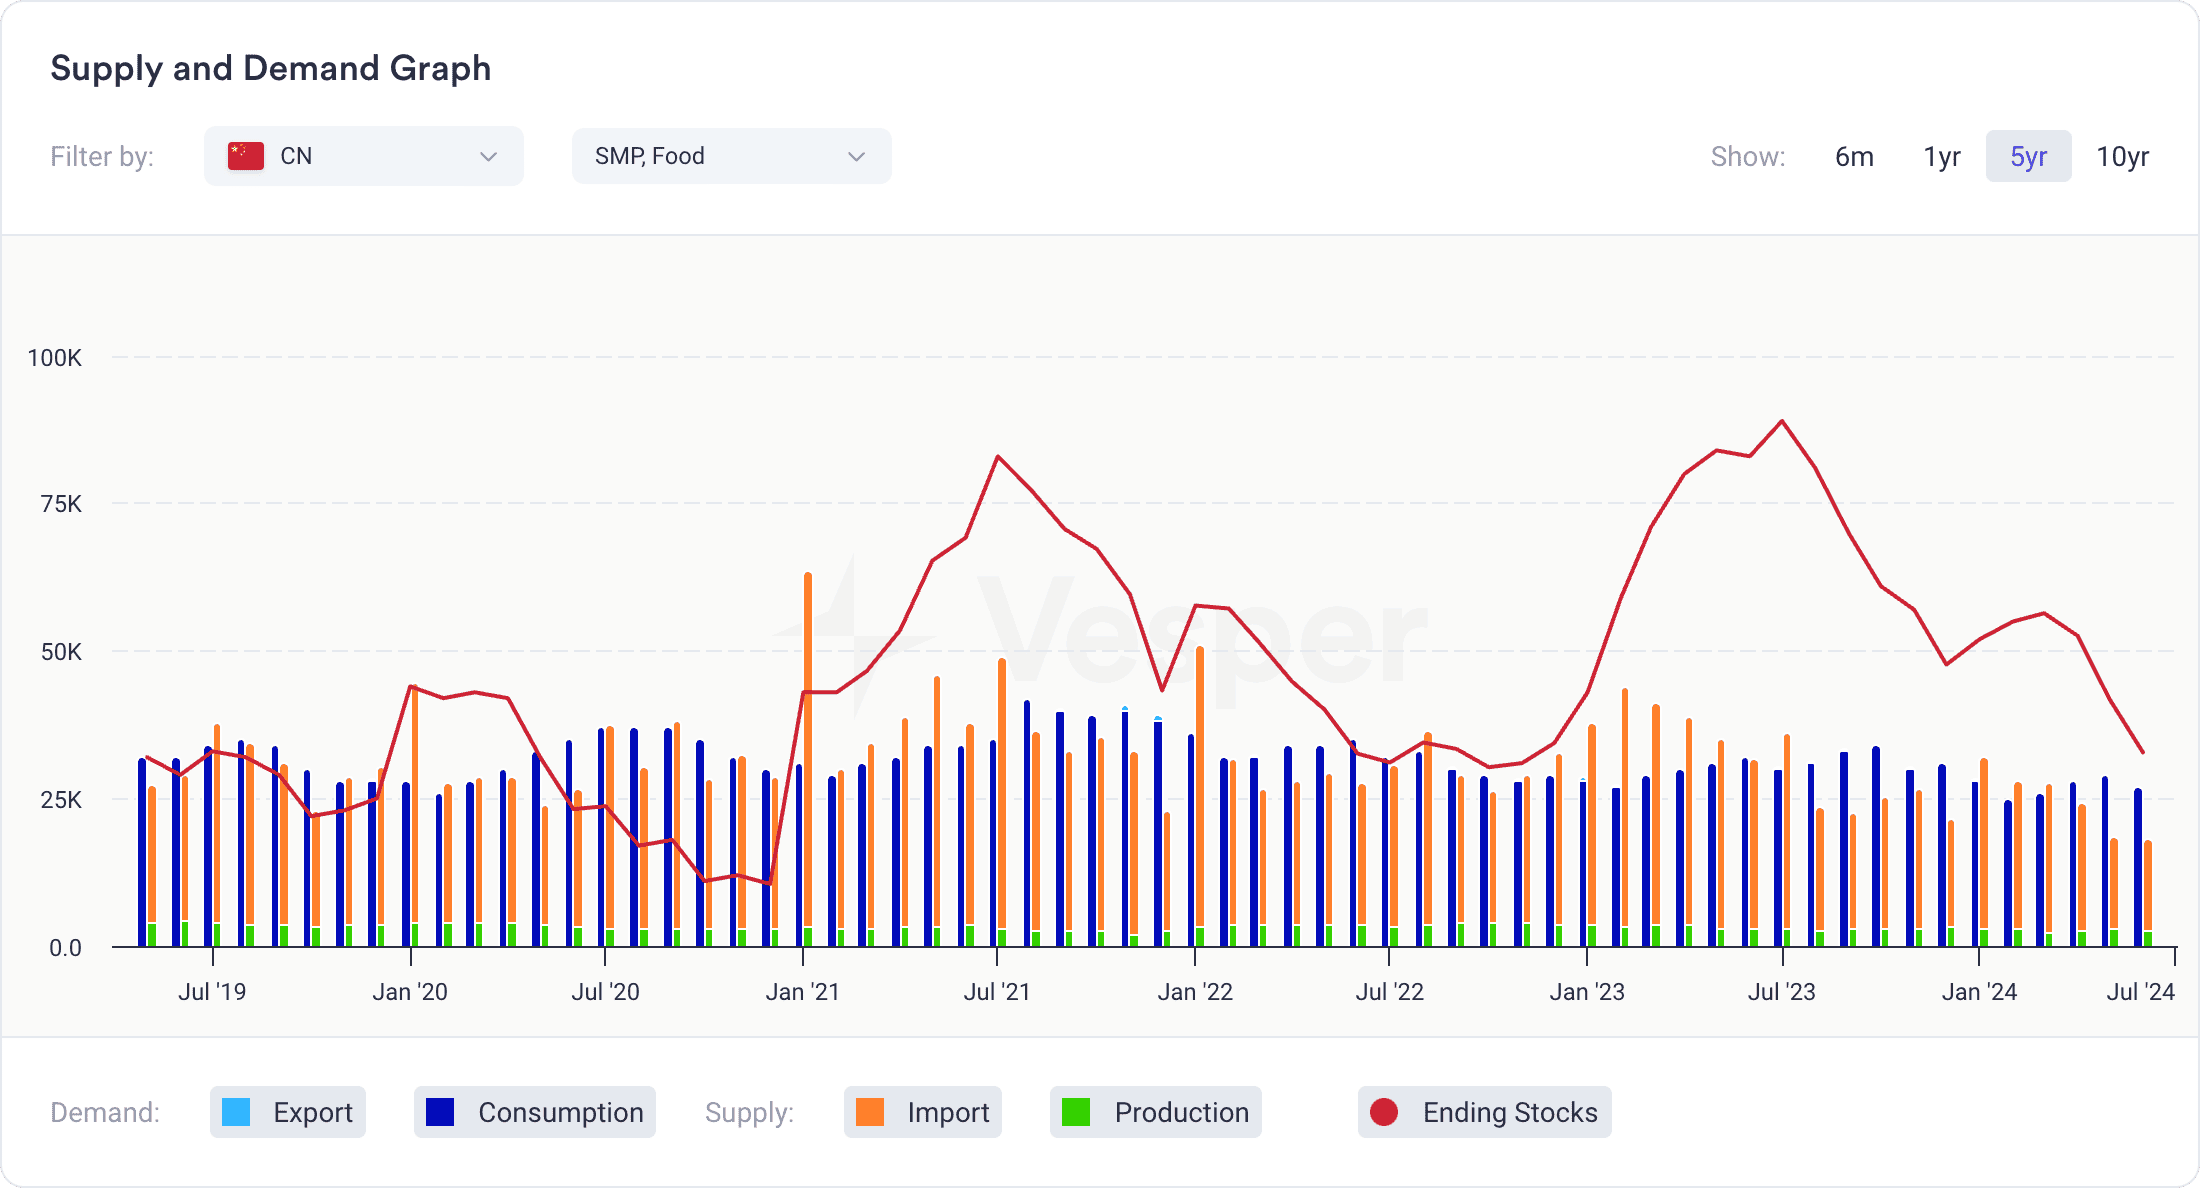
The graph above illustrates China’s SMP supply and demand over the past five years, showcasing key trends that have shaped the global market.
From 2019 to 2024, China’s SMP market experienced significant volatility, reflecting broader global dairy trends. For instance, imports (orange bars) spiked in early 2021, corresponding with global supply chain disruptions. This increase in imports, combined with rising production (green bars), led to elevated ending stocks (red line) by mid-2021.
Conversely, 2022-2024 saw a gradual decline in imports as China ramped up domestic production, reducing its reliance on foreign SMP. This shift impacted global exporters, particularly the U.S., which saw reduced market share in China.
The fluctuations in China’s SMP demand directly affect global prices. For example, when China’s imports dropped in 2022, global SMP prices softened, impacting U.S. exporters’ profitability. Additionally, New Zealand’s strategic shift to increase SMP production in response to China’s demand has intensified competition, further pressuring U.S. markets.
These global trends trickle down to local markets. In the U.S., reduced export opportunities to China have forced domestic producers to adjust, either by seeking alternative markets or scaling back production.
Strategic Applications of Dairy Supply and Demand Data Across Industry Roles
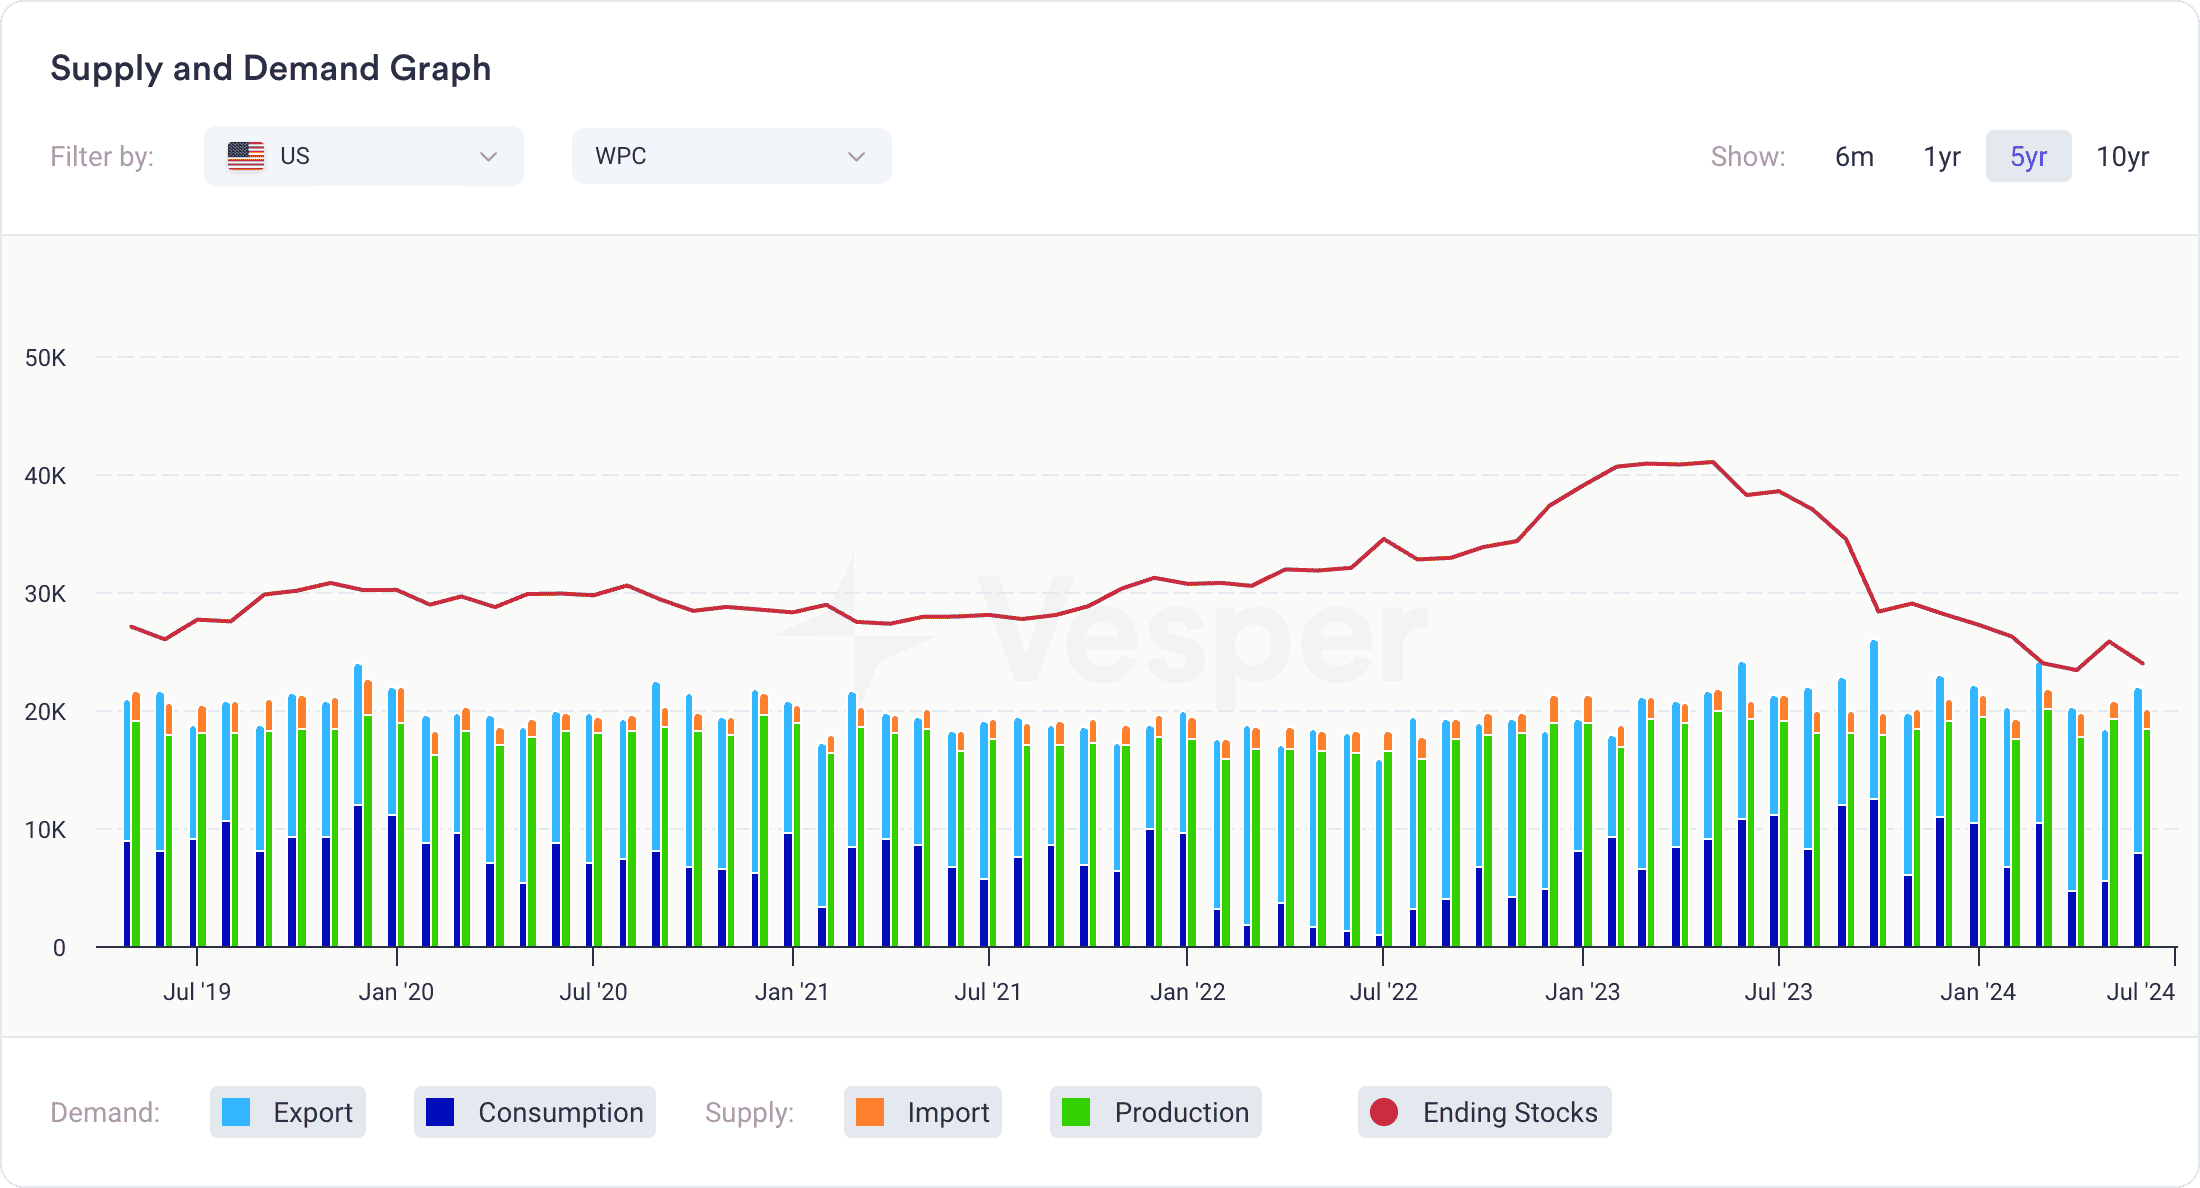
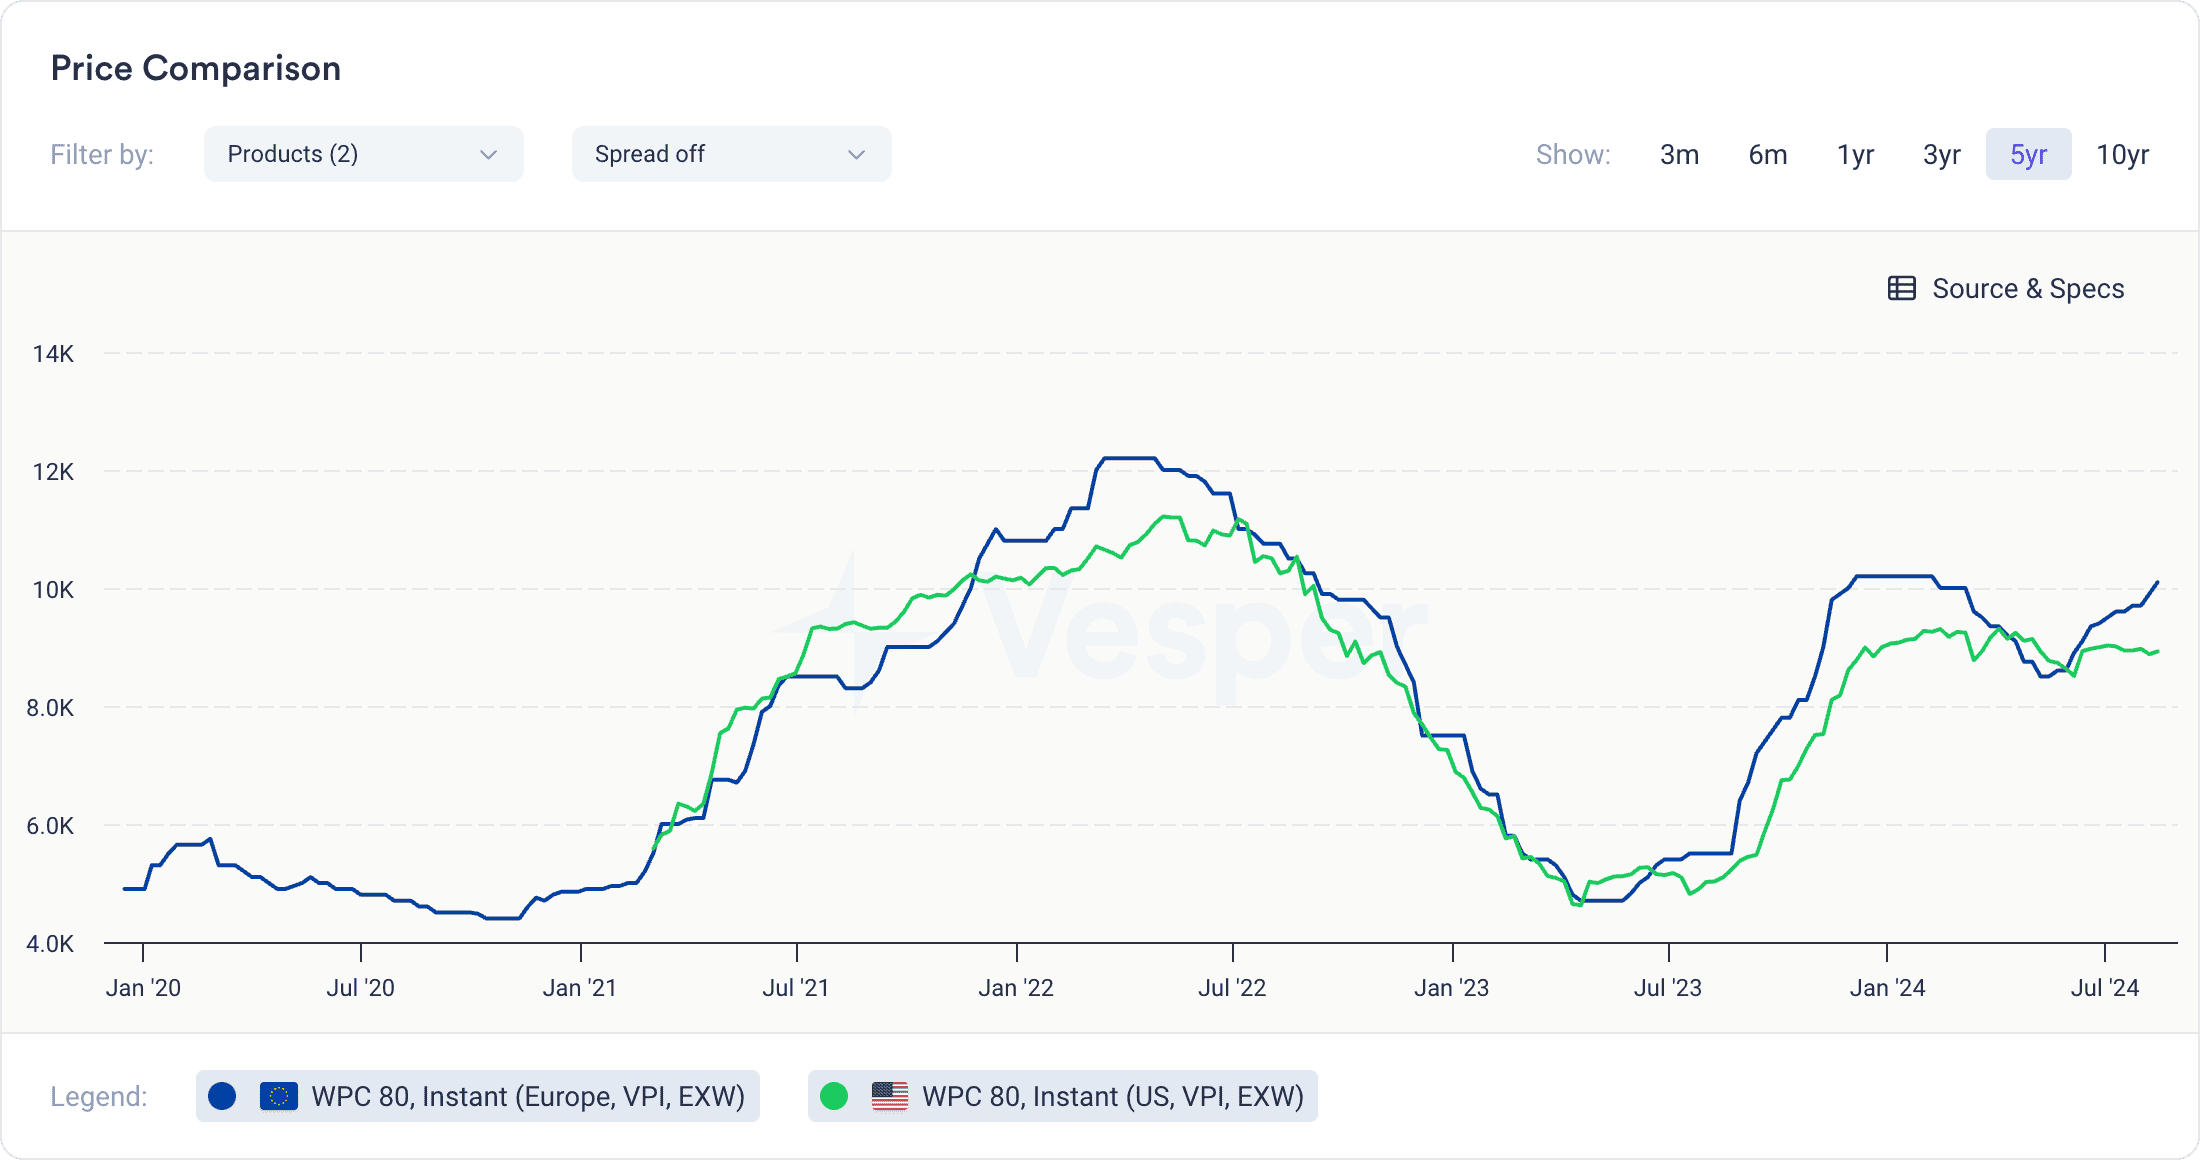
Let’s take the US Whey Protein Concentrate (WPC) market data as an example of how supply and demand data can influence the decisions of various market participants. The graphs depict supply and demand dynamics, as well as price trends for WPC in the US and Europe. Read below how different market participants—producers, traders, and buyers—can interpret and act upon this data.
Producers
- How to Utilize Dairy Supply and Demand Data for Efficient Production Scheduling?
Producers can optimize their production schedules by closely monitoring supply and demand data. In the context of US WPC, the data shows tighter stocks and increasing prices. Producers should interpret this as a signal to ramp up production to meet the heightened demand. By adjusting output in response to these trends, producers can prevent both overproduction, which leads to wasted resources, and underproduction, which results in missed revenue opportunities. - How to Apply Dairy Supply and Demand Data for Maximizing Profit Margins?
To maximize profit margins, producers should leverage supply and demand data to time their sales and adjust their product mixes based on market conditions. The current trend of rising WPC prices suggests a lucrative period for sales. Additionally, producers can identify lucrative export opportunities by analyzing global demand trends. For example, if US stocks are low and international demand is high, focusing on exports can be particularly profitable.
Traders
- How to Use Dairy Supply and Demand Data to Manage Risks in Commodity Trading?
Traders rely on supply and demand data to manage risks and make profitable trading decisions. The WPC data indicates a tightening market with rising prices. Traders can interpret this as a sign to hedge against potential supply shocks and increase long positions. Understanding global supply and demand dynamics also helps traders identify arbitrage opportunities. For instance, if the US market is tight but European markets are more balanced, traders might find profitable arbitrage opportunities by moving products between these regions.
Buyers
- How Can You Use Dairy Supply and Demand Data to Optimize Your Procurement Budget?
Buyers can use supply and demand data to make informed procurement decisions. The current US WPC data shows low stocks and rising prices, indicating potential shortages. Buyers should secure contracts early to avoid price hikes. By analyzing production trends, they can anticipate these shortages and act accordingly. Additionally, understanding import and export figures helps buyers explore alternative supply sources, reducing the risk of stockouts. - How to Use Dairy Supply and Demand Data to Ensure Reliable Supply Chains?
Supply and demand data helps buyers identify potential supply chain disruptions. Monitoring stock levels and trade activity allows them to diversify suppliers and proactively secure alternative channels. This ensures a steady supply, even in a tight market. For instance, if domestic stocks are low, buyers might look to international suppliers to fill the gap.