Historical dairy data refers to the comprehensive records of various metrics and information related to the dairy industry, collected over a period of time. This data encompasses a wide range of variables, from production volumes and prices to consumption patterns, weather conditions, and livestock health. By examining historical dairy data, stakeholders in the dairy industry can gain valuable insights into past trends, identify recurring patterns, and make informed decisions for the future.
Key Historical Dairy Data to Review and Its Importance
1. Historical Milk Production Data
Milk is the key raw material for various dairy products like cheese, butter, yogurt, and powdered milk. Understanding historical production trends aids in forecasting future supply, aligning production with market demand, and preventing price volatility. Since milk production fluctuates seasonally due to factors like feed availability, weather, and breeding cycles, historical data is essential for managing inventory, planning schedules, and ensuring a consistent year-round supply.
2. Historical Farm-Gate Milk Prices
Farm-gate milk prices are the prices dairy farmers receive directly from buyers, typically dairy cooperatives, at the farm, before any processing or transportation costs are factored in. These prices are crucial indicators of the profitability and sustainability of dairy farming. Tracking historical farm-gate prices helps identify long-term market trends, as these prices directly influence future milk production. When farmers receive higher prices for their milk, they tend to expand their herds and invest more in feed, leading to increased milk production estimates, and vice versa.
3. Historical Milk Valorization
The Historical Milk Valorization data, as hosted on Vesper, is a valuable tool for understanding the economic value that can be extracted from a specific volume of milk, typically calculated for 10,000 liters, by simulating the potential returns from six different product groups: SMP/Butter, WMP, Acid Casein, Cheddar, Gouda, and Mozzarella.
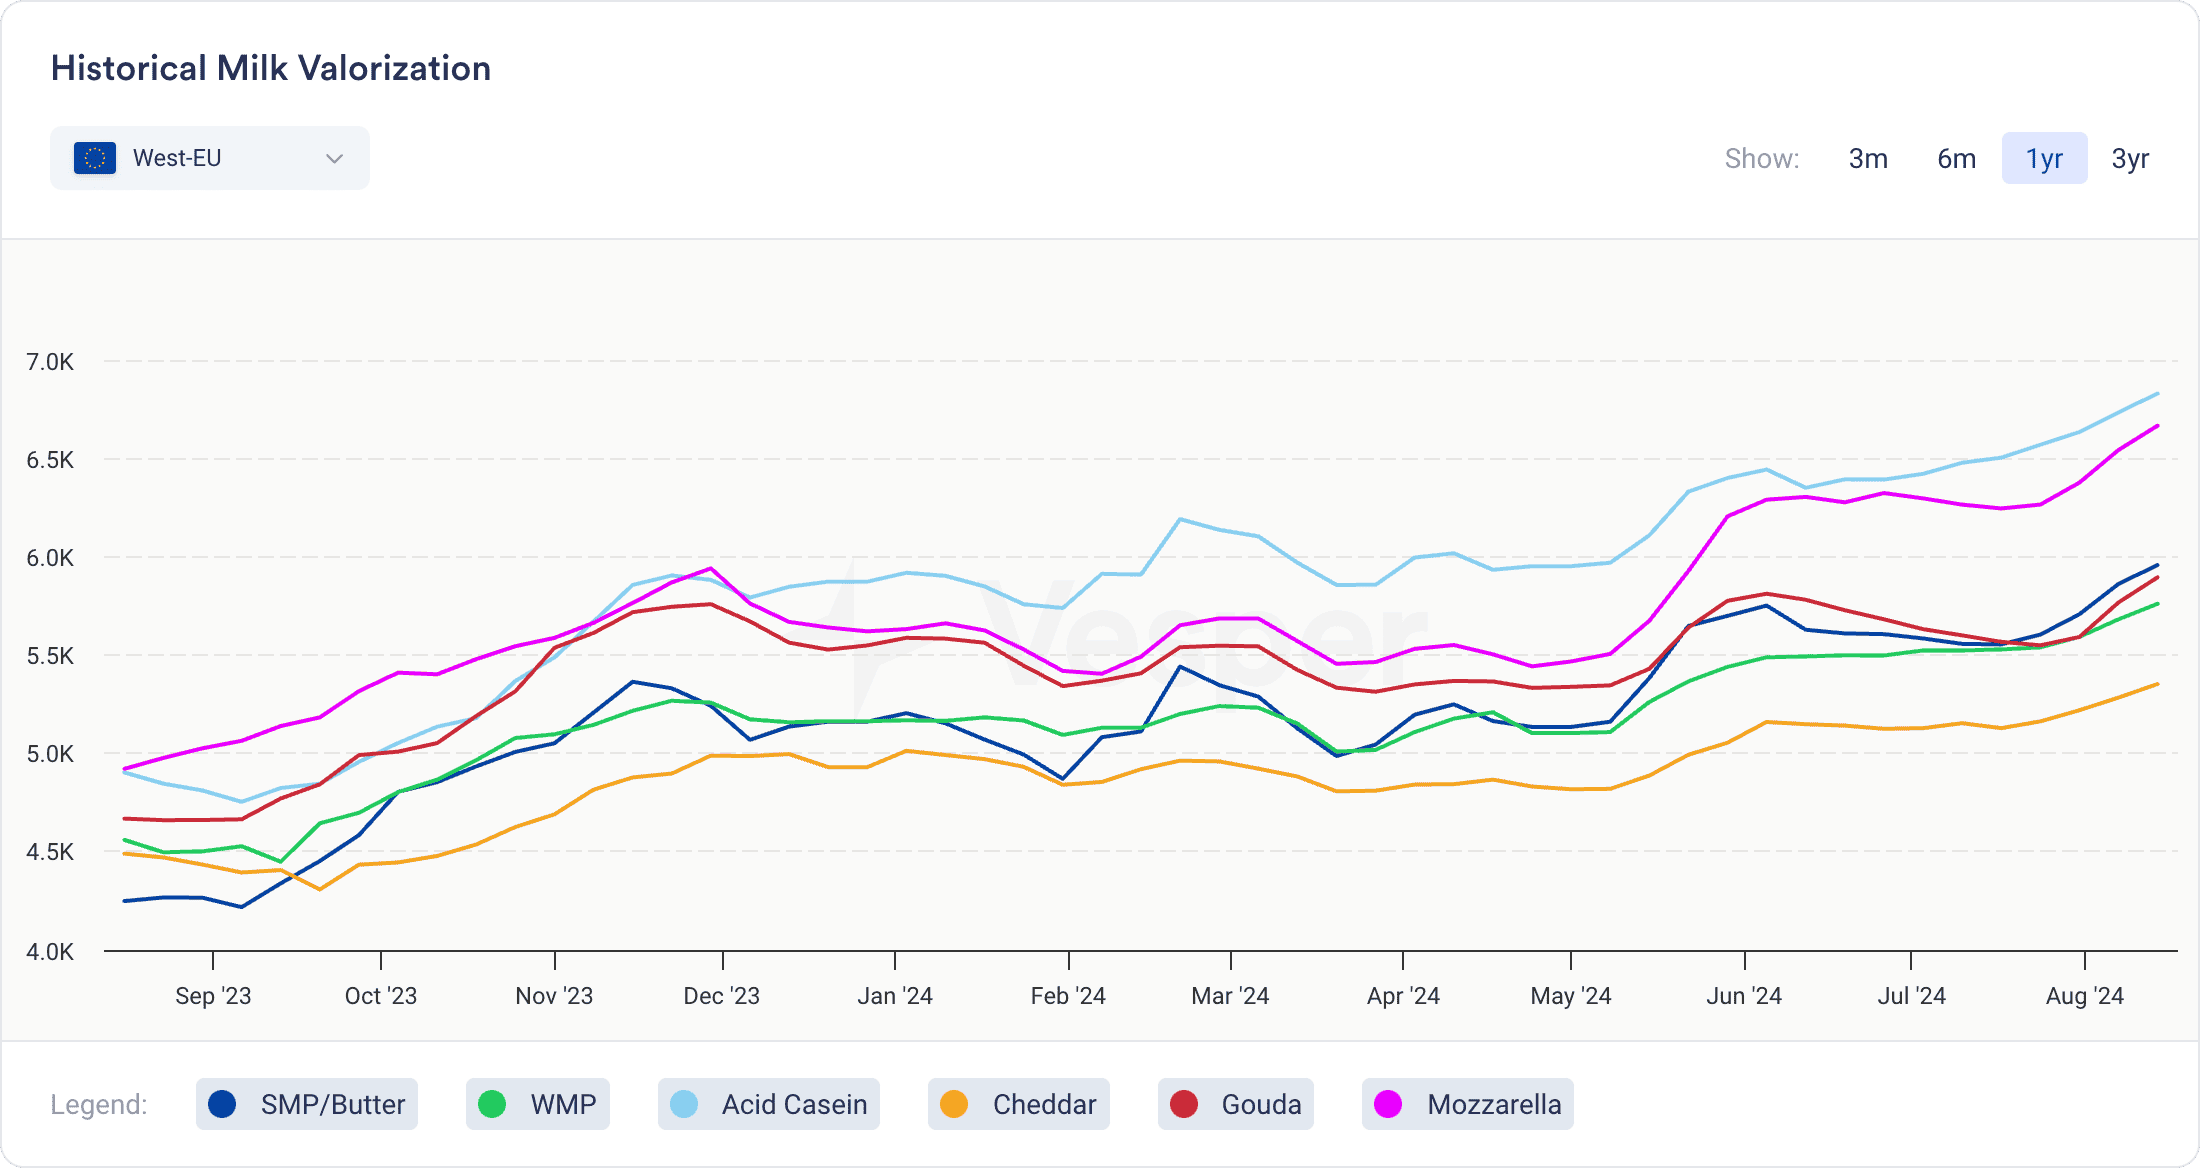
By analyzing historical valorization, stakeholders can determine which dairy products consistently yield the highest returns, enabling more informed decisions about production priorities.
The visual suggests that, over the past year, Mozzarella has offered the highest valorisation among the product groups analyzed, with a noticeable upward trend. This makes Mozzarella the most lucrative product to focus on in terms of production. SMP/Butter and WMP provide steady, albeit lower, returns, making them reliable but not the most profitable choices. Cheddar and Gouda show declining trends, indicating a potential decrease in their economic value, which might influence stakeholders to reconsider these options unless the market outlook changes.
Producers can use this historical data to shape their strategies by prioritising higher valorisation products like Mozzarella, especially as returns rise. They might scale back on less profitable items like Cheddar and Gouda unless their market value improves.
Buyers can also use this data to anticipate which products producers will likely focus on. With Mozzarella’s valorisation on the rise, producers may increase its production, potentially leading to greater availability and stabilizing or lowering prices in the future.
4. Historical Consumption Data
Historical dairy consumption data offers essential insights into how much and what types of dairy products are consumed across different regions and demographics over time. This data reveals shifts in consumption patterns driven by factors like economic conditions, cultural trends, and seasonal variations.
Understanding these historical patterns enables dairy producers and retailers to better anticipate demand for various products. For instance, identifying an increase in ice cream consumption during hot summer months allows companies to adjust their production and marketing strategies to meet seasonal demand.
5. Historical Livestock Data
Historical livestock data, which includes records of dairy cattle populations, breed types, health statistics, slaughter rates, milk yield per cow, is crucial for understanding trends in overall dairy herd productivity. This data provides insights into how herd health impacts milk production.
For instance, as shown in the Herd Size and Milk Production widget below, hosted on Vesper’s commodity intelligence platform, a significant increase in cow slaughter rates between March and mid-August 2023 led to a notable decline in herd size. This reduction in herd size, influenced by financial gains from selling cows for beef, directly impacted milk production levels. The year-to-date figures indicated a 3.63% rise in cow slaughter compared to 2022, which subsequently resulted in a decline in milk production during the second half of 2023, as depicted in the milk production trends.
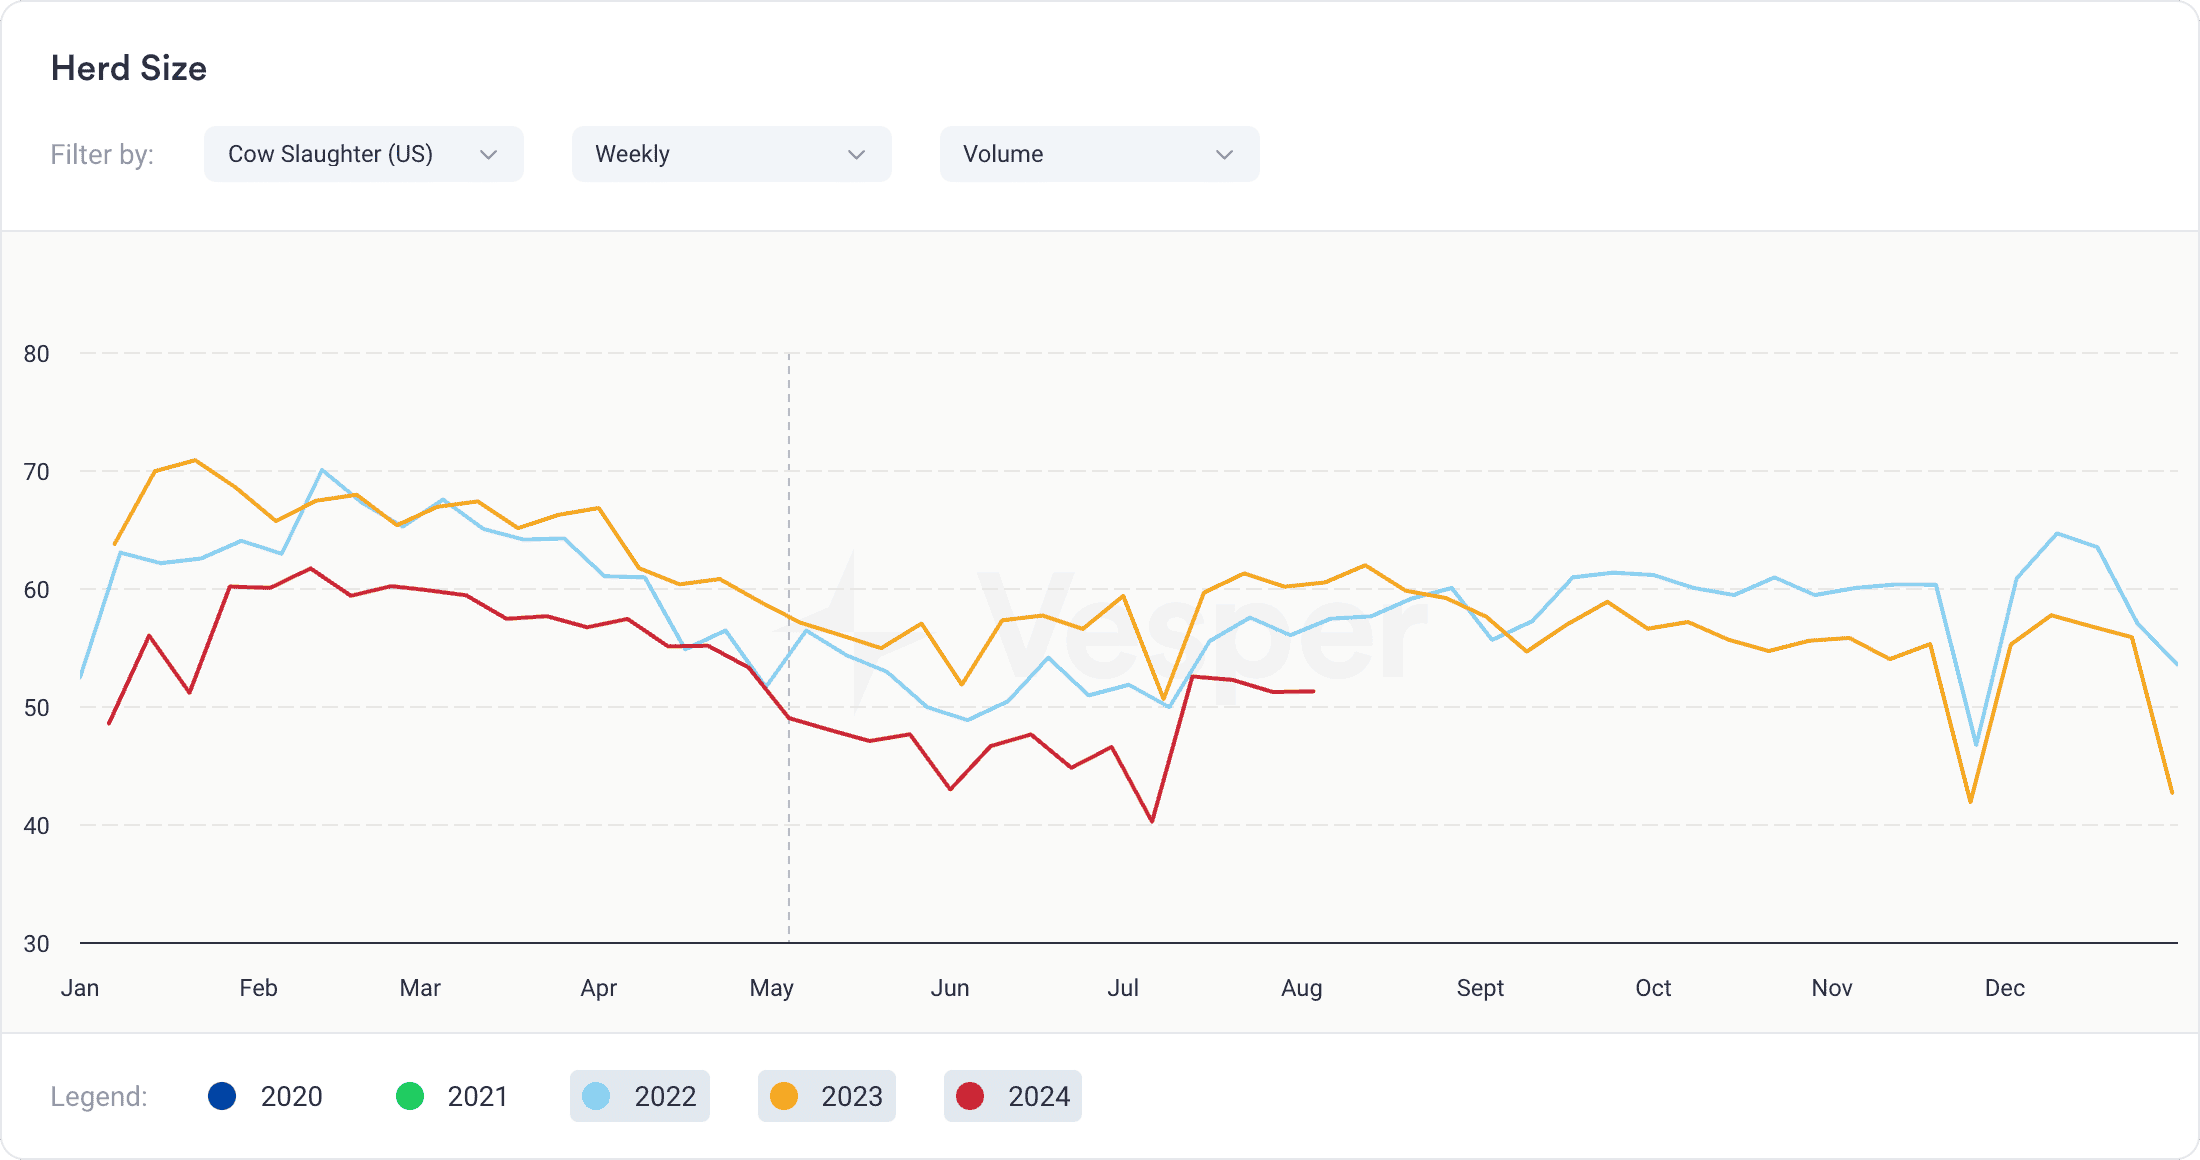
Figure 6: US weekly Milk Cow Slaughter (x1000 headcount)
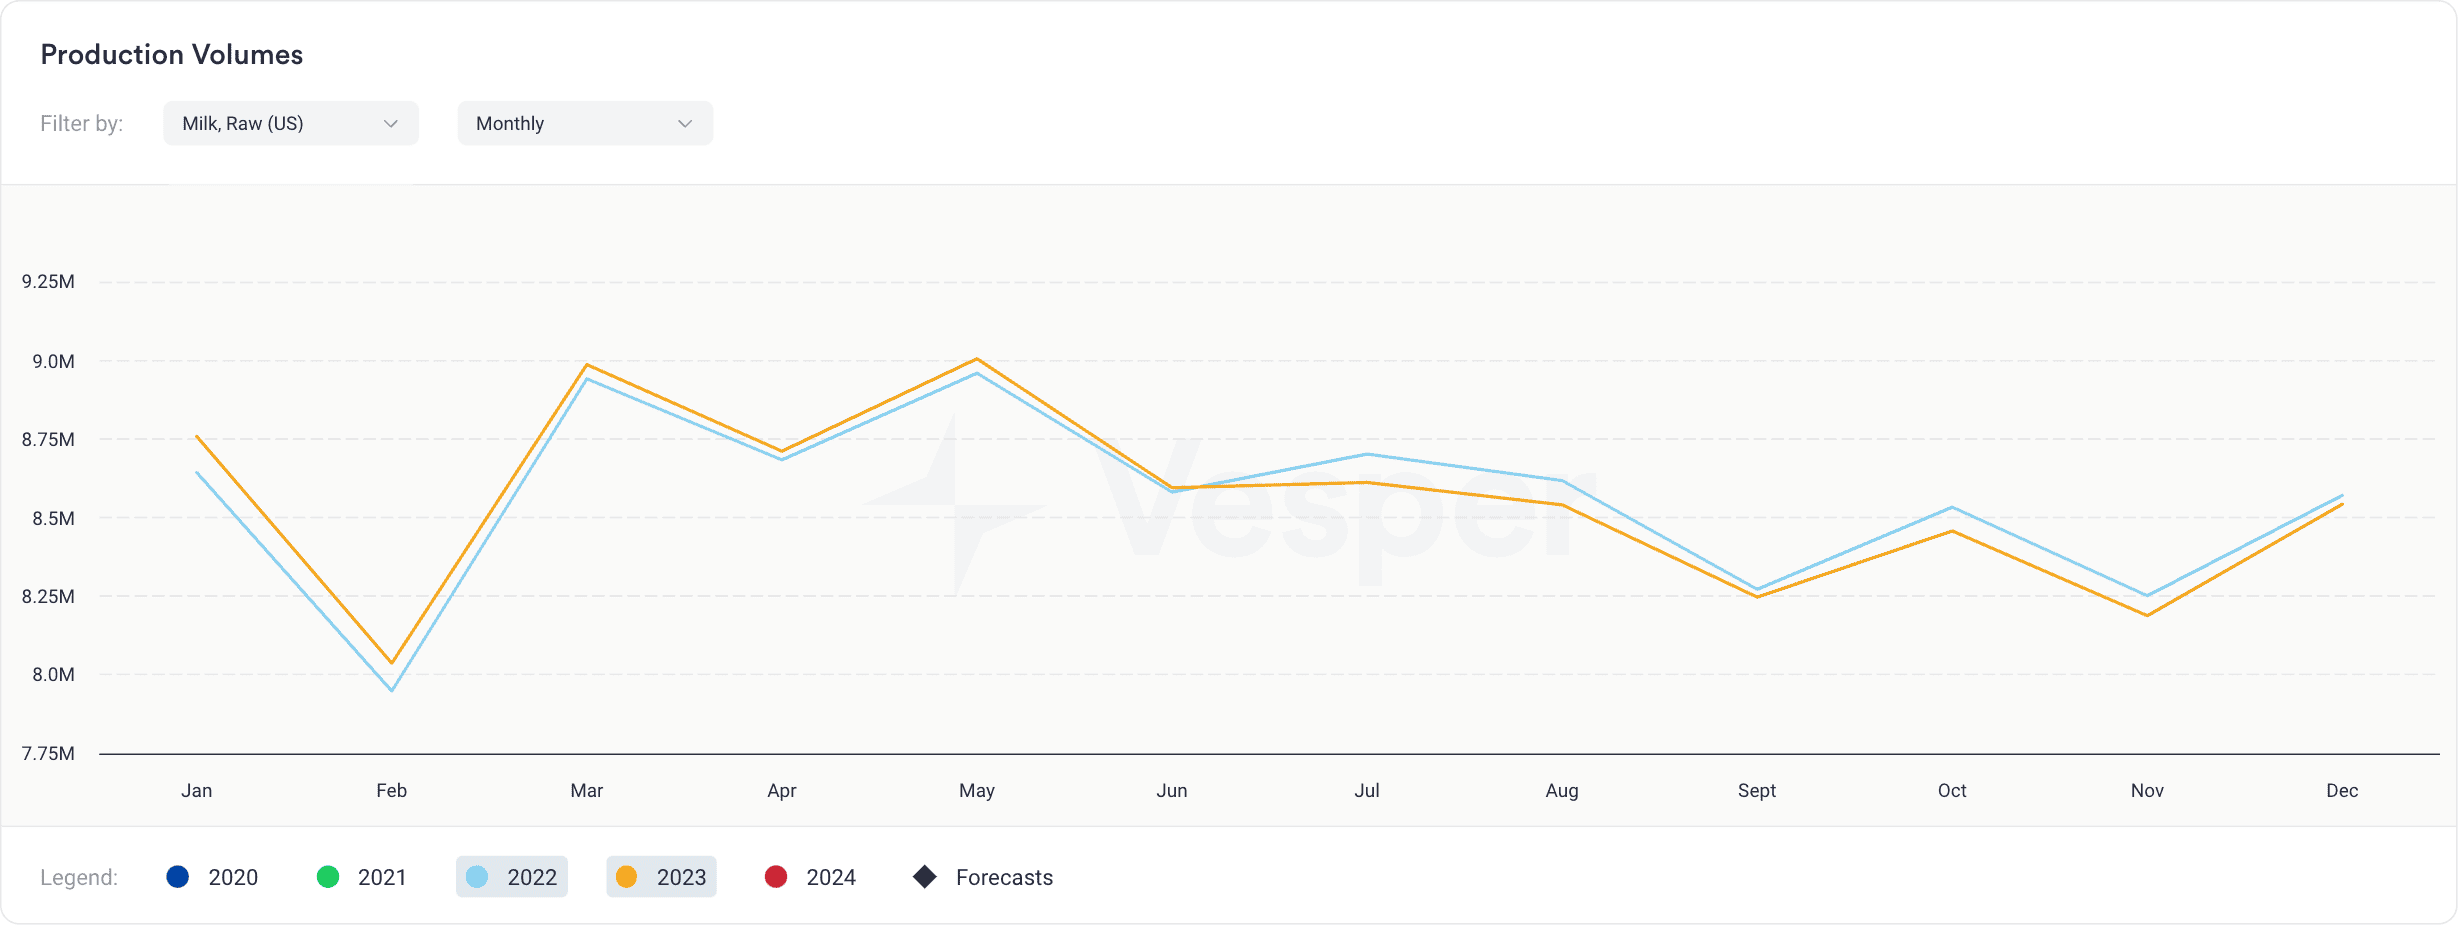
Figure 7: Monthly US Milk Production in MT
This example highlights how slaughter rates directly influence milk production volumes. Understanding these relationships through historical data enables dairy stakeholders to make informed decisions that balance short-term financial gains with long-term production goals.
6. Historical Weather Data
Weather conditions play a crucial role in dairy production, influencing everything from the health of dairy cattle to the availability of feed. Historical weather data, including records of rainfall, temperature, and other climatic factors, is essential for understanding how environmental conditions have impacted milk production and dairy farming practices over time.
One critical aspect influenced by weather is heat stress, which occurs when cows are exposed to high temperatures and humidity for extended periods. Heat stress can severely affect dairy cows, leading to reduced feed intake, lower milk yield, and even reproductive issues.
By analyzing historical weather data, dairy stakeholders can identify periods when heat stress has impacted milk production and adjust their buying, selling, trading strategy accordingly.
7. Historical Import/Export Data
The world has become increasingly interconnected, making it crucial to examine historical records of dairy imports and exports, including volumes, values, and trade routes. These records are essential for understanding global dairy market dynamics. This data helps stakeholders grasp how international trade influences the availability and pricing of dairy products in various regions.
Take, for instance, a common globally traded dairy commodity like Skim Milk Powder (SMP). In April 2024, European SMP prices were pressured by a combination of lower global demand and increased domestic production in China, which reduced China’s reliance on imports. Meanwhile, Oceania, a major exporter, continued to ship SMP at competitive prices, further driving down global prices. This example illustrates how shifts in production and trade activities in one region can ripple through the global market, impacting prices and trade flows in other regions.
Main Reasons to Analyze Historical Dairy Data
Trend Analysis and Forecasting
By examining historical data, industry analysts and stakeholders can identify trends and predict future developments. For example, they can forecast periods of high or low milk production based on past patterns, helping producers plan accordingly.
Risk Management
Understanding historical fluctuations in dairy production and prices helps farmers, traders, and businesses manage risks. For instance, a farmer can use historical weather data to anticipate drought conditions and prepare for potential impacts on milk yield.
Supply Chain Optimization
Historical data can reveal inefficiencies or strengths in the dairy supply chain, guiding improvements in logistics, processing, and distribution.
Where to Find Historical Dairy Data?
National Database Example
UK Agriculture and Horticulture Development Board (AHDB) Dairy Reports: AHDB provides comprehensive historical data on dairy production, milk prices, and market conditions in the United Kingdom. This resource is essential for understanding trends and making informed decisions in the UK dairy sector.
Regional Database Example
USDA Dairy Statistics: The United States Department of Agriculture (USDA) offers extensive historical data on dairy production and prices within the United States. This database is widely used for market analysis and policy development in the U.S. dairy industry.
Global Database Example
Vesper: Vesper is a global dairy market intelligence platform that aggregates and analyzes dairy data from around the world. It provides both real-time and historical data, making it an essential tool for global market strategy and decision-making.
Common Dairy Trends and Market Cycles
The dairy market is characterized by recurring trends and cycles, many of which are closely linked to natural and seasonal factors. Historical dairy data provides a window into these patterns, allowing stakeholders to anticipate changes and make strategic decisions. Below some examples of some common dairy trends and market cycles that frequently emerge:
Seasonal Production Fluctuations
Dairy production often follows a seasonal cycle, with milk yields typically peaking during specific months when cows have access to fresh pasture and more daylight hours, also known as the milk flush. This increase in milk production often leads to a temporary drop in milk prices due to the surplus supply.
Butterfat Content in Milk
Another cyclical trend in the dairy market is the fluctuation in butterfat content in milk, which varies throughout the year. During colder months, cows tend to produce milk with a higher butterfat content, which is desirable for producing cream and butter. Conversely, during warmer months, butterfat levels typically decrease. Dairy processors and manufacturers closely monitor these trends to adjust their production processes and meet market demand.
Back-to-School Season
In the United States and many European countries, the back-to-school season in late August and early September often leads to a surge in demand for dairy products, particularly milk, cheese, and yoghurt. This demand is driven by the return of students to schools and the increased need for lunchbox items and snacks. Dairy processors and retailers often see a spike in sales during this period, and prices may increase slightly due to the heightened demand.
Chinese New Year
The Chinese New Year, which typically falls between January and February, is a major holiday that significantly impacts dairy demand in China. During this period, there is a noticeable increase in the consumption of dairy products like milk, and cheeses as families gather to celebrate. This spike in demand often leads to higher dairy imports into China in the months leading up to the holiday, influencing global dairy trade patterns and potentially driving up prices, particularly for products that are popular in China.
Conclusion
Historical dairy data is an invaluable resource for anyone involved in the dairy industry. It provides a wealth of information that can be used to analyze past performance, forecast future trends, and make strategic decisions. Whether for trend analysis, risk management, or policy development, historical dairy data helps stakeholders navigate the complexities of the dairy market and ensure the industry’s long-term sustainability.