In the dairy market, global milk production stands as the fundamental heartbeat, offering crucial insights into the supply side of the industry. Understanding and monitoring milk production is paramount for dairy stakeholders, serving as a barometer for the industry’s health and stability.
To grasp milk production dynamics, we’ll explore five pivotal indicators that drive milk production volumes, see Figure 1. Although the significance of these indicators may differ across various milk-producing regions, our goal is to offer a global perspective.
By examining historical trends and leveraging Vesper’s data, our aim is to provide you with a comprehensive understanding of these five indicators.
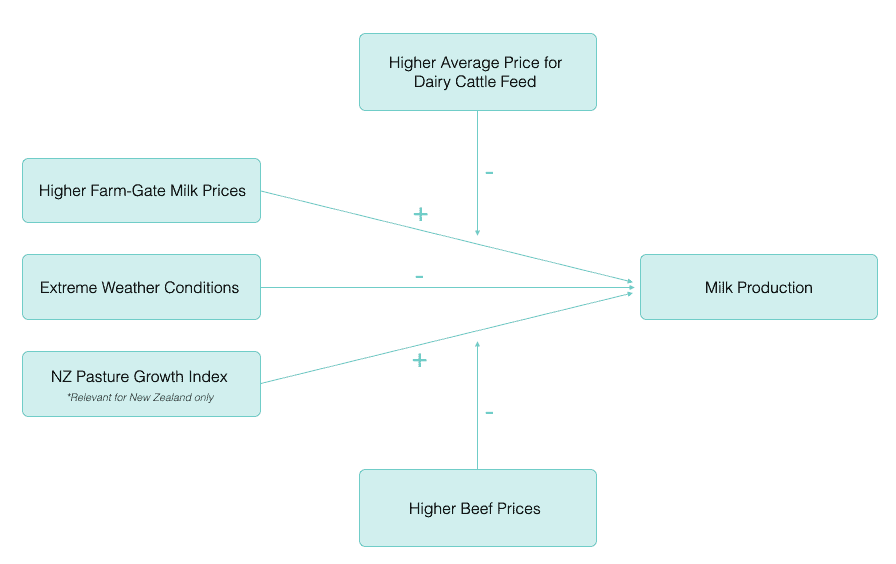
Figure 1: Five Milk Production Indicators
1. Farm-gate milk prices
The strategic adjustment of farm-gate milk prices by dairy cooperatives plays a pivotal role in market stabilization. These adjustments aim to balance commodity prices, align production estimates, and enhance profit margins for cooperatives.
As seen in 2022, an increase in farm-gate milk prices stimulated robust milk production, emphasising the direct correlation between pricing strategies and output. As illustrated in Figure 2, Coops increased the farm-gate milk prices to approximately €600 per metric tonne or €0.60 per kilogram, in December ’22.
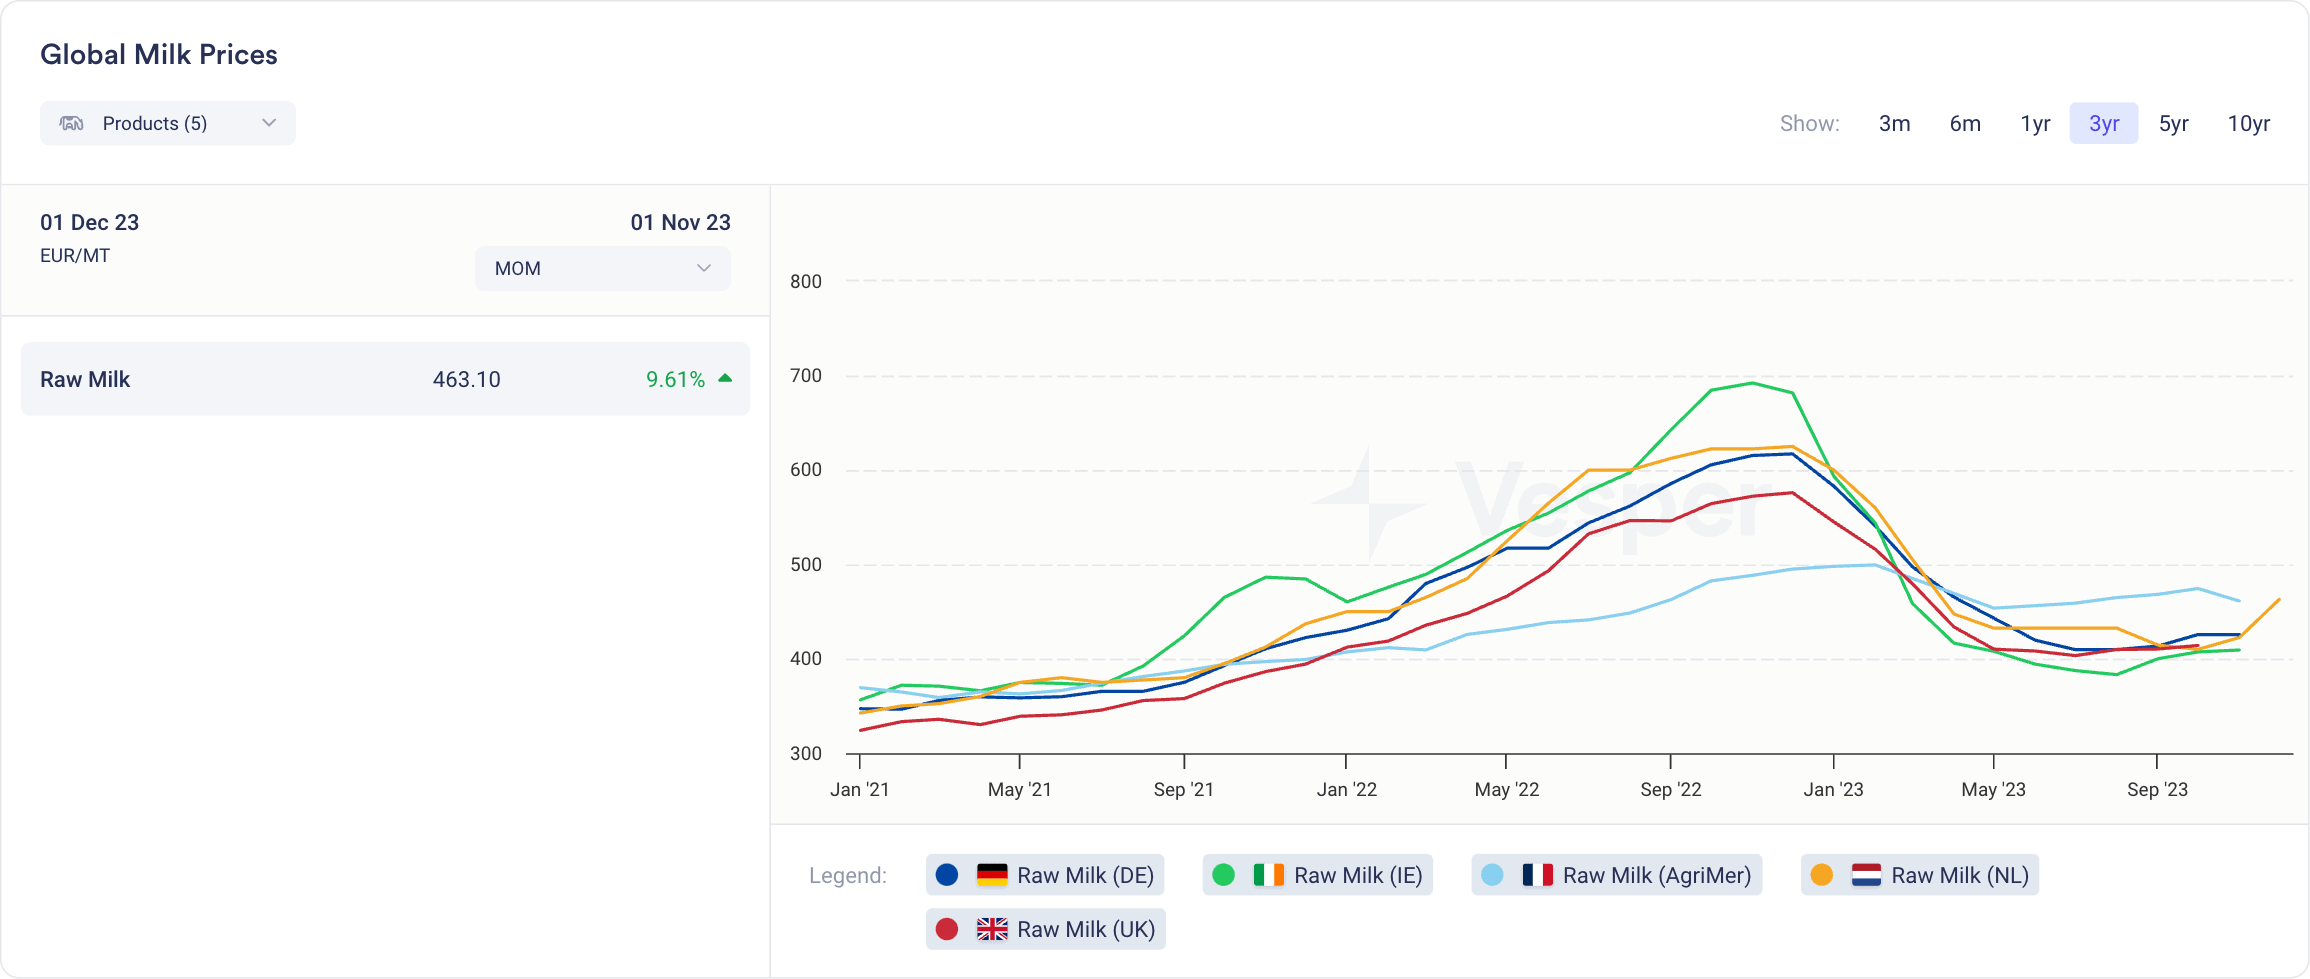
Figure 2: Global Milk Prices Northern Europe in EUR/MT
This stimulus yielded healthy milk production during the first half of 2023, culminating in a robust milk flush totalling 14,808,507 metric tonnes in May—a modest 1.11% increase compared to 2022 in Europe.
However, as the year progressed, the reduction in farm-gate milk prices diminished the appeal for farmers to further increase production. Despite maintaining healthy figures in the latter half of the year, the gap between milk production in 2023 and 2022 began to narrow, see Figure 3.
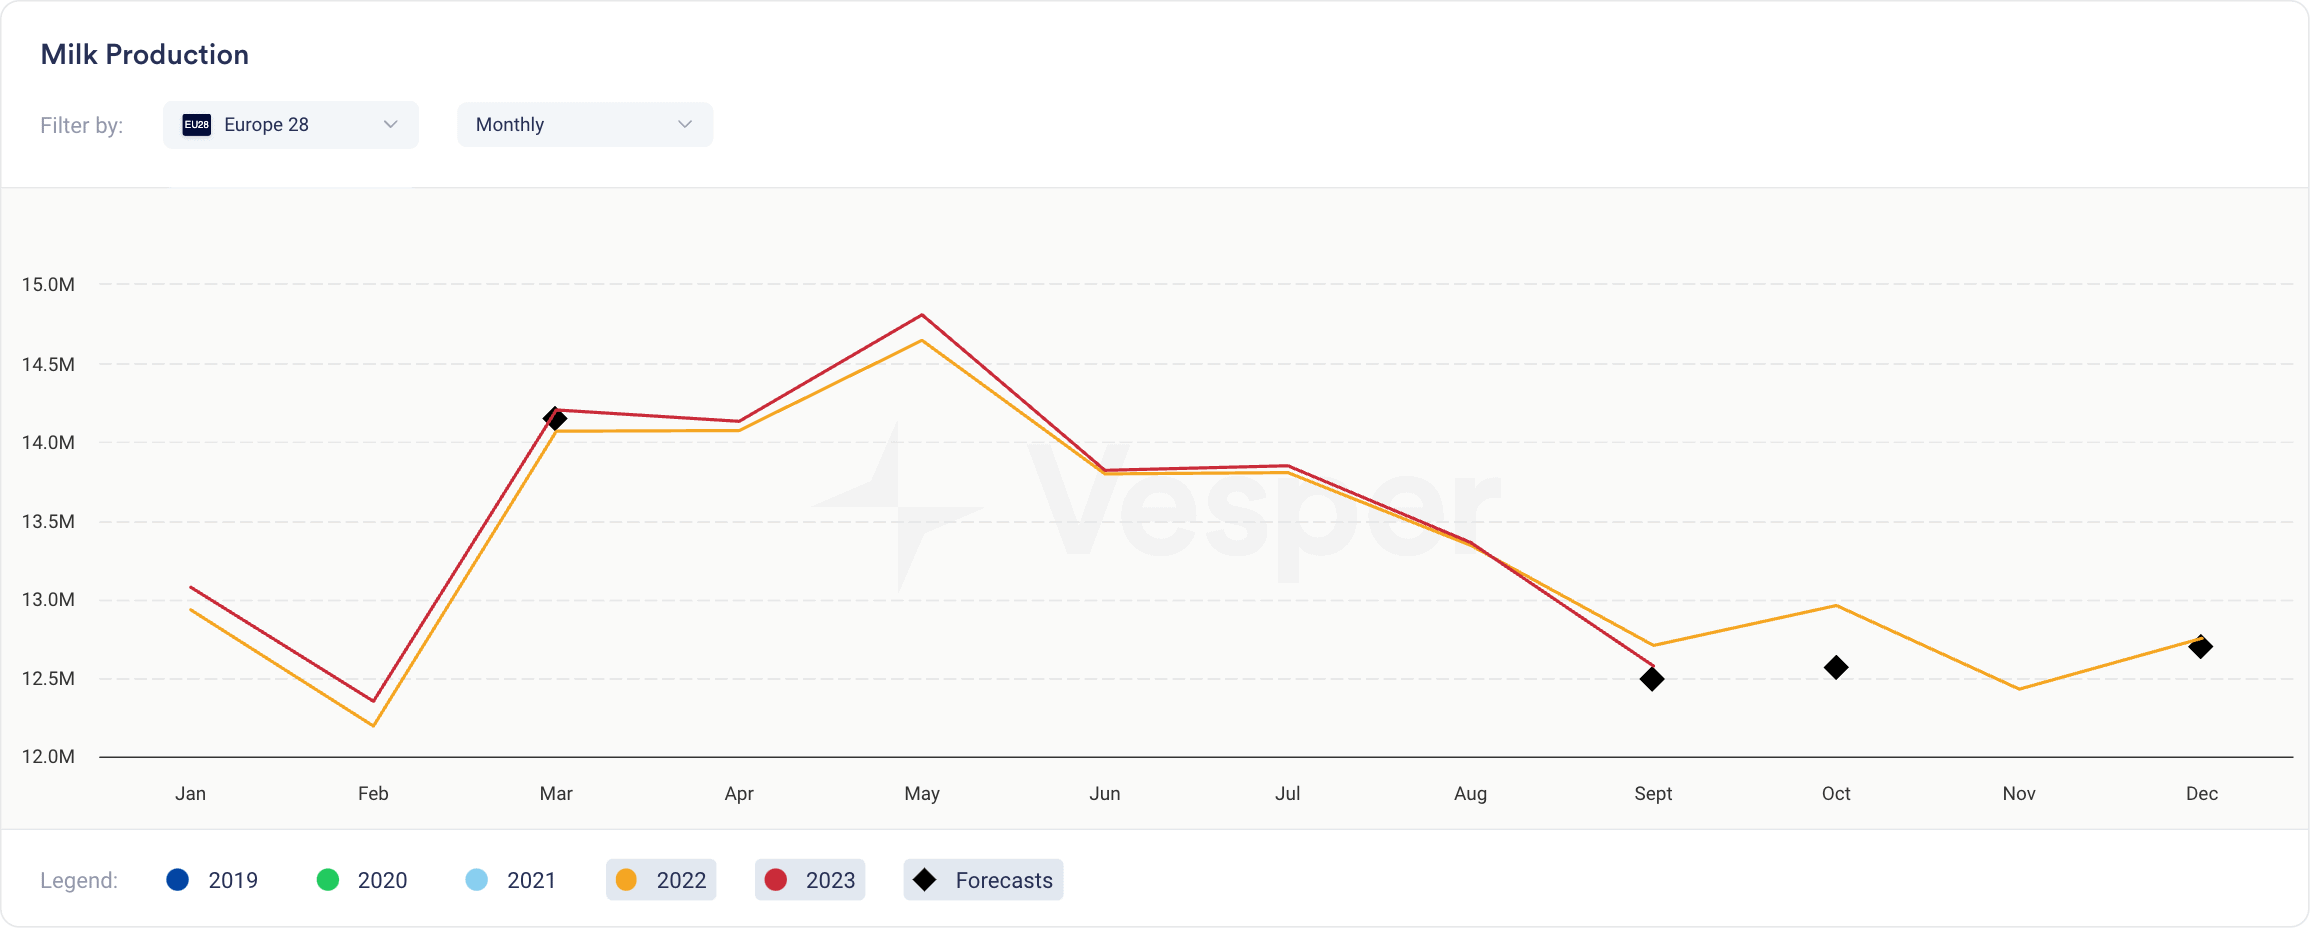
Figure 3: Europe 38 monthly milk production in MT
2. Cattle feed
The cost of cattle feed emerges as a critical factor influencing a farmer’s profit margin as it remains the predominant input cost. Understanding the delicate balance between farm-gate milk prices and feed costs is imperative, as it directly impacts the economic viability for farmers to increase feed intake, subsequently affecting milk production volumes.
E.g. As the gap between farm-gate milk prices and the expense of dairy cattle feed increases, farmers’ profit margins rise, making it increasingly interesting for them to increase the feed intake for their cows. This higher feed intake leads to greater milk production, accompanied by higher levels of fat and protein within the milk. Conversely, reduced profit margins will negatively impact milk production volumes.
In the US, prolonged pressure on the margin has led to reduced milk output. As depicted in Figure 4, the disparity between dairy cattle feed prices and class three milk prices illustrates this challenge. Note: in Vesper, the comparison can be made between other milk classes, such as all milk classes, class 4 milk, and more.
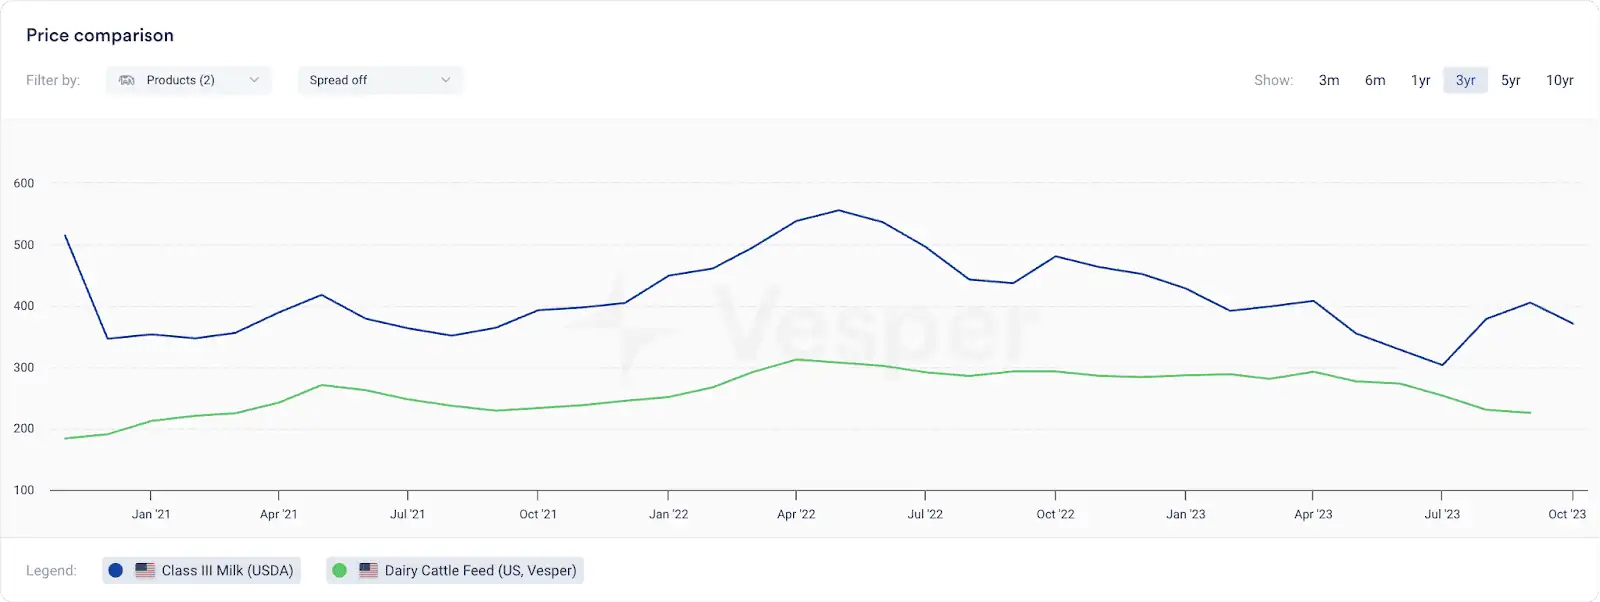
Figure 4: US Dairy Cattle Feed and USDA Class III Milk price comparison in USD/mt
3. Beef prices
Additionally, another motivating factor for farmers can be the pricing of beef. Elevated beef prices have the potential to enhance profit margins, particularly when the expenses associated with raising and maintaining cattle, including cattle feed, are high or on the rise. In such situations, producers might opt to sell their cattle for slaughter instead of bearing increased maintenance costs, especially when beef prices are favourable.
In Figure 5 for instance, the live cattle price of CME demonstrated record highs in October, while the margin on milk US stayed mediocre.
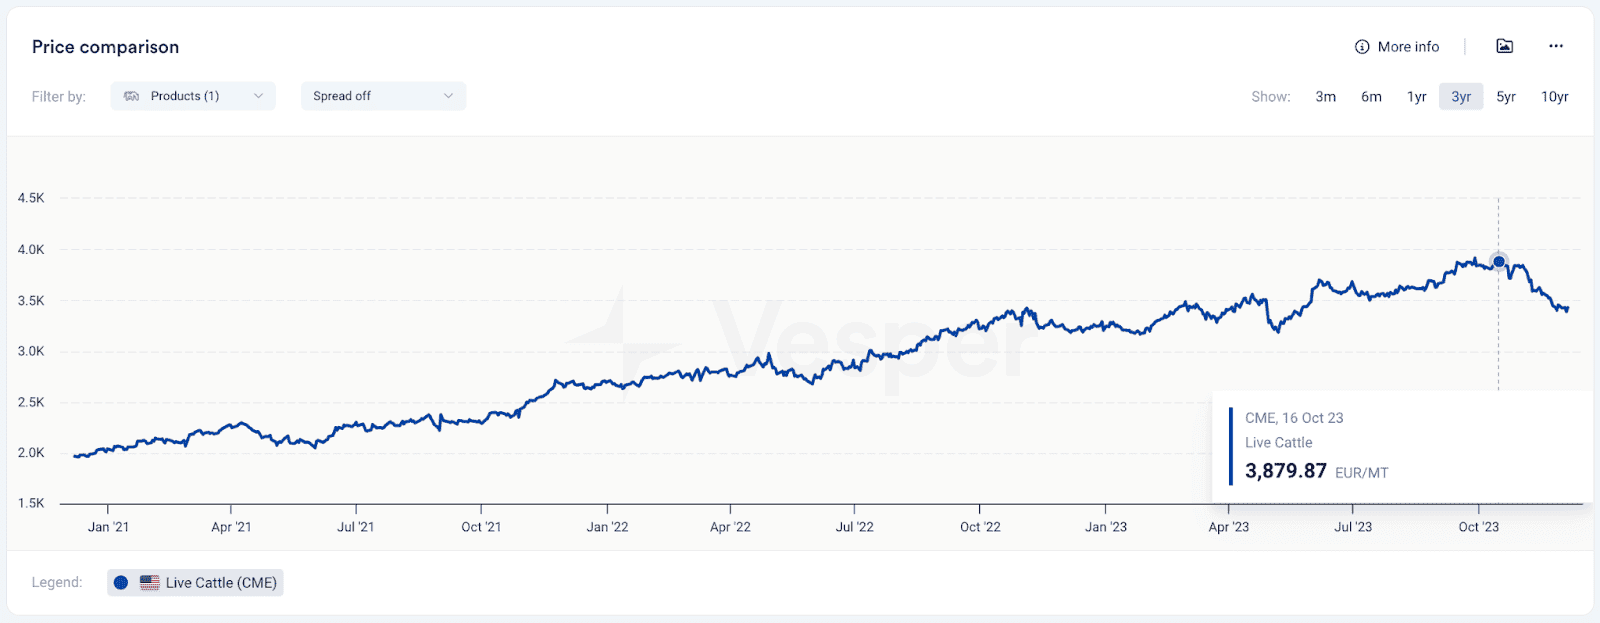
Figure 5: Live Cattle prices on the CME in EUR/MT
With substantial financial gains from selling cows for beef, the outcome was evident: a notable increase in cow slaughter between March and mid-August 2023, significantly impacting the herd size, as illustrated in Figure 6. Year-to-date figures indicate a 3.63% rise in cow slaughter compared to the previous year, 2022.
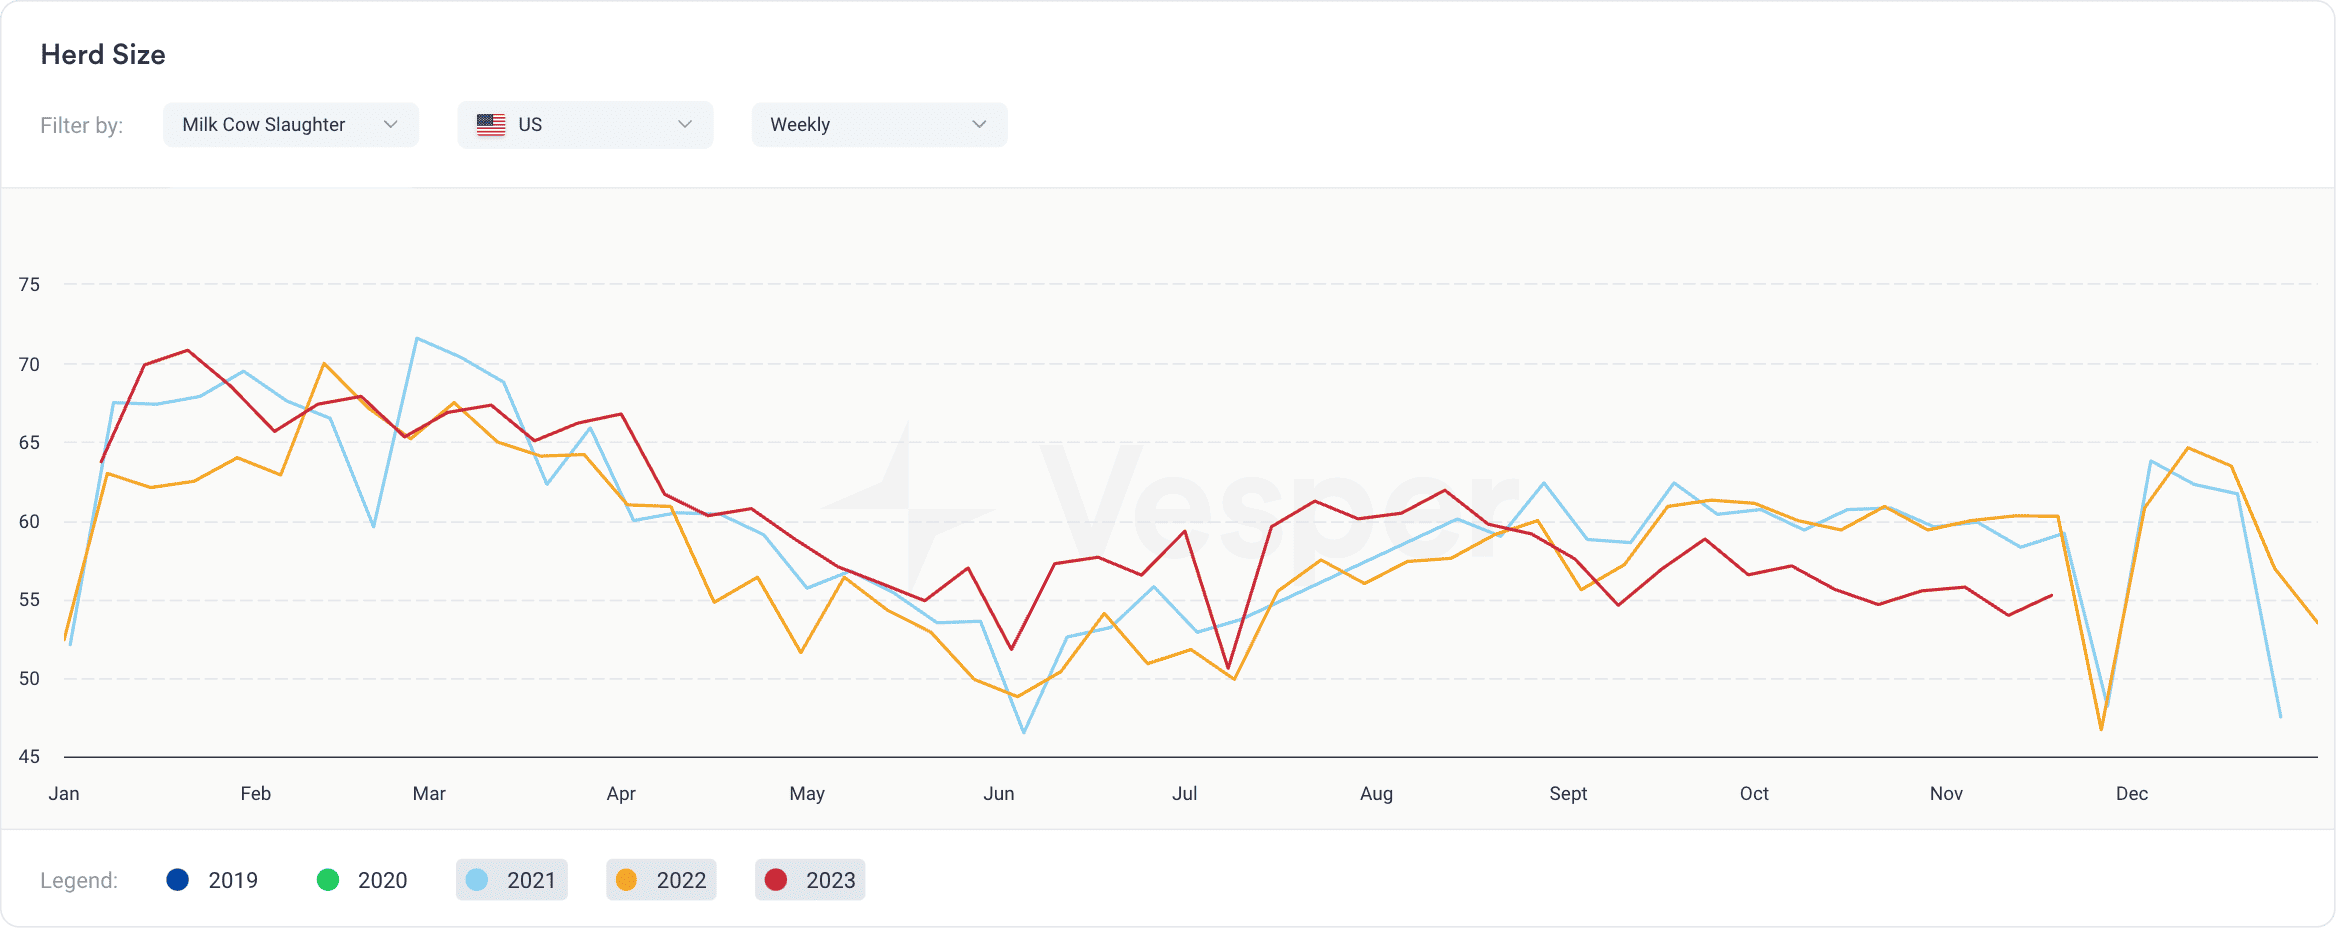
Figure 6: US weekly Milk Cow Slaughter (x1000 headcount)
Consequently, this led to a decline in milk production during the second half of the year compared to 2022, as depicted in Figure 7.
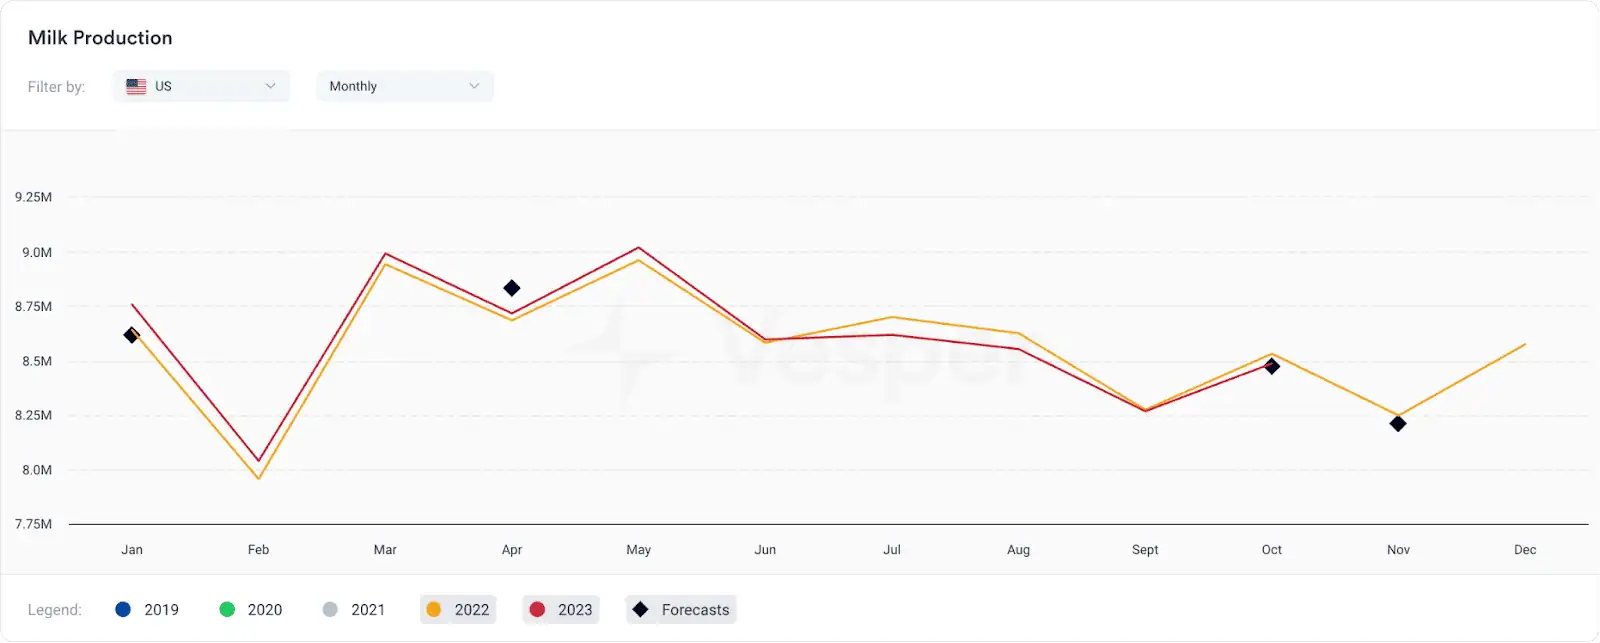
Figure 7: Monthly US Milk Production in MT
4. Weather conditions
The fourth milk production indicator is Weather conditions. Weather conditions play a significant role in determining milk production volumes, particularly when cows are exposed to warmer temperatures that can induce heat stress. Heat stress occurs when cows struggle to get rid of excess heat, leading to reduced food intake and, subsequently, lower milk production. This decline also includes decreased fat percentages and lower protein levels within the milk.
During spring and autumn 2023 in the Northern Hemisphere for instance, most regions in Europe experienced slightly warmer temperatures, with a subsequent decrease in temperature during the summer. This resulted in favourable conditions for milk production in slightly cooler areas, while warmer regions like Southern Europe and California experienced excessive heat, adversely affecting cows and leading to a significant decline in milk output.
In Europe, the mean temperature in the southern parts was 3 degrees Celsius higher than usual from June to August, according to The National Oceanic and Atmospheric Administration (NOAA), as illustrated in Figure 8.
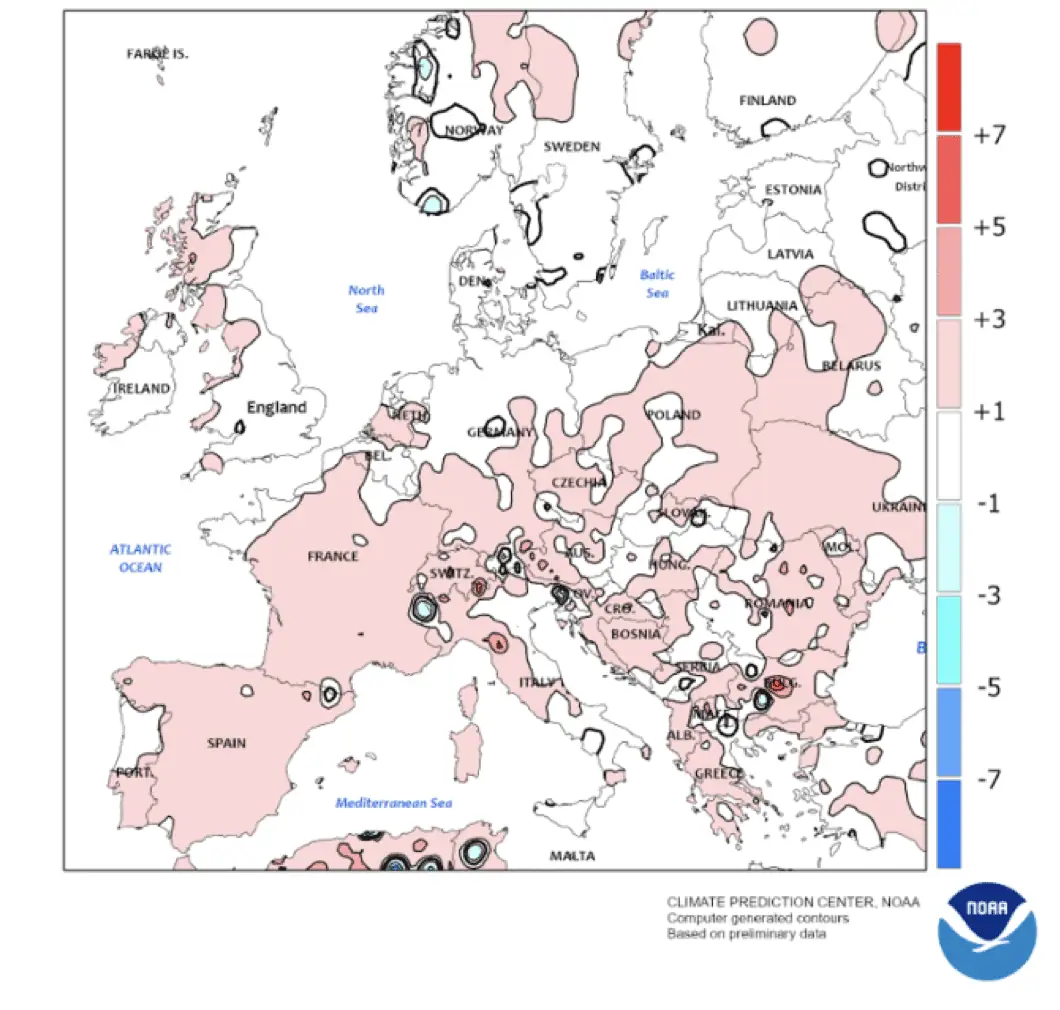
Figure 8: EUROPE – Temperature Anomaly (C) June- August 2023, according to NOAA
There was marginal stability in year-to-date milk production in Spain, registering a slight increase of 0.06% to 5,550,640 MT. Greece experienced a decrease of 1.36%, totalling 478,920 MT; Italy saw a decline of 2.36% to 9,495,970 MT, and France observed a decrease of 2.32%, reaching 17,787,780 MT as of September.
5. Pasture growth
The final indicator of milk production, closely tied to weather conditions, is pasture growth. This factor holds particular significance in New Zealand, where farmer margins are secondary to the value of pasture growth, considering that the country’s cows predominantly depend on grass as their primary feed source. Assessing pasture growth provides valuable insights into future milk production levels.
On Vesper you can assess whether the pasture growth is favourable by looking at the 30-day rolling average. In Figure 9 for instance, the 30-day rolling average has consistently been favourable throughout the year, particularly at the beginning and end of the year, significantly surpassing the 5-year average.

Figure 9: New Zealand Pasture Growth Index
This favourable pasture growth has resulted in New Zealand’s milk production remaining on par with last year, experiencing a slight increase of 1.55% year-to-date compared to the previous year.
Start monitoring these milk production indicators yourself!
As we witness the interconnectedness of pricing strategies, feed costs, beef prices, weather conditions, and pasture growth, it becomes evident that a holistic approach is necessary for understanding milk production fluctuations.
Gain the power to track and analyse these indicators yourself with real-time data from Vesper’s platform. Set up your free trial in just a few easy steps. Your free trial will be automatically cancelled after 14 days, so no strings attached!
