Your bakery’s profitability hinges on two fundamental ingredients: soft wheat and butter.
These commodities represent 45-65% of your raw material costs across most bakery products. In muffins, wheat accounts for 35-40% of ingredient costs while butter represents up to 40%. For cookies, butter’s share climbs even higher, sometimes reaching 50% due to higher fat content requirements.
Yet most procurement teams struggle to quantify how wheat and butter price swings affect finished product costs. When European butter prices fluctuate €700/mt within a season or wheat harvests shift regional pricing, what’s the actual impact on your margins?
The challenge: Compound products combine multiple ingredients with manufacturing costs, labor, and overhead. Unlike buying raw commodities directly, price volatility’s impact on final product costs isn’t immediately obvious.
The solution: Cost modeling that breaks down every component of your finished product pricing.
We’ll show you cost model examples for bread and cookies, explain the seasonal price drivers you should account for, and analyze current market conditions plus future outlook for wheat and butter.
Quantifying wheat’s impact: Bread cost model
Let’s examine exactly how wheat price volatility translates into bottom-line impact using a real bread production cost model.
Note that this article specifically examines soft wheat and its price drivers impacting bakery margins. Soft wheat flour forms the structural foundation of most bakery products, from bread and cakes to cookies and pastries.
For a comprehensive overview of all wheat categories we track on Vesper (including hard wheat, durum, and specialty varieties), check out our complete wheat types guide for industrial baking.
Bread cost structure breakdown
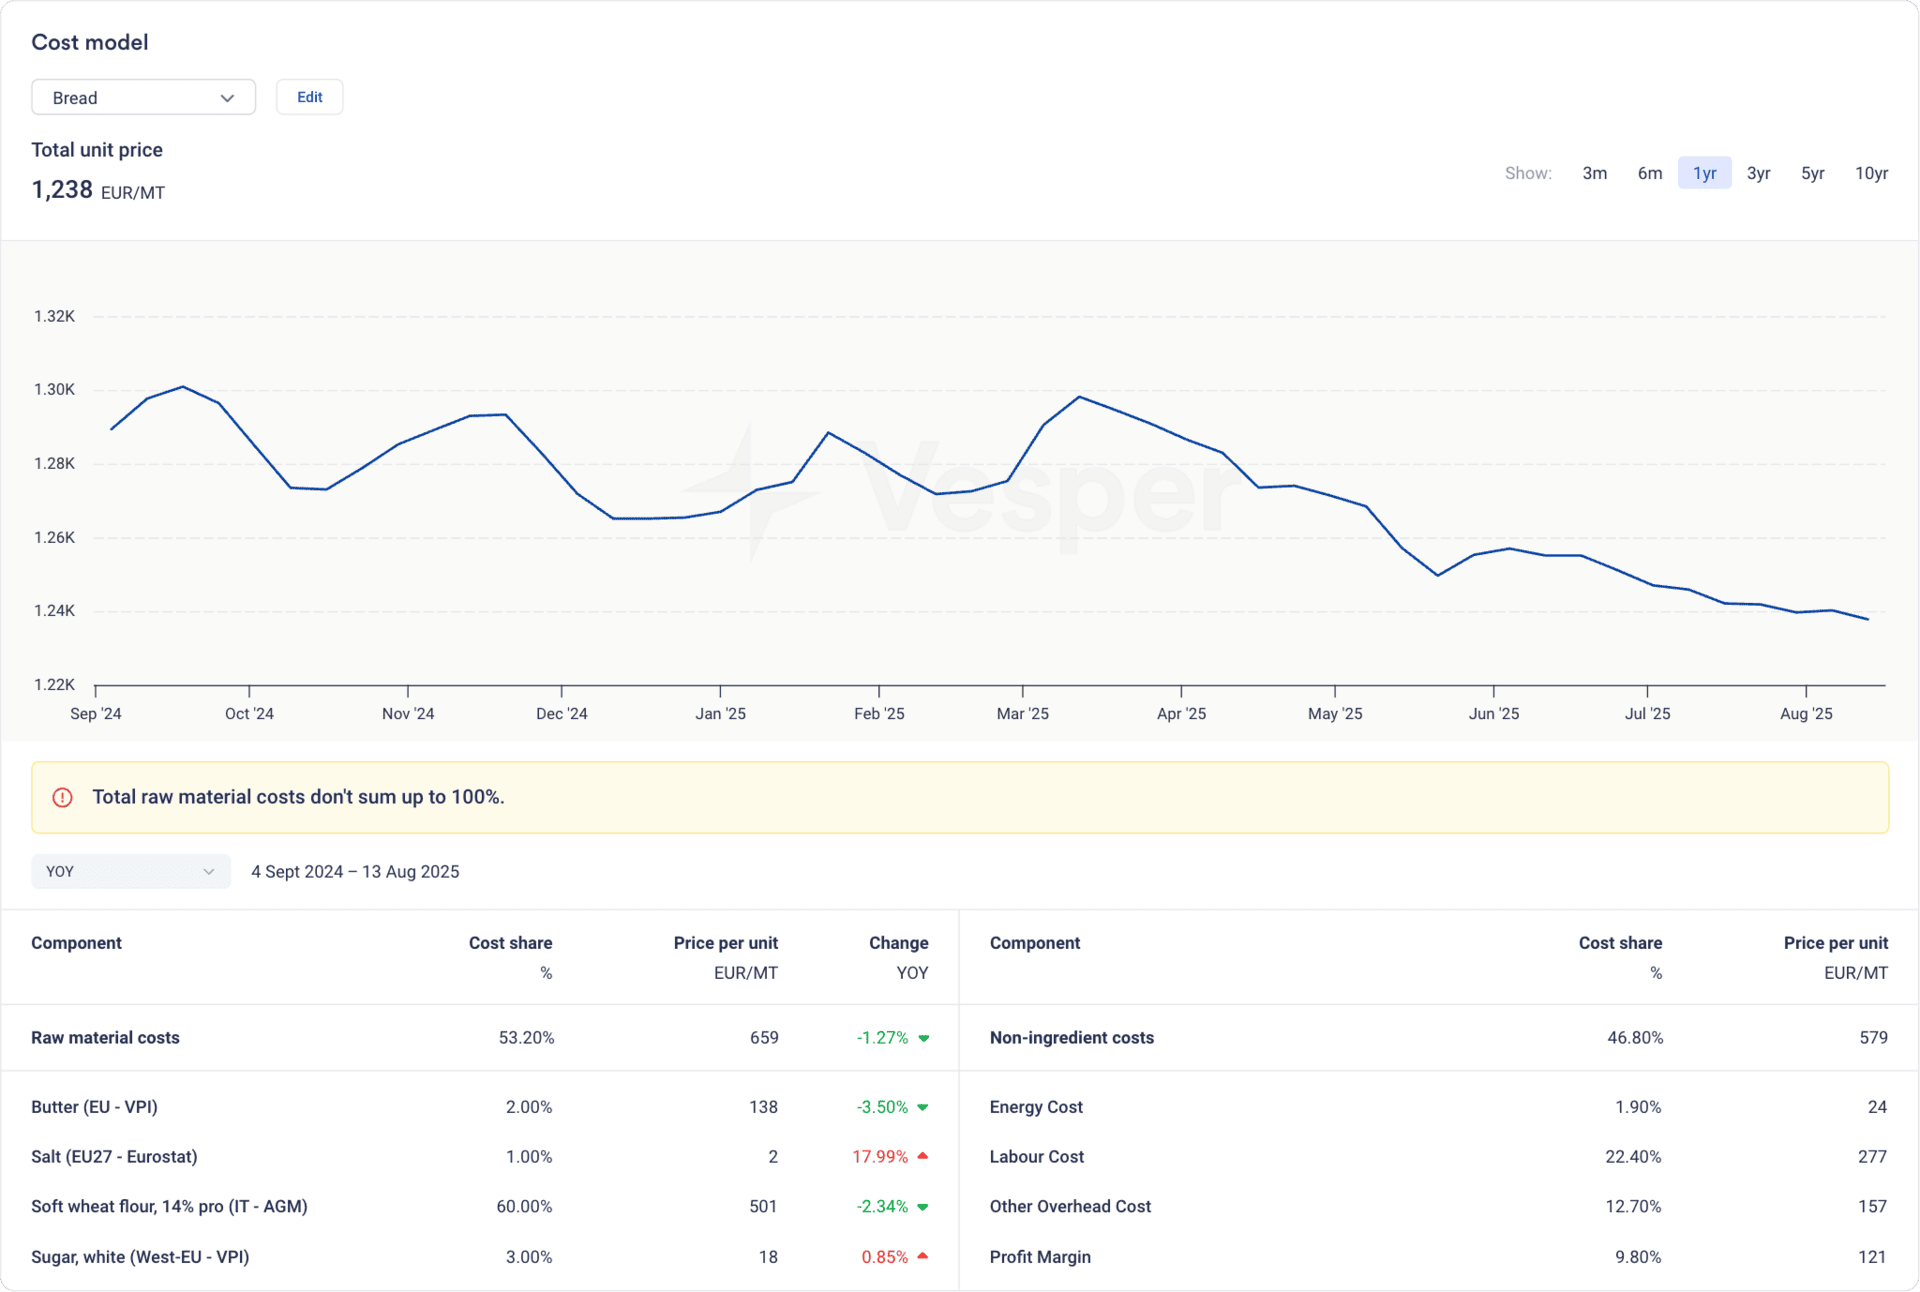
A typical bread cost model reveals the following structure, derived from Vesper’s pre-built cost model (see figure below):
Raw material costs (53.2% of total cost):
- Soft wheat flour (14% protein): 60.0% of raw materials = €501/mt
- Salt: 1.0% of raw materials = €2/mt
- Sugar: 3.0% of raw materials = €18/mt
- Butter: 2.0% of raw materials = €138/mt
Non-ingredient costs (46.8% of total cost):
- Labor costs: 22.4% = €277/mt
- Other overhead costs: 12.7% = €157/mt
- Energy costs: 1.9% = €24/mt
- Profit margin: 9.8% = €121/mt
Total unit price: €1,238/mt
Real impact of wheat price changes
Here’s where cost modeling becomes crucial. Over the past year, this bread model showed:
- Wheat prices declined 2.34% year-over-year
- Despite wheat representing 60% of raw materials, total product cost decreased by only 1.27%
- This demonstrates how non-ingredient costs buffer commodity price swings
Key insight: A 10% wheat price increase translates to approximately 3.2% impact on total bread cost (60% ingredient share × 53.2% raw material portion = 3.2% total impact).
For a bakery producing 1,000 tonnes monthly, a €50/mt wheat price increase means:
- Direct wheat cost impact: €30,000 additional monthly cost
- Total product cost impact: €39,600 monthly (including proportional non-ingredient costs)
Quantifying butter’s impact: Cookie cost model
Now let’s examine exactly how butter price volatility translates into bottom-line impact using a real cookie production cost model.
Cookie cost structure breakdown
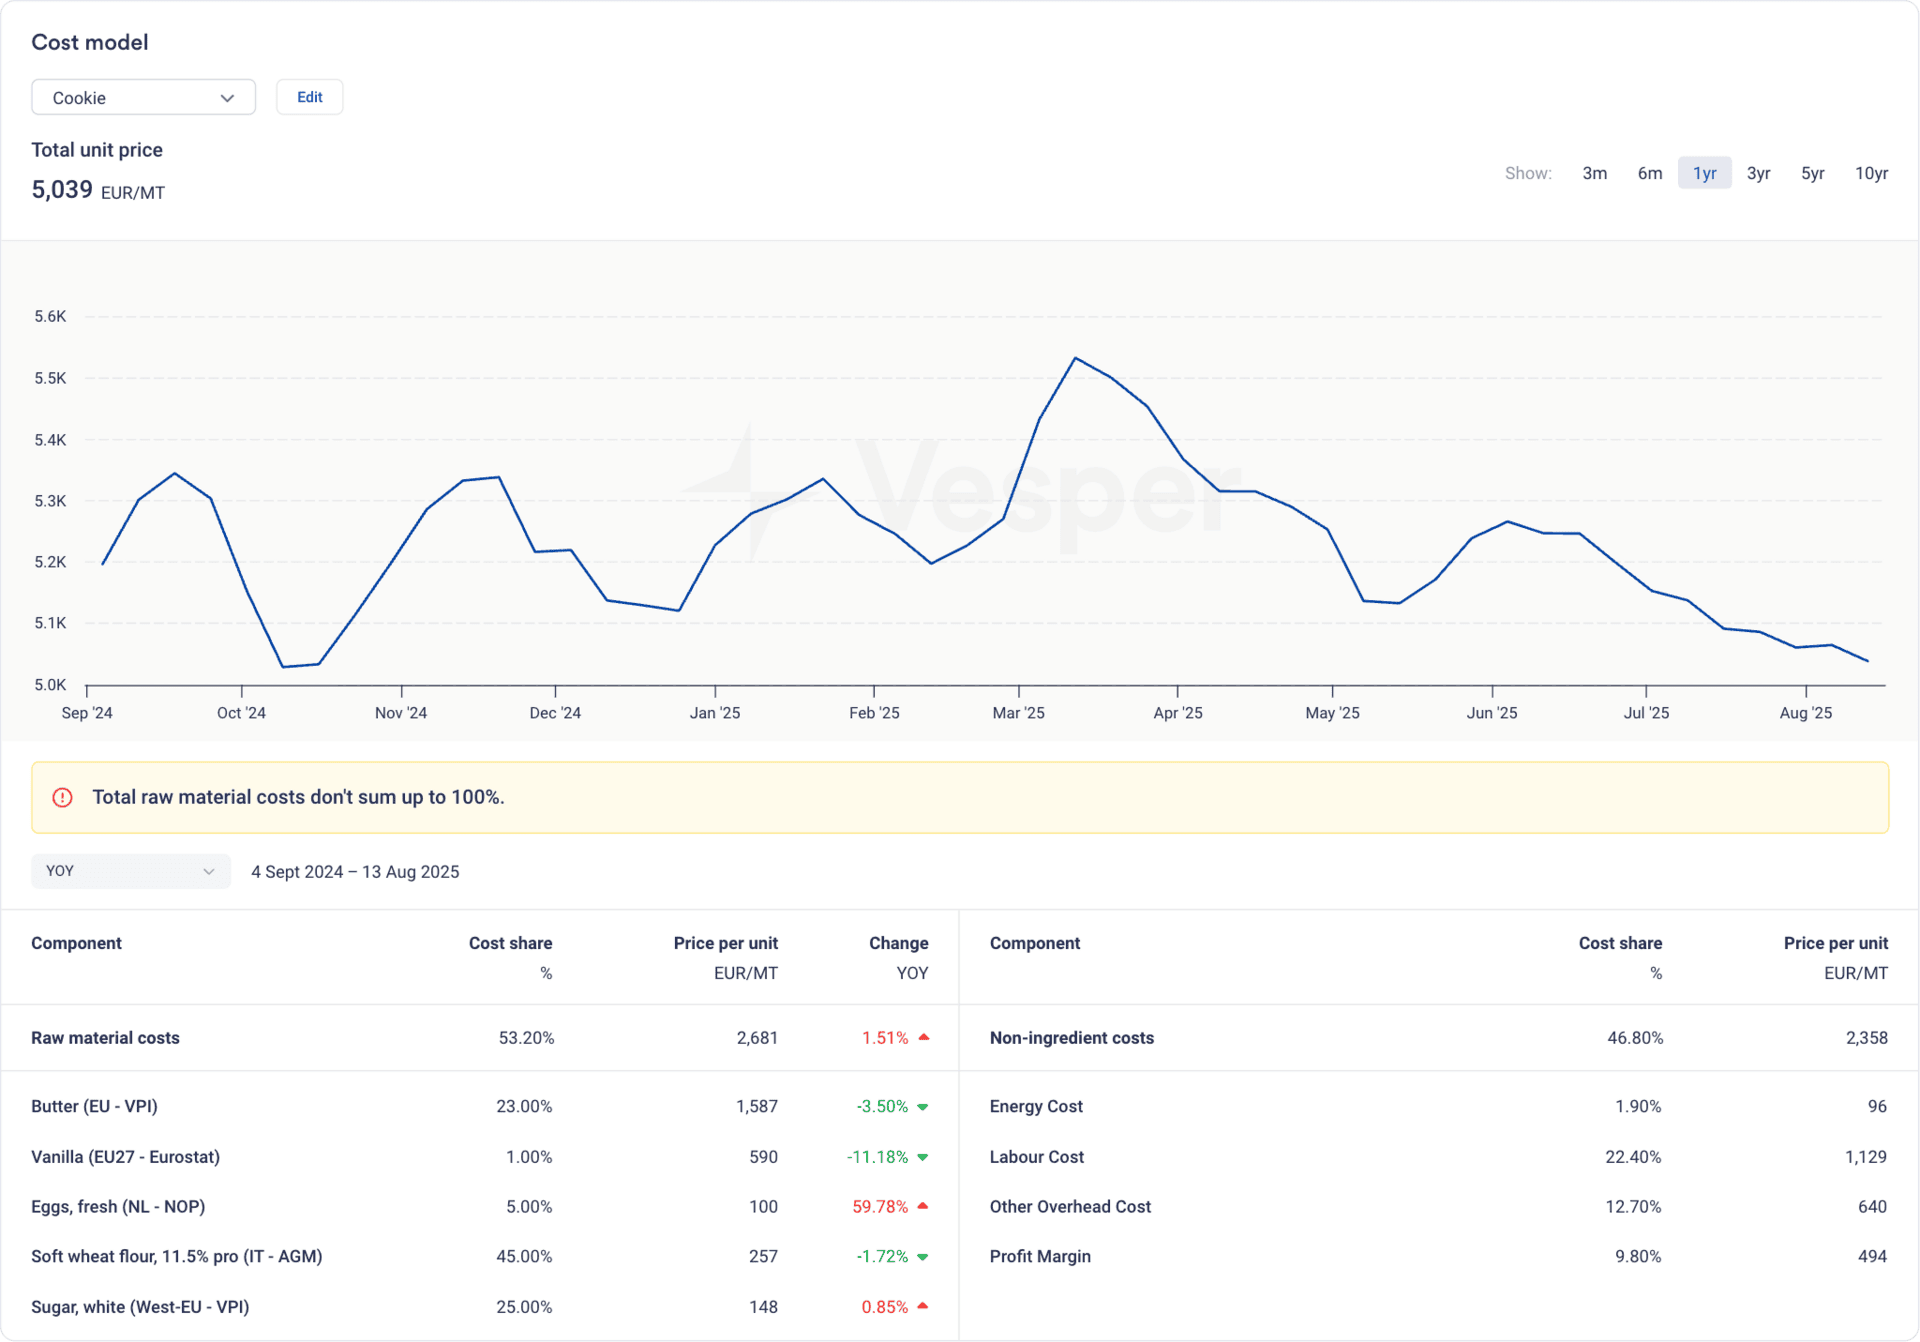
A typical cookie cost model reveals the following structure, derived from Vesper’s pre-built cost model (see figure below):
Raw material costs (53.2% of total cost):
- Butter: 23.0% of raw materials = €1,587/mt
- Soft wheat flour (11.5% protein): 45.0% of raw materials = €257/mt
- Sugar: 25.0% of raw materials = €148/mt
- Other ingredients (vanilla, eggs): 7.0% = €690/mt combined
Non-ingredient costs (46.8% of total cost):
- Labor costs: 22.4% = €1,129/mt
- Other overhead costs: 12.7% = €640/mt
- Energy costs: 1.9% = €96/mt
- Profit margin: 9.8% = €494/mt
Total unit price: €5,039/mt
Real impact of butter price changes
Here’s where cost modeling becomes crucial. Over the past year, this cookie model showed:
- Butter prices declined 3.50% year-over-year
- Despite butter representing 23% of raw materials, total product cost increased by 1.51%
- This demonstrates how other ingredient price increases can offset individual commodity declines
Key insight: A 10% butter price increase translates to approximately 1.2% impact on total cookie cost (23% ingredient share × 53.2% raw material portion = 1.2% total impact).
For a cookie manufacturer producing 500 tonnes monthly, a €150/mt butter price increase means:
- Direct butter cost impact: €18,300 additional monthly cost
- Total product cost impact: €30,200 monthly (including proportional non-ingredient costs)
Protecting your margins through strategic planning
Now you know exactly how wheat and butter price changes impact your margins. With Vesper’s cost models, you can adjust prices or ingredient percentages to identify how much wiggle room you have before price volatility seriously damages your profitability.
But knowing current impacts is only half the battle. Vesper’s price forecasts for wheat and butter help you identify optimal buying windows to minimize volatility’s impact on your margins before it happens.
Combined with Vesper’s market analysis, you gain the intelligence needed to understand the fundamental price drivers affecting your key ingredients. This market insight helps you anticipate price movements and time your procurement decisions strategically.
Below, we’ll explain the recurring price drivers that create basic buying opportunities throughout the year, then provide you with current market trends and the latest outlook for both wheat and butter.
Wheat price drivers
Soft wheat markets follow predictable seasonal cycles that smart procurement teams learn to anticipate:
Recurring soft wheat market patterns
Soft wheat markets follow predictable seasonal cycles that smart procurement teams learn to anticipate:
Harvest seasons (June-August): Northern Hemisphere harvests create supply influxes that typically pressure prices downward, offering forward contracting opportunities.
Growing season volatility (April-July): Weather concerns during critical growing periods drive speculative buying and price spikes as drought, excessive rainfall, or temperature extremes can shift global dynamics within weeks.
Demand stability: Unlike other commodities, wheat demand remains relatively consistent year-round, with modest increases during autumn-winter baking seasons.
Export competition: Southern Hemisphere harvests (December-February) compete with stored Northern Hemisphere supplies, often creating mid-year price pressure.
What’s driving soft wheat prices now?
Supply abundance: Canadian non-durum wheat supplies for 2025/26 are forecasted at 35.0 million tonnes—the highest since 2013/14. European soft wheat production ranges from 32.44 to 34.06 million tonnes depending on weather scenarios.
Strong export demand: Canadian wheat exports reached 21.62 million tonnes year-to-date, running 1.28 million tonnes ahead of previous years, forcing analysts to repeatedly revise production estimates upward.
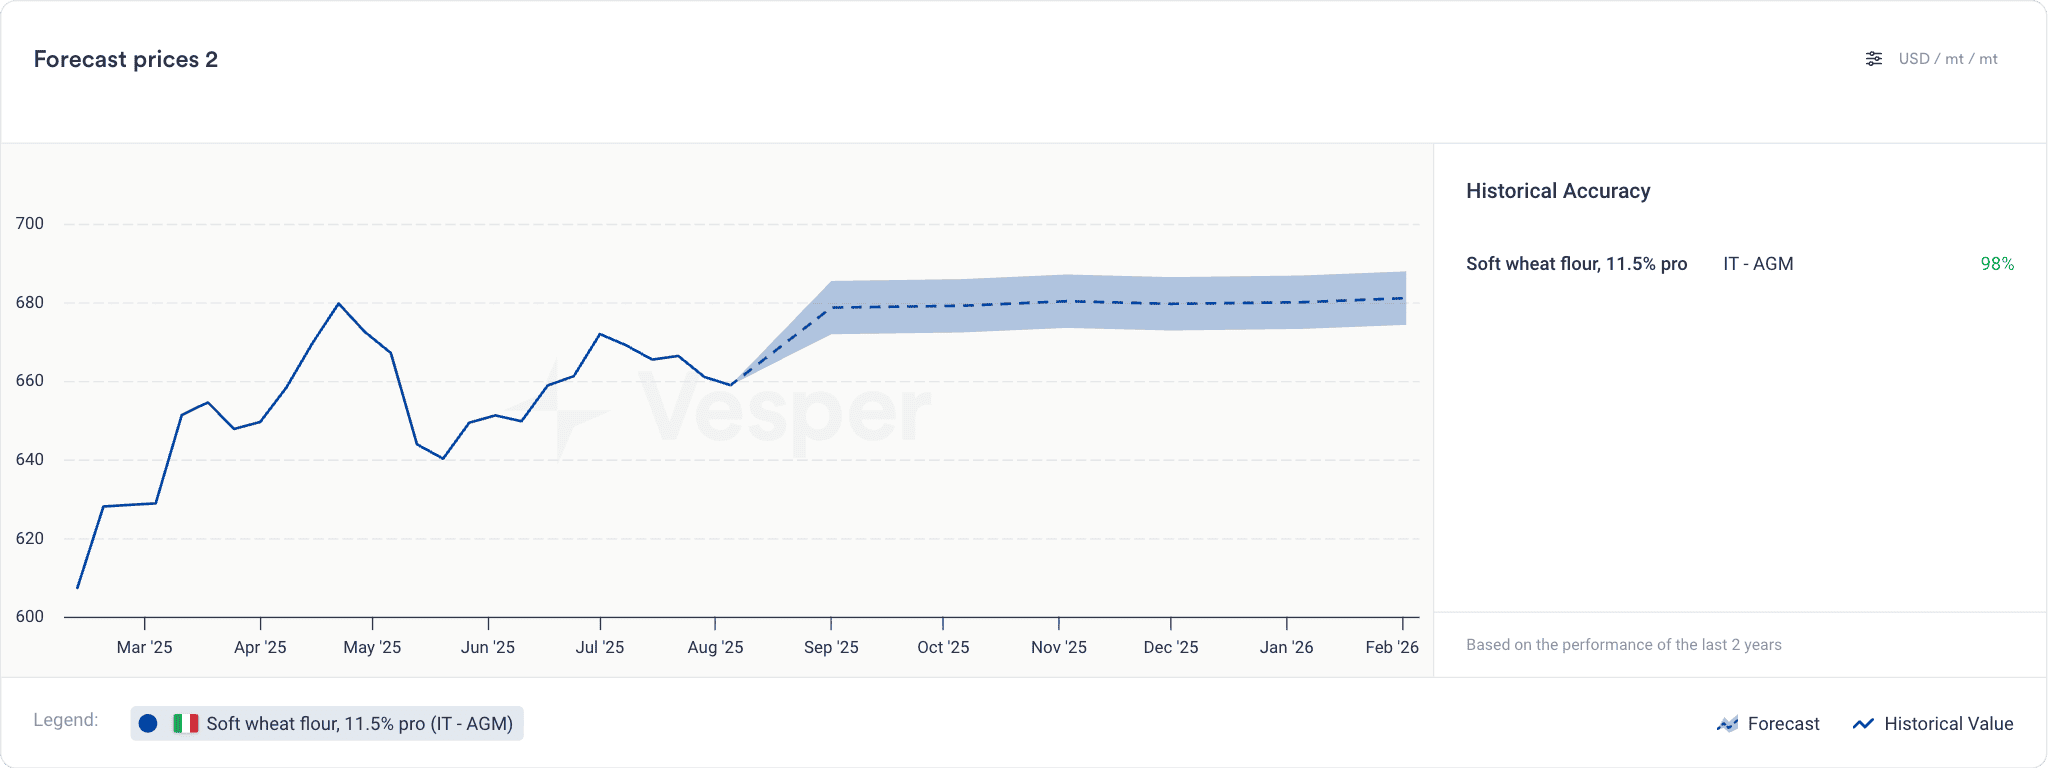
Soft wheat market outlook
Price forecast: Soft wheat flour (11.5% protein) shows current pricing around $650-680/mt, with forecasts indicating stability through 2025, then gradual increases toward $675-700/mt into 2026—a manageable 3-7% increase over the forecast period.
*This article was published on 18 August 2025. For more detailed or up-to-date wheat market price forecasts and analysis, please visit our market analysis section.
Butter price drivers
Butter price volatility follows highly predictable seasonal patterns driven by milk production cycles that procurement teams can anticipate.
Recurring butter market patterns
Milk flush season (April-June): Spring months bring increased milk production as cows benefit from improved pasture conditions and longer daylight hours, creating downward pressure on cream prices and subsequent butter costs.
Summer demand slowdown (June-August): Retail butter consumption typically declines during summer months, as seen in major markets like Germany and France, creating classic supply-demand imbalances.
Regional arbitrage opportunities: Butter markets consistently show significant price disparities—US butter typically trades $1,500-2,000/mt below European prices, while currency fluctuations can shift prices rapidly.
Seasonal production peaks: European butter production increases during peak milk flush periods (up 3.65% year-over-year recently), while consumption patterns follow predictable holiday and baking season cycles.
What’s driving butter prices now?
Supply-demand rebalancing: Current European butter production surpluses of ±26,000mt compared to previous years, combined with reduced export demand, are creating downward price pressure.
Seasonal weakness: Markets are experiencing typical summer demand slowdowns, with sellers reluctant to move below €7,000/mt despite cream prices indicating butter could be produced and sold at lower levels.
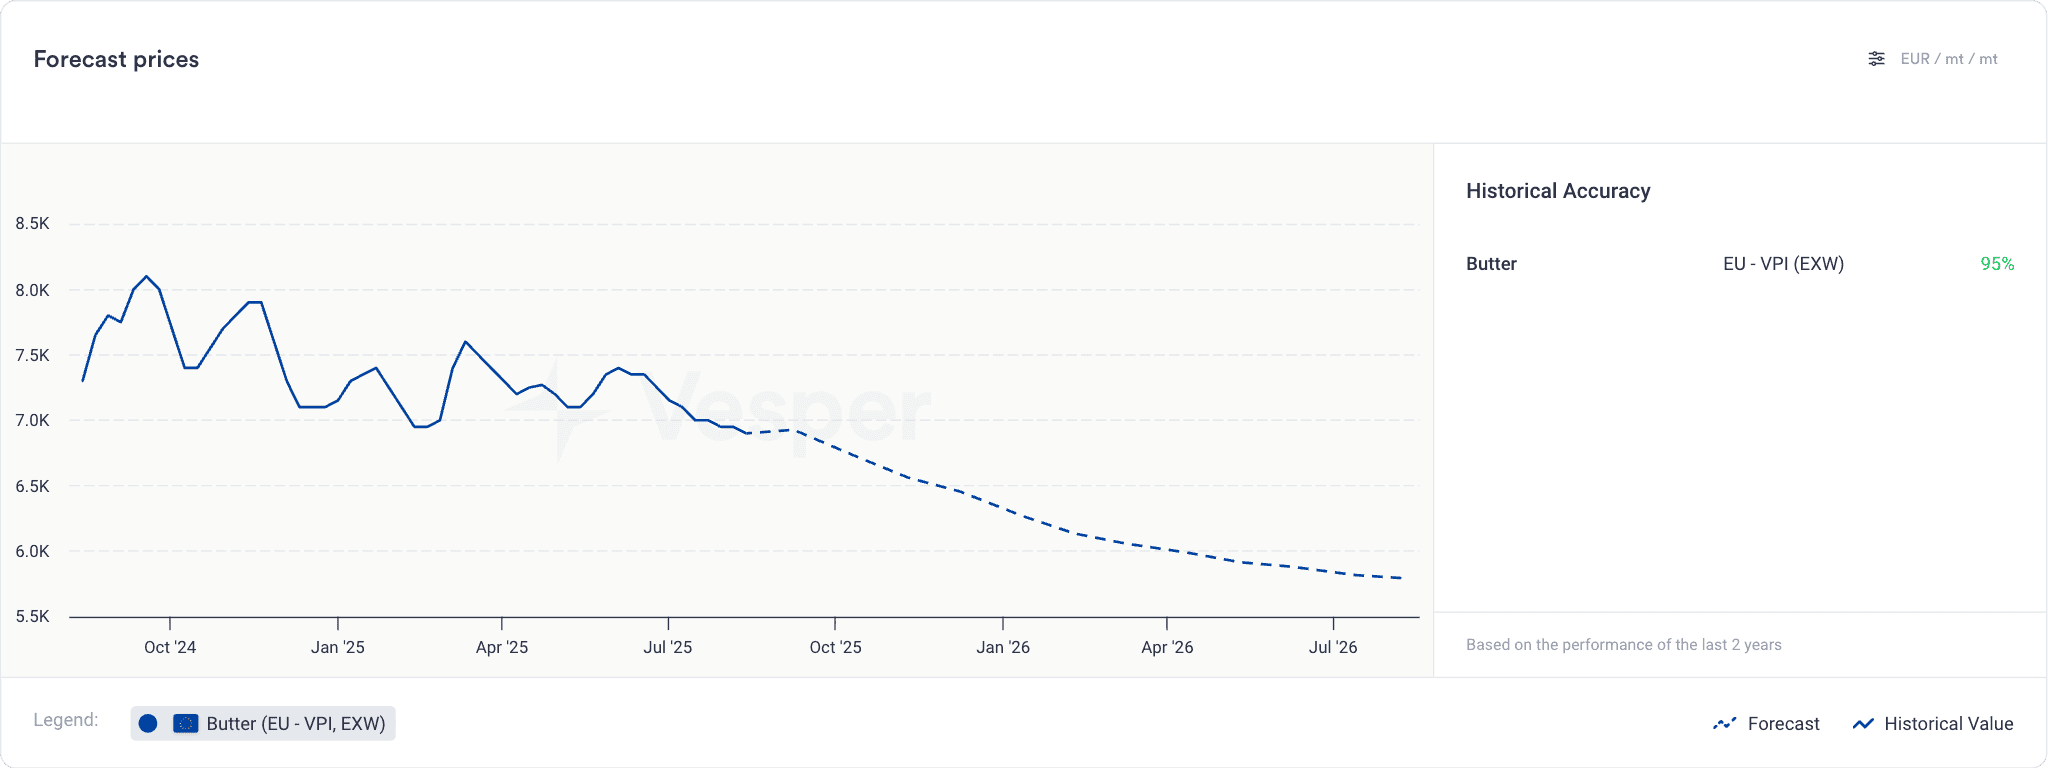
Butter market outlook
Price forecast: European butter shows current levels around €7,000-7,400/mt with forecasts indicating gradual decline toward €5,800-6,200/mt through 2026, representing potential 15-20% cost reduction over 18 months as normal seasonal patterns and improved production efficiency take effect.
*This article was published on 18 August 2025. For more detailed or up-to-date butter market price forecasts and analysis, please visit our market analysis section.
Building your own cost models
Understanding price dynamics only matters if you can apply them to your specific products.
Start with pre-built templates matching your product categories, then customize them to reflect your recipes and operations. Use the specific benchmarks that match your sourcing strategy—whether it’s butter prices from Germany, France, or Eastern Europe, or wheat from your preferred origins and protein specifications.
For step-by-step guidance on ingredient selection, cost configuration, and sensitivity analysis, check out our comprehensive cost modeling tutorial. You can also explore real-time wheat and butter pricing on the Vesper platform to build models that reflect actual market conditions for your specific sourcing needs.