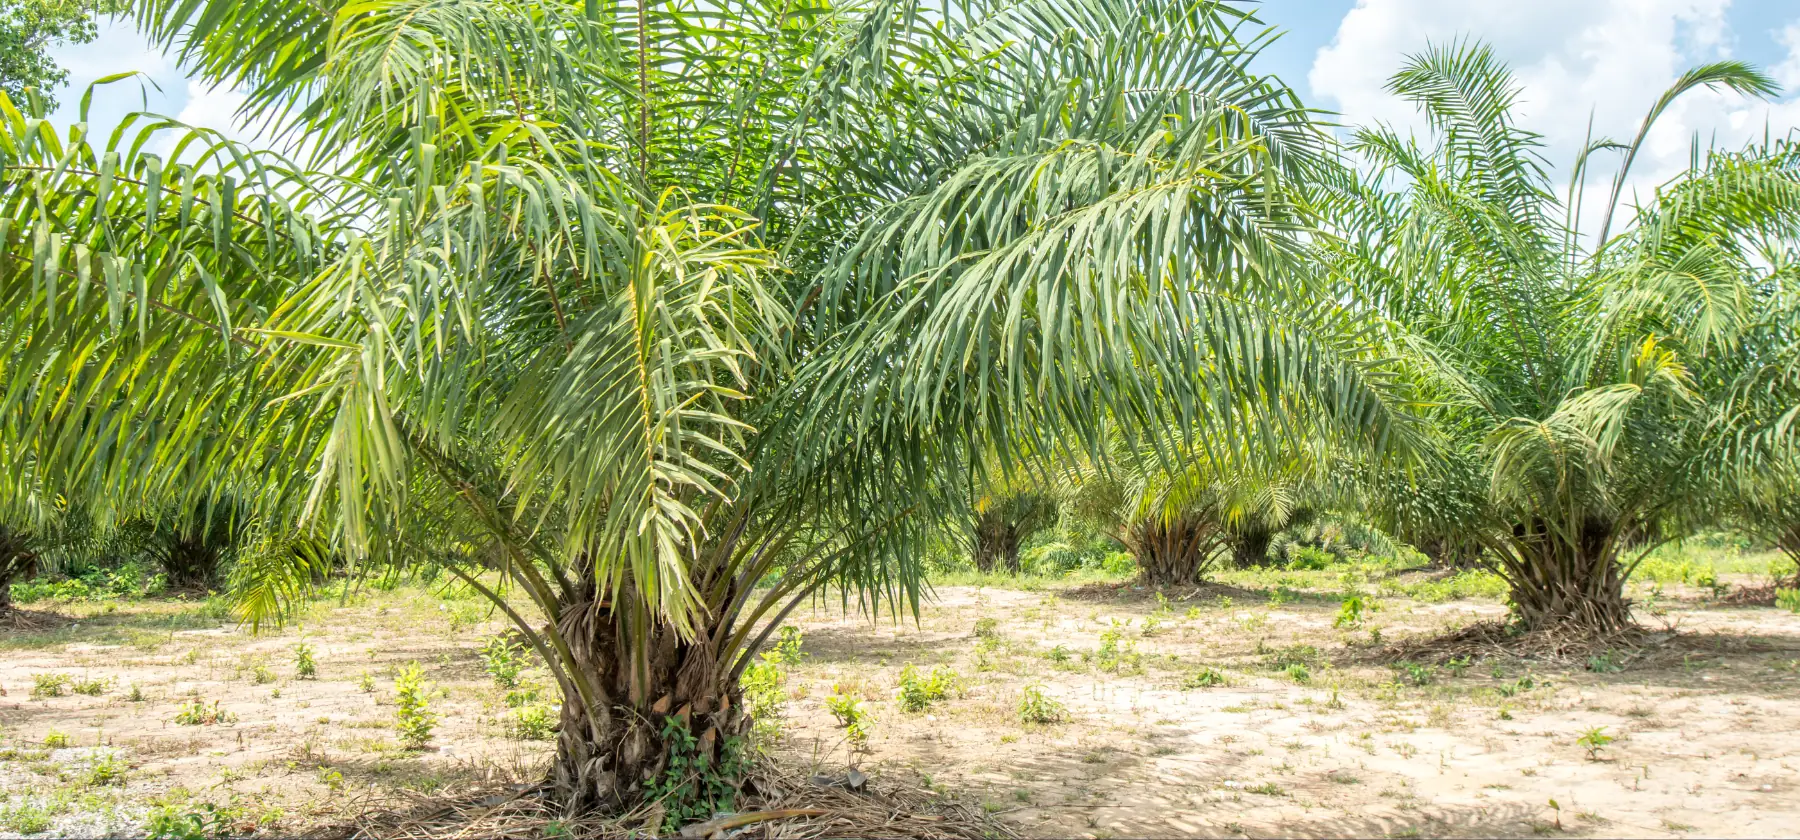
The global palm oil industry has witnessed an overall price decrease. This decline in the global palm oil prices can be attributed to several factors, including the decrease in week-on-week Brent Crude oil prices (as illustrated in Figure 1), reduced demand from both China and India, and an increase in September ending stocks in Malaysia, as reported by MPOB.
Global price changes include:
- The settlement price for Malaysian crude palm oil on the BMD, as of October 10, 2023, dropped to €705 | $748 per metric ton from €727 | $771 per metric ton during the same week of the previous year.
- The Vesper West EU Forward Price Index for Crude Palm Oil, as of October 9, 2023, registered a decline to €843 | $890 per metric ton (CIF Rotterdam, Dec) from €880 | $930 per metric ton during the corresponding period last week.
- The Malaysian spot price for crude palm kernel oil, as of October 9, 2023, exhibited weakening, falling to €745 | $787 per metric ton from €775 | $819 per metric ton as of September 21, 2023.
- The Vesper West EU Forward Price Index for Crude Palm Kernel Oil, as of October 9, 2023, decreased to €833 | $880 per metric ton (CIF Rotterdam, Nov-Dec) from €852 | $900 per metric ton during the same week of the previous year.
Figure 1: Historical Settle Per Contract, for Brent Crude Oil – ICE (EU)
Last week, Chinese demand muted due to the “Golden Week” holiday. Additionally, according to data from SEA, India decreased their palm oil imports by 26% in September due to high oil stocks in the country (see Figure 2). Furthermore, the Malaysian ending stocks figures for September, as reported by MPOB, shifted closer to the medium: Higher end (+16.5%), medium (+10.9%), lower end (+1%). This contrasted with Malaysian production figures, which fell between the medium and lower estimates, and export numbers that fell below the lowest estimates. Despite better October export data from surveyors, the downward trend in prices continued.
Figure 2: Supply and Demand Graph for Palm Oil – India
Last week’s estimates of MPOB numbers by various analysts:
– Production: Higher end (+9%), medium (+5.22%), lower end (+2%)
– Consumption: Higher end (+101%), medium (+47.8%), lower end (+28.8%)
– Exports: Higher end (+8%), medium (+6%), lower end (+ 2%)
Key market figures published by MPOB (in mt):
– Production: 1,829,000 (+4.33%)
– Exports: 1,196,000 (-2.11%)
– Ending stocks: 2,314,000 (+9.6%)
– Consumption at 451,000 (+84%)
Key market figures published by AMSPEC (in mt):– Malaysia 1-10 Oct vs. 1-10 Sept palm oil export: 395,890 vs 305,594 (+29.55%)
Key market figures published by ITS (in mt):
– Malaysia 1-10 Oct vs. 1-10 Sept palm oil export: 394,570 vs 350,823 (+12.47%)
Download our Vegetable Oil Highlights for free and enjoy more insights on the global palm oil market.


