Historical Fish Data
Historical fish data provides a valuable perspective on price trends and market dynamics over time. For anyone involved in the fish industry, from buyers to traders, understanding historical pricing trends is crucial for predicting future price movements and making strategic decisions.
Understanding Historical Price Trends: The Case of Tuna Big Eye
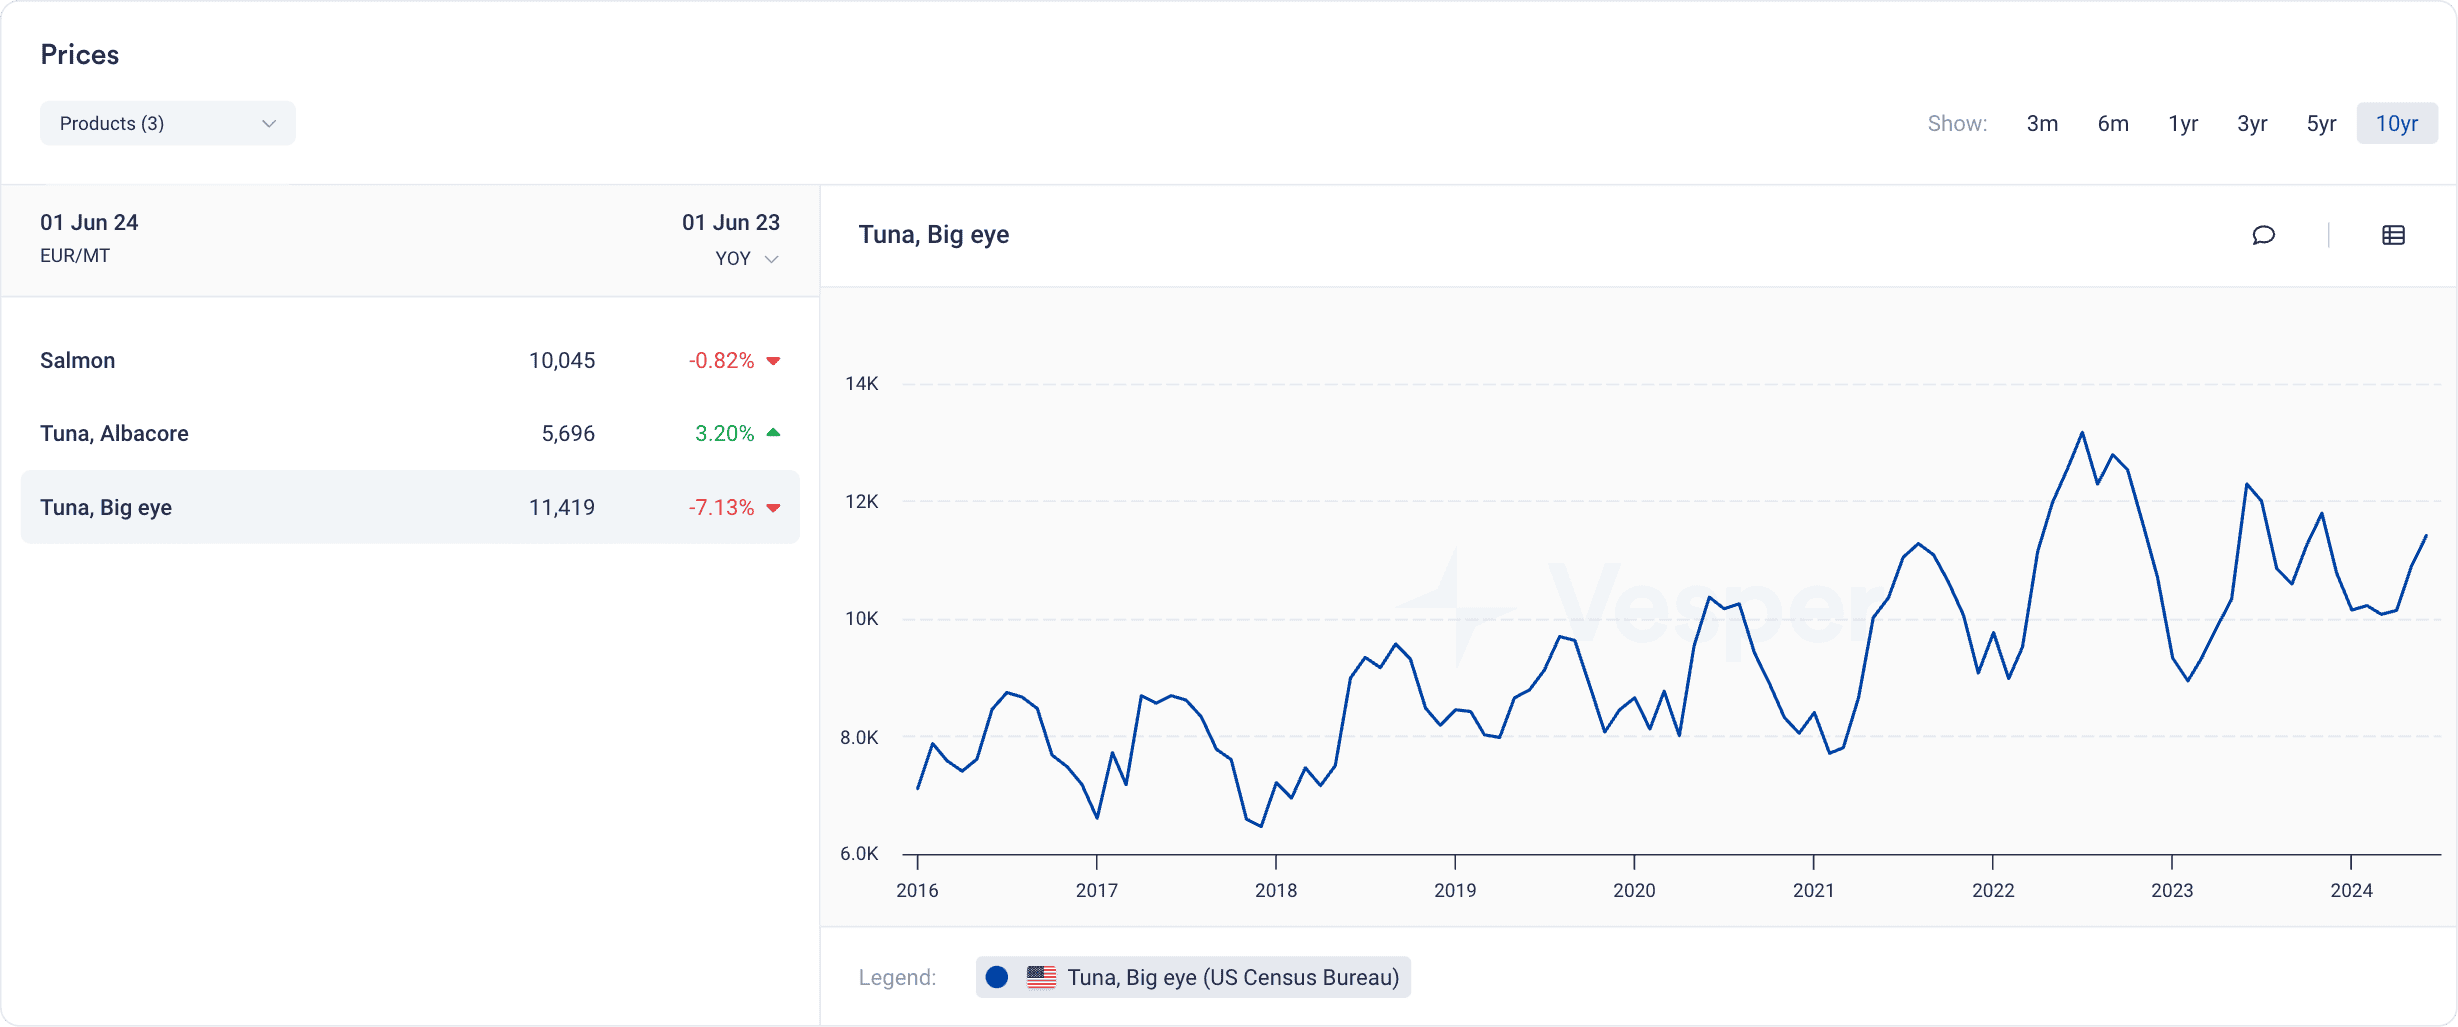
The historical price trends for Tuna Big Eye, as shown in the image hosted on Vesper’s commodity intelligence platform, highlight the value of historical data in the fish market. Over a ten-year period, the prices for Big Eye Tuna have exhibited significant fluctuations.
- Example: Prices were relatively low in 2016 but spiked in 2017 due to factors such as reduced catch volumes and increased demand in key markets. After stabilizing for a while, another peak occurred in 2020, likely influenced by disruptions in supply chains caused by global events like the COVID-19 pandemic.
Such historical price data is crucial for various market participants, enabling them to understand past trends and predict future market behavior. Here’s how different personas—buyers, sellers, and traders—might interpret this data to develop strategies:
Buyers
Buyers, such as wholesalers, retailers, and restaurants, use historical data to anticipate future price movements and make informed purchasing decisions.
- Strategy: Observing the pattern of price peaks in 2017 and 2020, buyers might predict similar disruptions in the future, possibly due to environmental changes or regulatory shifts. To mitigate the risk of buying at high prices, they might choose to purchase larger quantities of Tuna Big Eye ahead of anticipated price increases. Those with storage capabilities might opt to buy more during price dips, as seen in late 2020 or early 2021, and stockpile for future high-demand periods. Additionally, to avoid potential future price hikes, buyers could consider exploring alternative species like Albacore or Yellowfin Tuna or sourcing from markets with more stable pricing.
Sellers
For sellers, including fishing companies and processors, the historical trends offer insights into optimal times for harvesting and selling.
- Strategy: The data shows that prices tend to spike every few years, suggesting that sellers might plan to ramp up their fishing efforts just before these anticipated peaks or hold back inventory until the market conditions are more favorable. Sellers might also adjust their production levels if a future price drop is predicted due to increased supply or other market conditions, focusing instead on value-added processing like canning or smoking to maintain profitability. To further mitigate risks, sellers could diversify their product offerings or enter different markets if they expect continued volatility for Tuna Big Eye.
Traders
Traders, who focus on buying and selling fish as commodities, analyze historical price fluctuations to forecast future market volatility and identify arbitrage opportunities.
- Strategy: The significant price changes in 2017 and 2020 suggest that Tuna Big Eye prices are prone to sharp rises and falls. Traders might prepare for similar volatility by setting up strategic buying positions during low-price periods and selling during anticipated spikes. If the pattern indicates a price spike every 3-4 years, traders could anticipate the next spike around 2024-2025. Additionally, to manage risk, traders may consider using futures contracts to lock in current prices for future delivery or diversifying their investment portfolios to include other fish species or commodities with different volatility patterns.
Key Historical Data Disruptions in the Fish Market Over the Past Decades
The fish market, like many other commodity markets, has experienced several significant disruptions over the past few decades. These disruptions have been caused by a variety of factors, including environmental changes, economic crises, regulatory shifts, and global events. Understanding these key disruptions is crucial for market participants who need to anticipate potential future market dynamics and make informed decisions. Here are some of the most notable historical data disruptions that have shaped the fish market:
1. El Niño Events and Climate Change (1990s – Present)
El Niño, a climate phenomenon characterized by the warming of ocean surface temperatures in the Pacific, has had a profound impact on global fish stocks and prices.
- Example: During El Niño years, warmer waters can cause shifts in fish migration patterns and reduce the availability of cold-water species like anchovies and sardines. The strong El Niño event of 1997-1998, for instance, caused a significant decline in the Peruvian anchovy catch, one of the world’s largest fishery stocks. This event not only disrupted the fish market but also led to increased prices for fishmeal and fish oil, essential inputs in aquaculture feed. The resulting supply shortages drove up prices globally and forced many buyers to seek alternative sources or species.
Climate change has also exacerbated these disruptions over the past decades, leading to more frequent and severe El Niño events. The increasing sea temperatures and ocean acidification have affected the distribution and abundance of key fish species, such as cod stocks in the North Atlantic, leading to fluctuating prices and changing trade patterns.
2. Overfishing and Stock Depletions (1980s – 2000s)
Overfishing has been a persistent issue in global fisheries, leading to the depletion of several key fish stocks.
- Example: During the 1980s and 1990s, excessive fishing pressure led to the collapse of the Atlantic cod stocks off the coast of Newfoundland, Canada, one of the most famous examples of fishery collapse. The moratorium on cod fishing in 1992 resulted in immediate economic hardship for thousands of fishers and related businesses. Cod prices skyrocketed as supply dwindled, and the market had to shift to other species, such as haddock and pollock, to fill the gap. The impact of overfishing has also been felt in other regions, such as the depletion of Bluefin tuna in the Mediterranean and Atlantic, leading to tighter regulations and fluctuating prices.
The consequences of overfishing have led to stricter fishing quotas and regulations in many parts of the world. For instance, the European Union has implemented a Common Fisheries Policy to regulate fishing practices and ensure sustainable stock levels, affecting supply and, consequently, prices.
3. Regulatory Shifts and Trade Policies (2000s – 2010s)
Regulatory changes and trade policies have significantly impacted the fish market, influencing both supply and demand.
- Example: In the early 2000s, the European Union introduced stringent regulations to combat Illegal, Unreported, and Unregulated (IUU) fishing. These measures, which included stricter documentation and certification requirements for fish imports, caused significant disruptions in the supply chain, particularly for countries that relied heavily on fish exports to the EU. Prices for several species, such as hake and swordfish, were affected as supply tightened due to the enforcement of these new regulations.
Additionally, trade policies such as tariffs and embargoes have caused market disruptions. For example, during the US-China trade war in the late 2010s, tariffs were imposed on various seafood products, including salmon, shrimp, and tuna. This led to shifts in trade flows, with China looking for alternative markets, while US buyers sought new suppliers. These changes caused price volatility and forced market participants to adapt quickly to the new trade landscape.
4. Economic Crises and Market Shocks (2008 – 2009, 2020)
Economic crises have historically caused significant disruptions in the fish market.
- Example: The global financial crisis of 2008-2009 resulted in a sharp decline in consumer spending and demand for premium seafood products, such as lobster, shrimp, and Bluefin tuna. Many seafood restaurants and high-end retailers faced reduced foot traffic and demand, leading to a drop in prices. Producers and traders were forced to adapt by lowering prices, reducing catch volumes, and seeking alternative markets.
More recently, the COVID-19 pandemic in 2020 created unprecedented disruptions in the global fish market. Lockdowns, social distancing measures, and restrictions on international trade led to reduced fishing activities, processing plant shutdowns, and logistical challenges. The pandemic particularly impacted the supply chains for fresh fish, as demand from restaurants and food service sectors plummeted. In contrast, there was a surge in demand for canned and frozen fish as consumers shifted to shelf-stable products during lockdowns. This shift led to price volatility across different segments of the market and forced many businesses to quickly pivot their strategies to meet changing consumer preferences.
5. Technological Advances and Aquaculture Growth (2000s – Present)
The rise of aquaculture, or fish farming, has been both a disruptor and stabilizer in the fish market over the past few decades.
- Example: Advances in aquaculture technology have enabled the mass production of species such as salmon, tilapia, and shrimp, which has increased supply and helped stabilize prices for these species. However, the rapid growth of aquaculture has also led to market disruptions, especially when diseases or environmental challenges strike fish farms. For instance, the outbreak of sea lice in salmon farms in Norway and Chile in the 2010s caused a sharp decline in production, leading to significant price increases for farmed salmon.
Moreover, the environmental impact of aquaculture, including issues like water pollution and habitat destruction, has led to tighter regulations and increased scrutiny from consumers. This has influenced demand and prices, particularly for farmed species where sustainability concerns are high.
Where to Find Historical Fish Data
Access to comprehensive and accurate historical fish data is crucial for market participants, including buyers, sellers, traders, and analysts, who need to make informed decisions based on past trends. Historical data helps in understanding price movements, supply and demand dynamics, and the impact of external factors such as environmental changes, regulatory shifts, and economic disruptions. Here are some of the key sources where you can find reliable historical fish data:
1. Commodity Intelligence Platforms
Several commodity intelligence platforms provide extensive historical data on various fish species. These platforms compile data from multiple sources, offering a consolidated view of market trends and historical prices:
- Vesper: Vesper offers detailed historical data on fish prices, including spot prices, export and import prices, and regional variations. The platform also provides insights into production volumes, supply and demand forecasts, and price benchmarks. This data is useful for analyzing long-term trends and making strategic decisions about purchasing and sales.
- Refinitiv Eikon: Refinitiv Eikon provides comprehensive data coverage for commodities, including fish and seafood markets. The platform offers historical price data, market analysis, and news updates, allowing users to track price movements and analyze market trends over time.
- S&P Global Platts: S&P Global Platts offers pricing data and analysis for various commodities, including seafood. The platform provides historical data on fish prices and reports on market dynamics, supply chain disruptions, and regulatory changes affecting the seafood industry.
2. Government and International Agencies
Several government and international agencies provide historical fish data, often freely accessible to the public:
- FAO (Food and Agriculture Organization of the United Nations): The FAO provides comprehensive data on global fish production, trade, and consumption. Their databases, such as FAO’s FishStatJ, offer historical data on fish catches, aquaculture production, and fishery statistics going back decades, making it a valuable resource for global market analysis.
- National Oceanic and Atmospheric Administration (NOAA): NOAA offers a wealth of data on U.S. fishery stocks, including historical price trends, catch volumes, and stock assessments. NOAA’s Fishery Market News provides weekly and monthly reports on fish prices across various U.S. ports, which can be used to analyze historical price trends.
- European Commission’s Directorate-General for Maritime Affairs and Fisheries (DG MARE): This EU agency provides detailed reports and data on the European fish market, including historical data on prices, trade flows, and production levels across member states. Their Market Observatory for Fisheries and Aquaculture Products (EUMOFA) offers a comprehensive database that includes historical pricing information for various fish species.
3. Industry Reports and Market Analysis Firms
Many industry-specific reports and market analysis firms provide historical fish data. These sources often offer more granular data, including detailed market analysis, trend reports, and forecast models:
- Undercurrent News: A leading provider of seafood market news and analysis, Undercurrent News offers historical price data, market reports, and industry insights on a wide range of fish species. Their platform is frequently updated and provides in-depth coverage of key market trends, making it a valuable resource for buyers, sellers, and traders.
- Rabobank and Other Financial Institutions: Financial institutions like Rabobank, which specialize in food and agriculture markets, regularly publish reports on the seafood sector. These reports often include historical price data, trade analysis, and market forecasts that can provide valuable insights into past market behavior and future trends.
4. Commodity Exchanges and Trading Platforms
Commodity exchanges and trading platforms that deal with fish products can also be a source of historical data:
- Tokyo Metropolitan Central Wholesale Market (Tsukiji): This market, often associated with high-value fish species like Bluefin tuna, provides historical auction price data. Such data is useful for analyzing trends in premium fish markets.
- Norwegian Seafood Council: This organization provides data on the export prices of Norwegian seafood, including salmon and other key species. The council’s website features a variety of reports and historical price data, particularly valuable for understanding the European fish market dynamics.
5. Industry Associations and Trade Organizations
Industry associations and trade organizations often collect and disseminate historical data to their members:
- National Fisheries Institute (NFI): In the United States, NFI provides market data and reports on various seafood products, including historical pricing and supply trends.
- International Seafood Sustainability Foundation (ISSF): The ISSF provides data on tuna stocks and fishing efforts, offering insights into historical catch data and price trends, particularly for species under sustainability programs.
Conclusion
Accessing reliable historical fish data is essential for market participants looking to make strategic decisions based on past market behavior. By leveraging the resources available from platforms like Vesper, government agencies, industry reports, commodity exchanges, academic institutions, and trade organizations, stakeholders in the fish market can gain a comprehensive understanding of historical trends and better navigate the complexities of the global seafood industry.
Related Content
Quickly navigate this page
Was this information useful?
Share: