
In the preceding three years before 2023, the Farm-gate milk prices from countries from the Northern Hemisphere have slowly doubled to peaking at approximately €600 per metric tonne or €0.60 per kilogram by the end of 2022, with the intention of incentivizing greater milk production, see Figure 1.
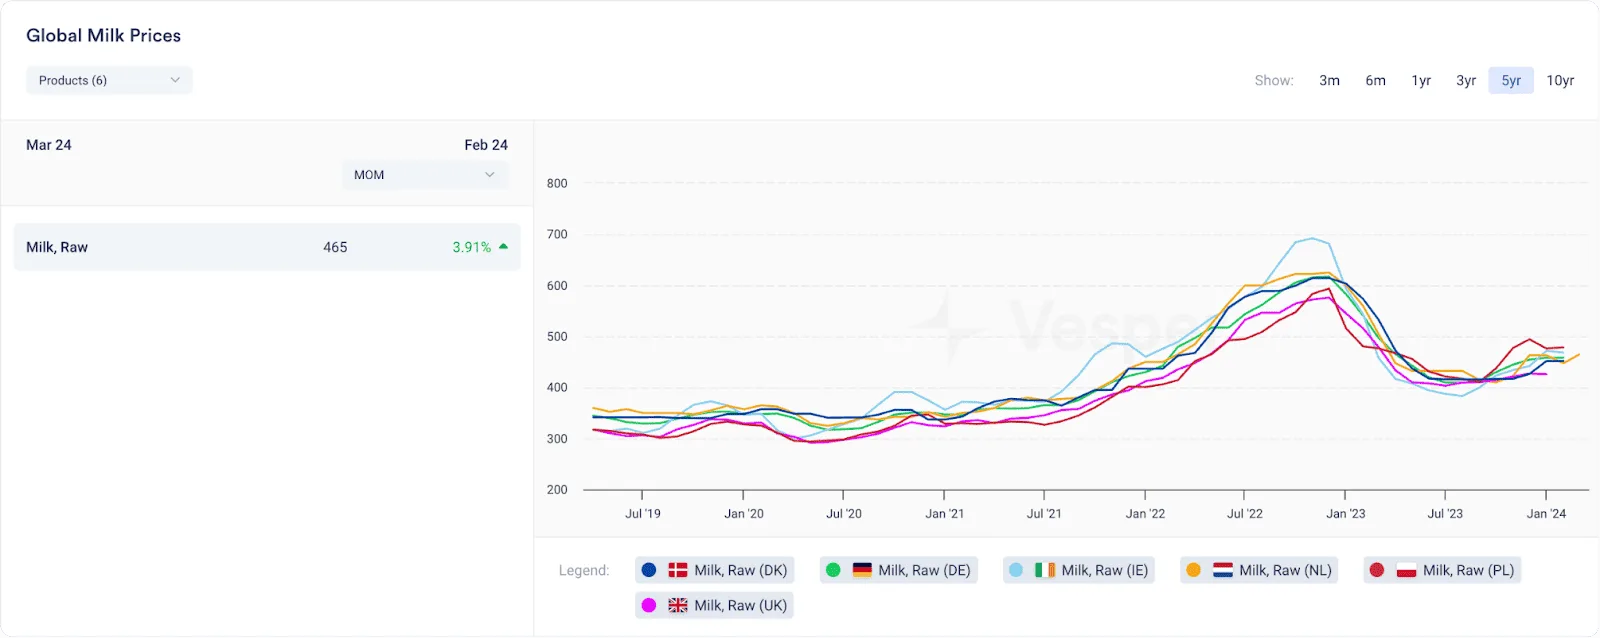
Figure 1: Milk Prices for Northern European countries in EUR/mt
This stimulus yielded healthy milk production during the first half of 2023, culminating in a robust milk flush totalling 14,808,507 metric tonnes in May—a modest 1.11% increase compared to 2022 in Europe. As the year progressed, the reduction in farm-gate milk prices diminished the appeal for farmers to further increase production. Despite maintaining healthy figures in the latter half of the year, the gap between milk production in 2023 and 2022 began to narrow.
A pertinent example is observed in France, where weekly updated data indicates a dip below the previous year’s numbers by mid-August, marking a shift into negative year-on-year comparisons, see Figure 2.
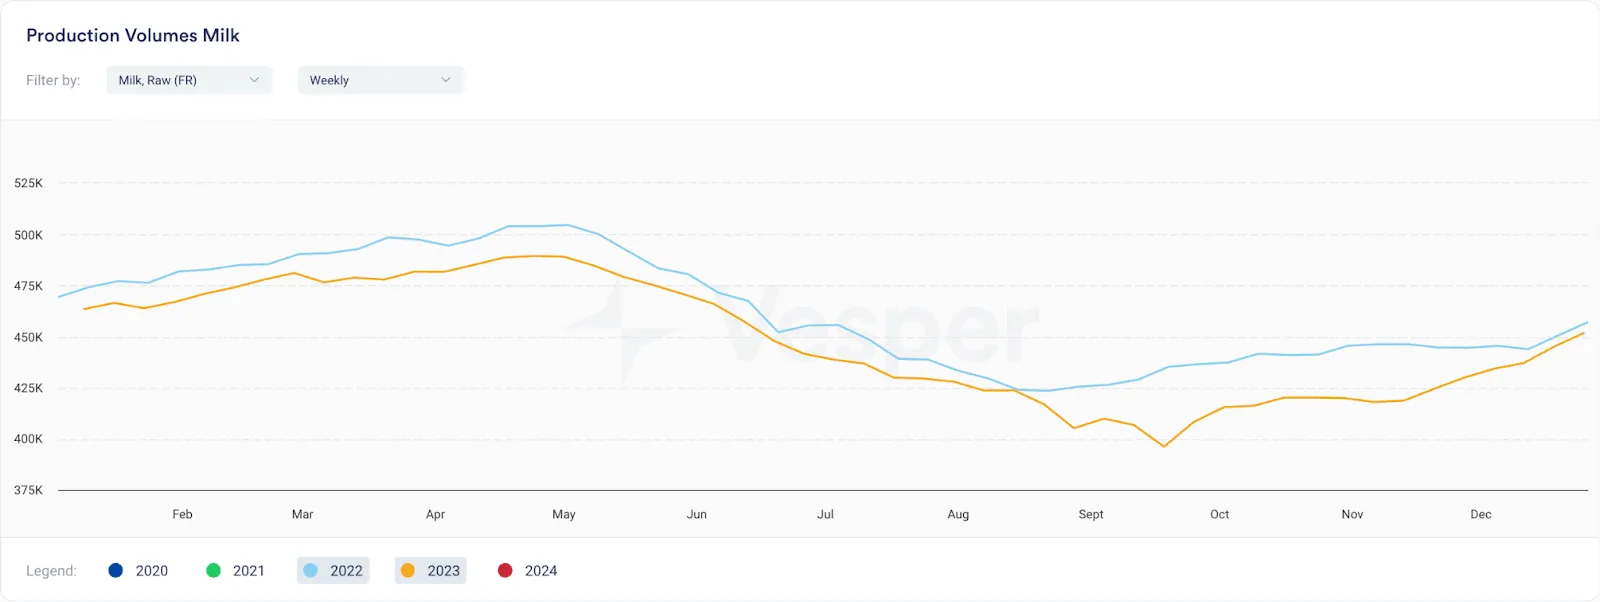
Figure 2: Weekly Milk Production Volumes for France
In the Southern Hemisphere, throughout spring and autumn, most regions experienced a slight rise in temperatures. This led to intense heatwaves in some Southern European nations and California, adversely affecting dairy cows. Consequently, there was a significant reduction in milk production.
In the United States, the impact of heat stress on milk production is evident when comparing the West and Midwest regions. In 2023, the Western region saw a 1.63% decline in milk production, totalling 38,688,505 metric tonnes, while the Midwest experienced a 1.74% increase, with production reaching 36,814,725 metric tonnes compared to the previous year, as illustrated in Figure 3.
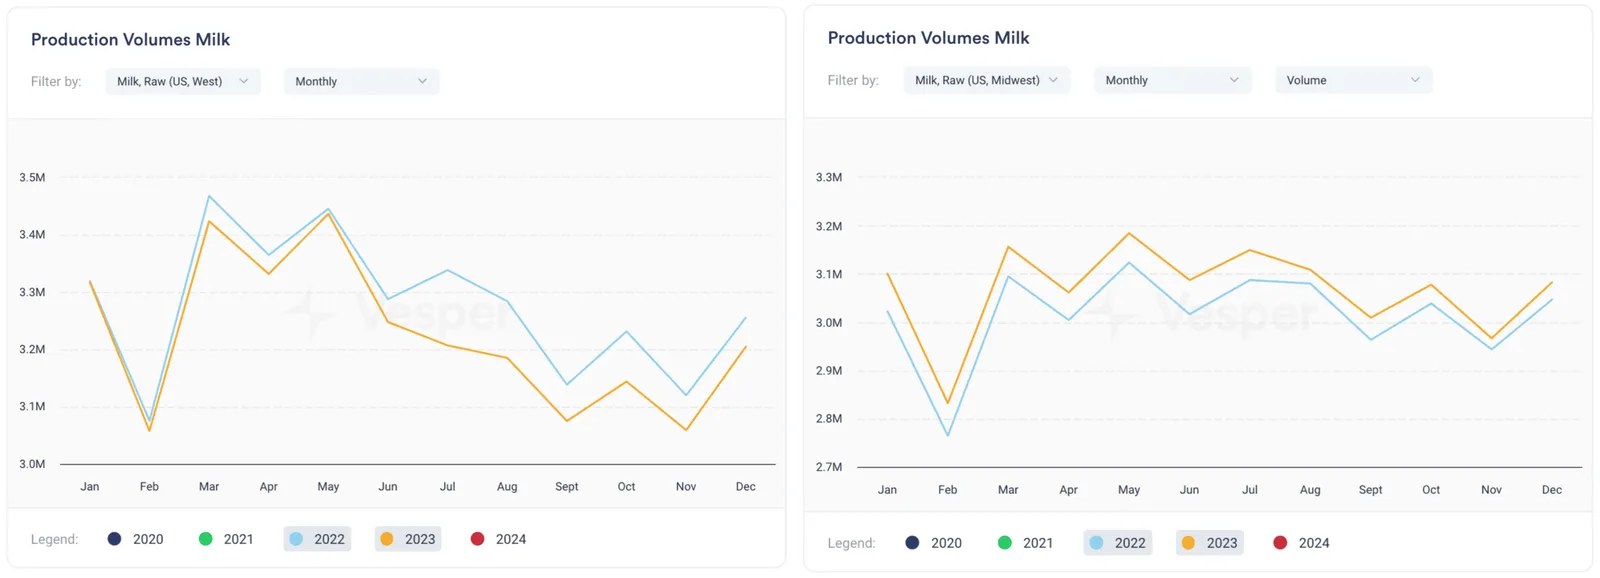
Figure 3: monthly milk production of the US West and Midwest in MT
In addition to heat stress, the United States experienced a significant challenge in the second half of 2023 as margins were affected by higher-than-average dairy cattle feed costs, leading to reduced profits from milk sales. The combination of low milk margins and elevated beef prices resulted farmers in slaughtering more cows fore beef than keeping them for milk production.
On the other side of the globe, In New Zealand, farmer margins take a back seat to the critical factor of pasture growth, given that the country’s cows primarily rely on grass as their main source of feed. The 30-day rolling average has consistently been favourable throughout the year, particularly at the beginning and end of the year, significantly surpassing the 5- year average, as illustrated in Figure 4.
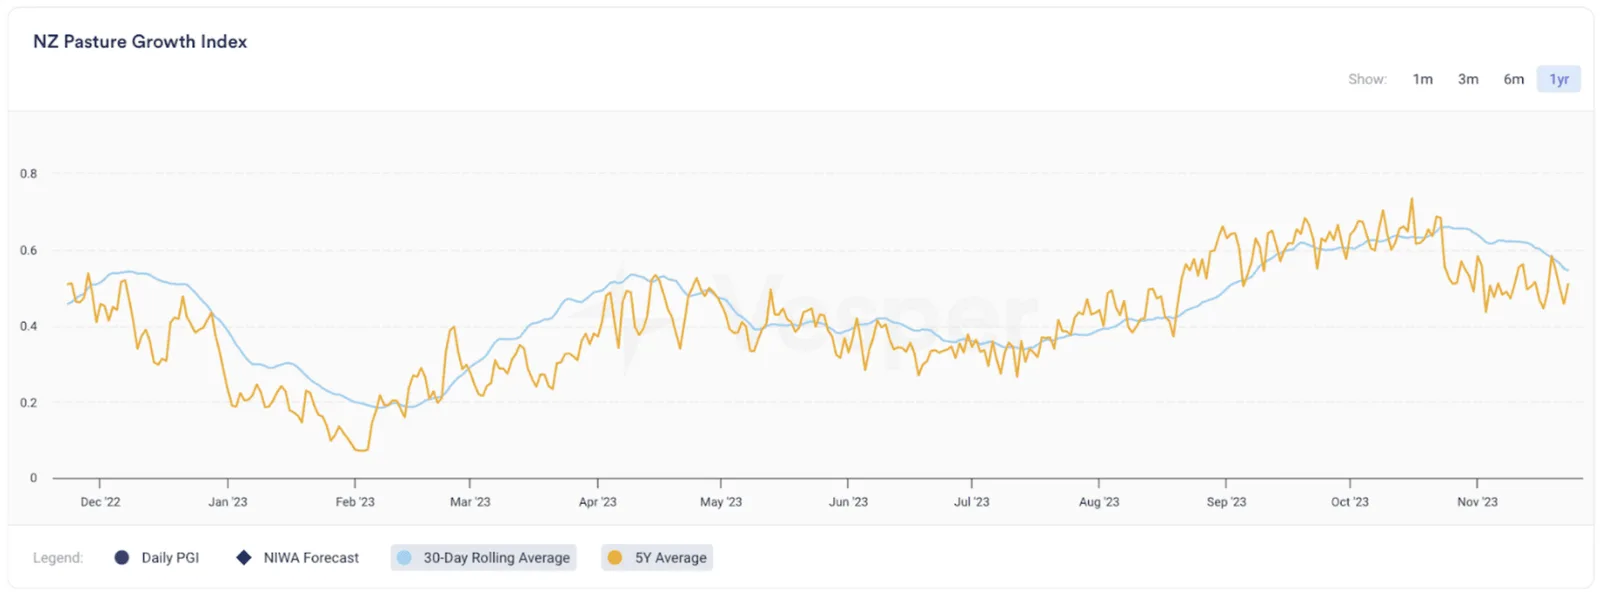
Figure 4: NZ Pasture Growth Index
This favourable pasture growth has resulted in New Zealand’s milk production remaining on par with last year, experiencing a slight increase of 0.93% year-to-date compared to the previous year, see Figure 5.
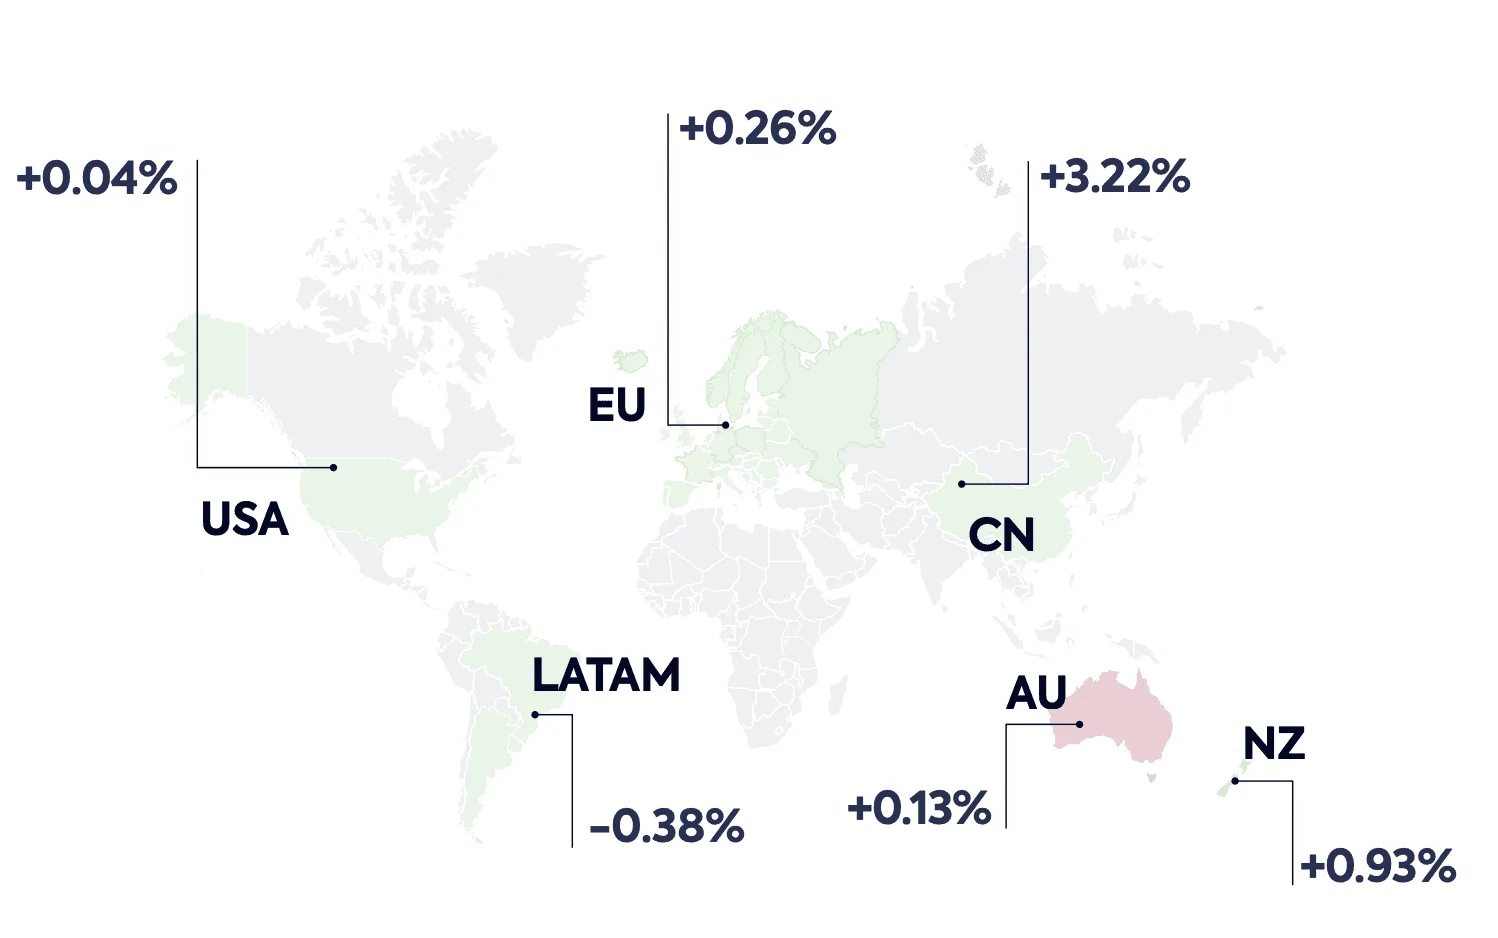
Figure 5: Global milk supply - 2023 YTD YOY
In the first half of 2023 and slightly less so up until the beginning of Q3, the dairy market experienced a surplus of dairy products. This was due to an overabundance of milk and its derivatives, leading to a generally bearish sentiment throughout the dairy market. Together with increasing commodity prices and global inflation dampening consumption rates across nations, this resulted in a notable decline in prices for all commodities across regions, see Figure 6.
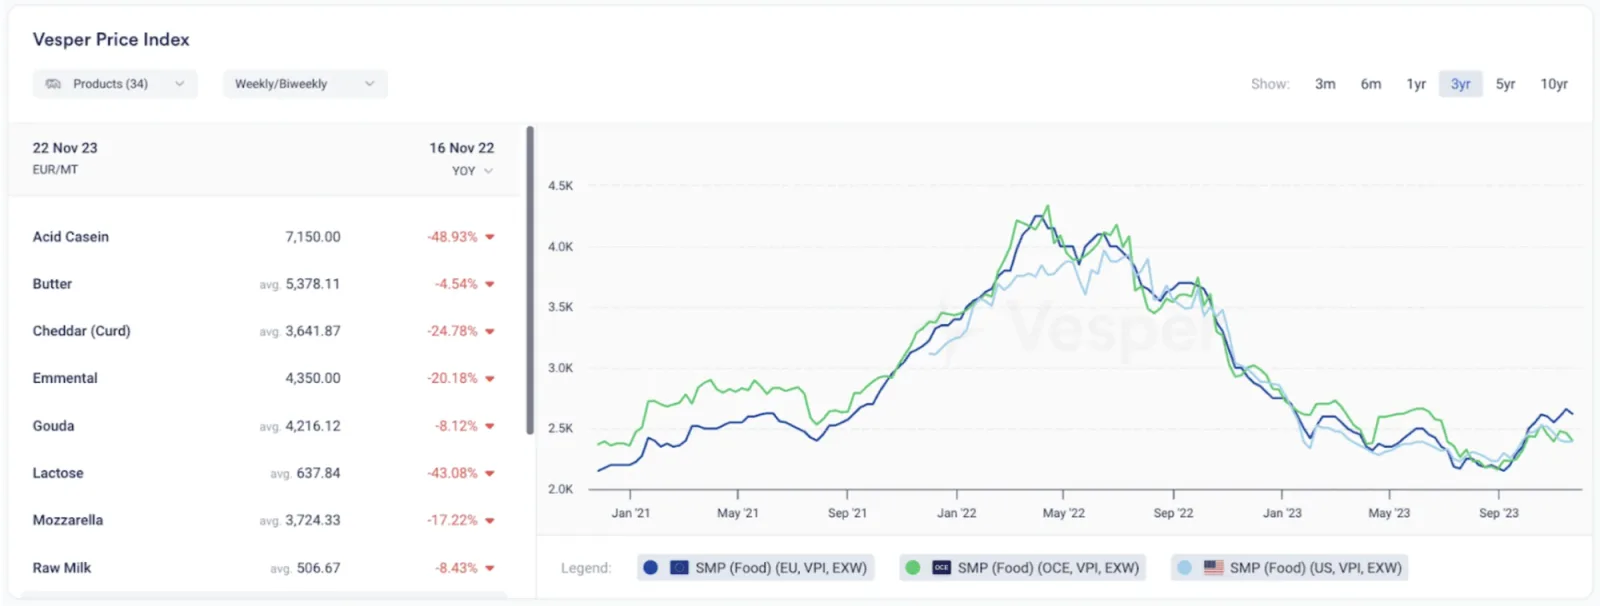
Figure 6: YOY decrease in dairy commodity prices measured on 22nd November 2023
As we enter 2024, global dairy markets are displaying a more nuanced picture, departing from the predominant buyer’s market seen in 2023. In the last months of 2023, we witnessed a weakening of supply, bringing supply and demand into closer alignment, albeit at a reduced level.
On a global scale, markets have stabilized, finding a bottom, thanks to heightened export demand from regions such as Asia, the Middle East, and Northern Africa. This suggests enough support for dairy prices throughout the entirety of 2024.
The global dairy market has recently observed a remarkable trend: the European butter market is experiencing the largest price fluctuations in its recent history. In February, prices ranged from €5100/mt at the start of the month to around €6000/mt at the end of the month, see Figure 7. Even though this is already an incredible 17.7% increase, it does not do justice to the enormous volatility we have seen daily throughout the month.
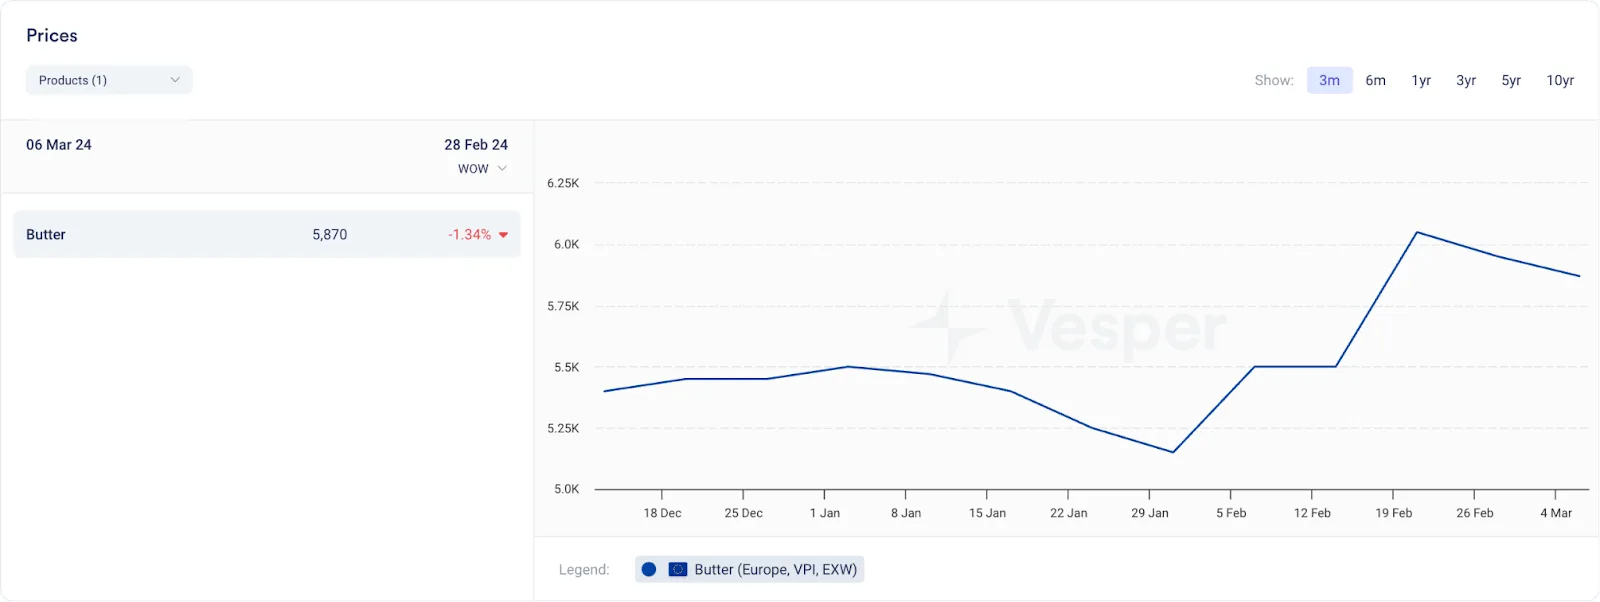
Figure 7: European Butter prices according to the VPI in EUR/mt
The rebound that we have seen in EU prices mainly originated from bids and offers coming from traders. Many believe however that the increasing milk intake towards the peak months will lead to higher butter production.
While people in the butter market are still a bit nervous, most other markets feel weaker and show a much clearer sentiment.
Global SMP markets ft instance seemed unaffected by the bullish butter market movement, driven by lower demand from domestic as well as export markets. Since European production has not been good last year, stock levels in Europe are low Weaker global demand, however, seems to be the main driver for a weaker EU SMP market. Now that SMC prices are much lower than the prices for SMP, we could see some additional production in the coming months.
The Oceanian market is slightly higher in price than the EU and the US, but is also weakening due to the lack of consistent demand for their SMP, see Figure 8. Even though US SMP/NFDM production and stocks have been at very low levels for several months, prices have remained trading sideways for almost a year now. The sideways movement can be explained by -3.37% lower US exports in 2023, as global demand (and Mexican demand in particular) remains subdued.
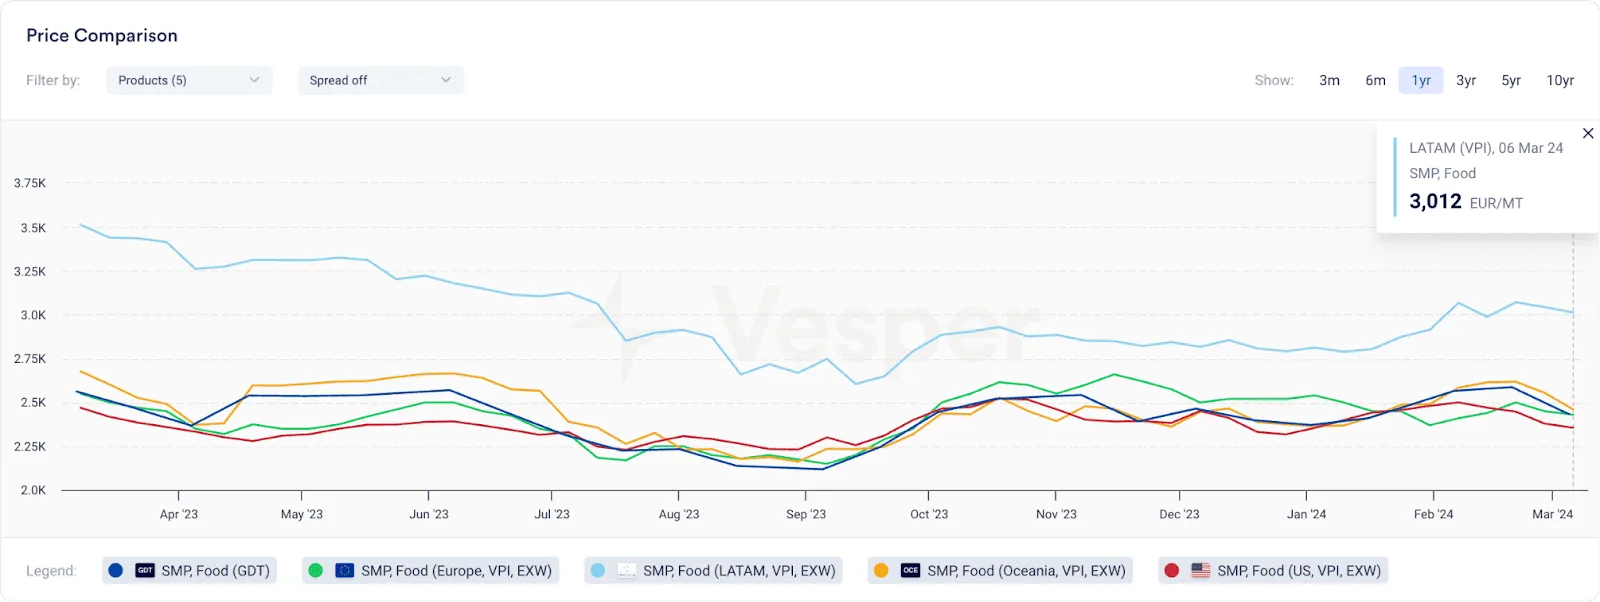
Figure 8: A price comparison between SMP prices for Oceania Europe, LATAM and US (EUR/mt)
Not much is happening in the European market for WMP, causing European prices to continue following the price equivalent of butter and SMP. As butter prices jumped a lot over the past weeks, European WMP prices have climbed despite SMP prices lowering at the moment.
Oceanian WMP prices have been lowering again as demand has been much lower again since the GDT event in early February. The global outlook for WMP remains slightly weaker, especially now that demand is slowing down. Since prices are not that high in New Zealand, it seems likely that they will not decrease that much. In Europe, we will likely keep following the weaker SMP market and the volatile market for butter.
Market activity for cheeses is subdued again, as the uncertainty in the global dairy market has resulted in a more cautious approach from cheese buyers across the globe. As we are at the start of the peak in milk production in Europe and the United States, in which stock levels usually grown seasonally, many believe that the upward price potential is limited. Backed by the belief that price will likely not go up, most buyers return to month-to-month purchasing, while some are okay with today’s cheese prices.
Looking for a long-term perspective on the global dairy market trends? Download our Global Dairy Market Outlook 2024.