

Access to reliable historical chemicals data provides invaluable insights into pricing fluctuations, market trends, and economic drivers. For professionals in the chemicals industry, this data is not just a tool, it’s a strategic asset. In this article, we delve into the importance of historical chemicals data, explore key price shifts over the past decade, and explain how platforms like Vesper can empower you with actionable intelligence.
Why is Historical Chemicals Data Important?
- Market Forecasting: Understanding past trends helps in forecasting future market behaviour. Historical data can reveal patterns and cyclic behaviours in chemical prices, assisting businesses in anticipating market movements.
- Risk Management: With accurate historical pricing data, companies can manage risks more effectively by understanding potential price volatilities. This is especially important for budgeting and financial planning.
- Competitive Advantage: Companies with access to historical price data can better negotiate contracts and establish stronger supplier relationships. They can also optimise their inventory management by predicting price dips and spikes.
- Strategic Planning: Historical data aids in strategic decision-making, such as identifying the best time to enter or exit a market, adjust pricing strategies, or allocate resources.
Key Historical Price Shifts in the Chemicals Market
Over the past decade, several key chemicals have experienced notable price shifts due to a variety of market forces, including supply chain disruptions, geopolitical events, and changes in demand. Here’s a closer look at some of these changes:
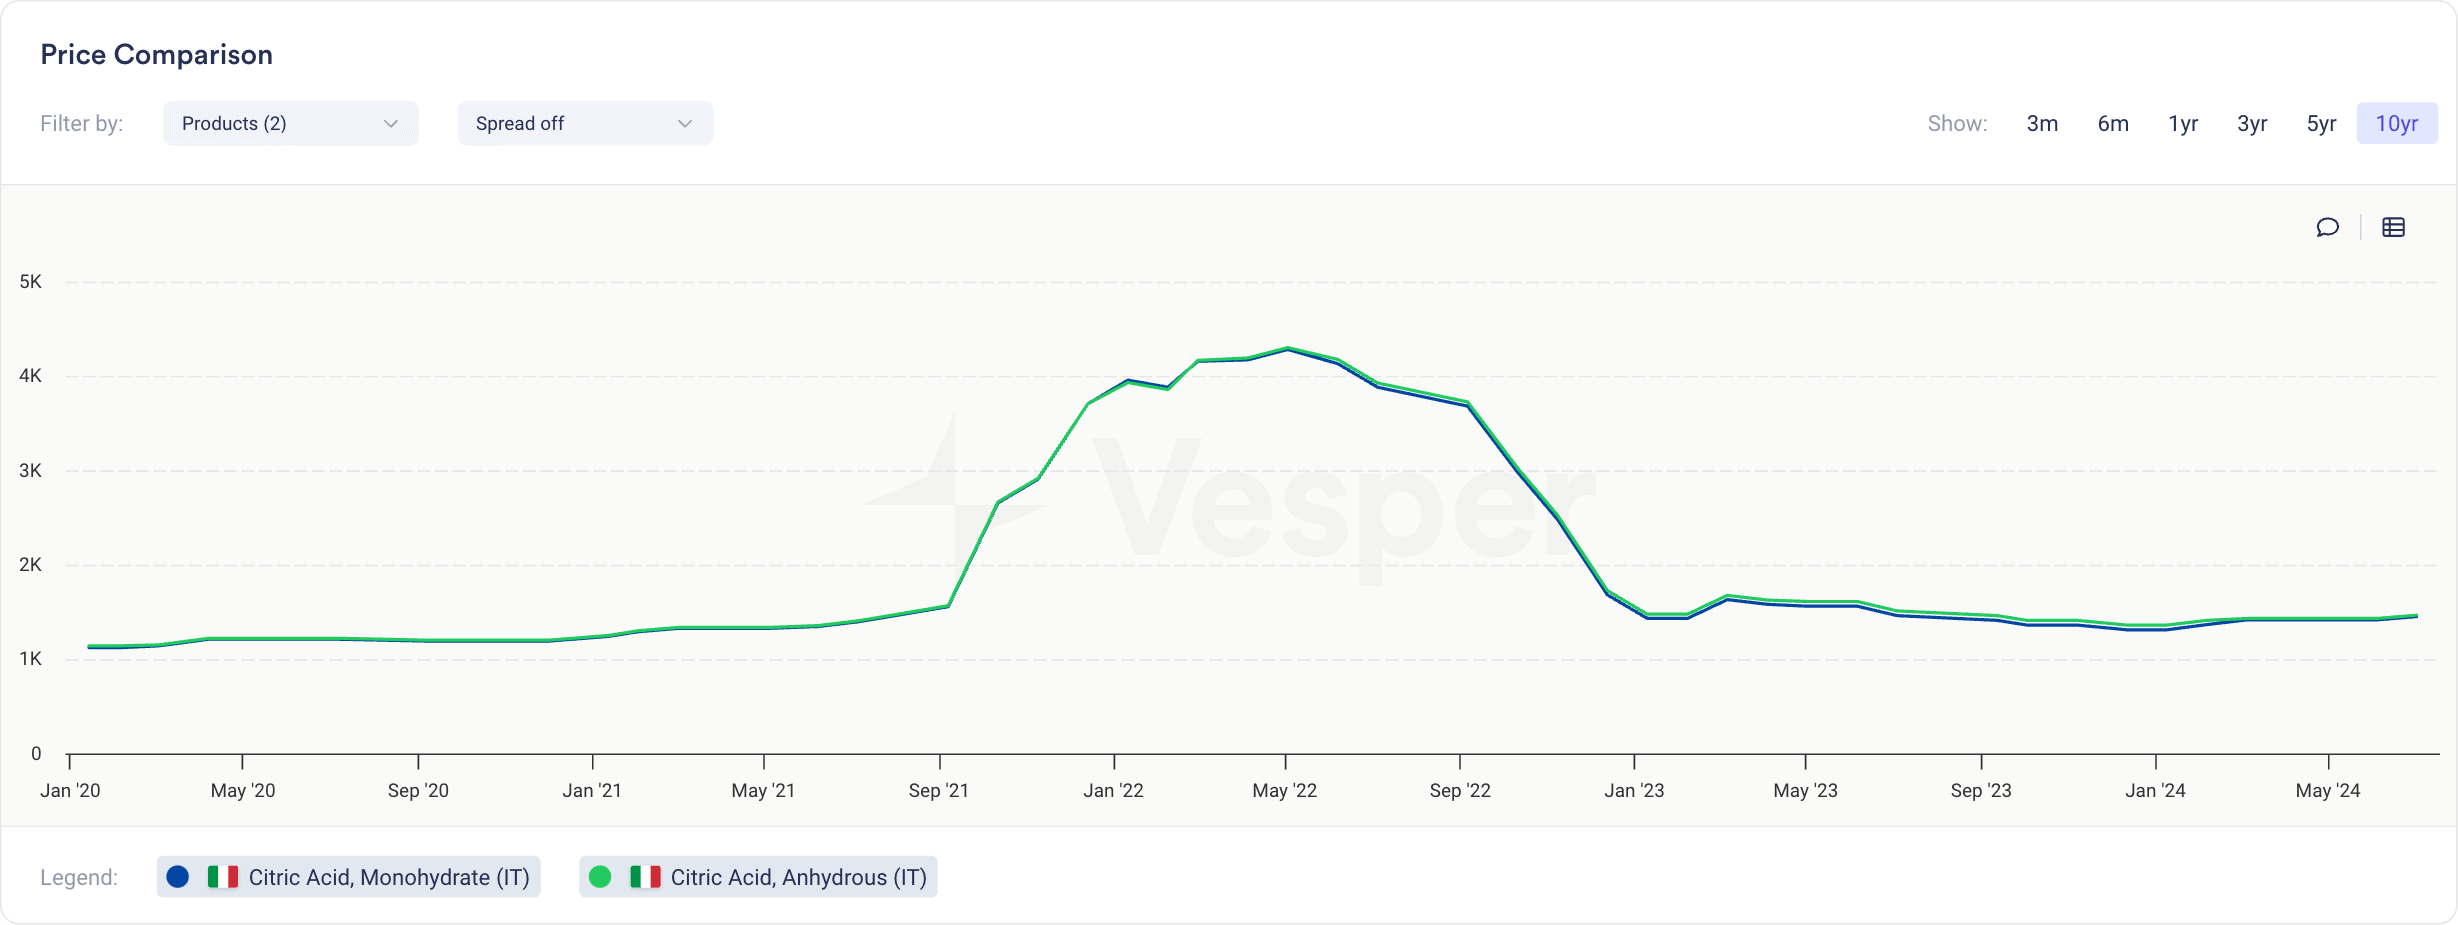
- Citric Acid (Anhydrous and Monohydrate): Citric acid prices have shown significant volatility over the past five years. The price increase for Citric Acid (Anhydrous and Monohydrate) from 2021 to 2022, as shown in Vesper’s data, was driven by several factors: post-pandemic recovery leading to heightened demand, supply chain disruptions, increased raw material and energy costs, inflationary pressures, and rising demand in pharmaceuticals and personal care products. These elements created a supply-demand imbalance, causing prices to surge during this period. The market stabilised as supply chains adapted, production rose, and demand levels normalised.
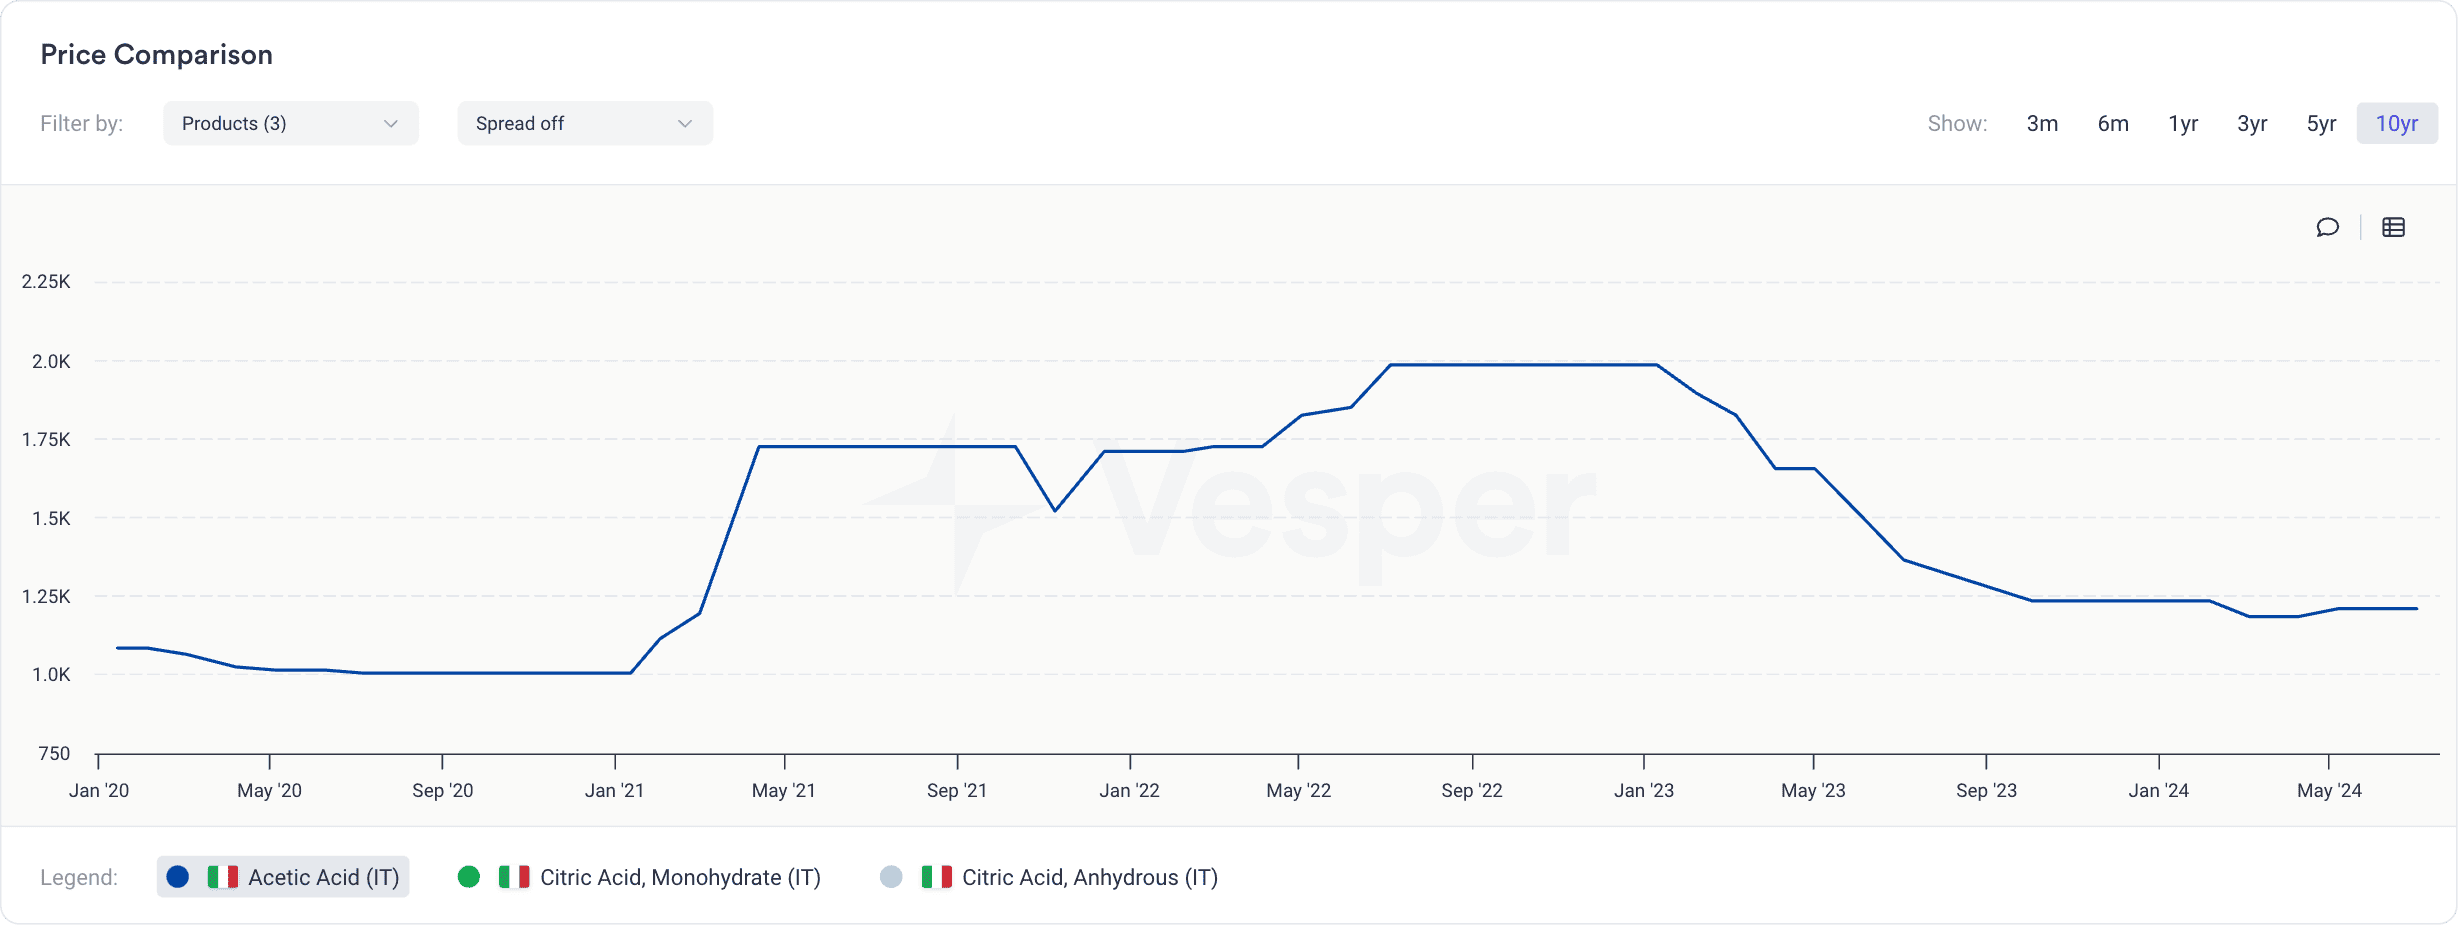
- Acetic Acid: The price trend for Acetic Acid from 2021 to 2022 shows a significant rise, driven by supply chain disruptions, plant shutdowns, and increased demand for acetic acid derivatives in textiles and solvents. The petrochemical supply chain, closely linked to acetic acid, faced volatility due to rising crude oil prices and production constraints. This surge stabilised slightly in late 2022 as supply issues eased and demand pressures reduced.
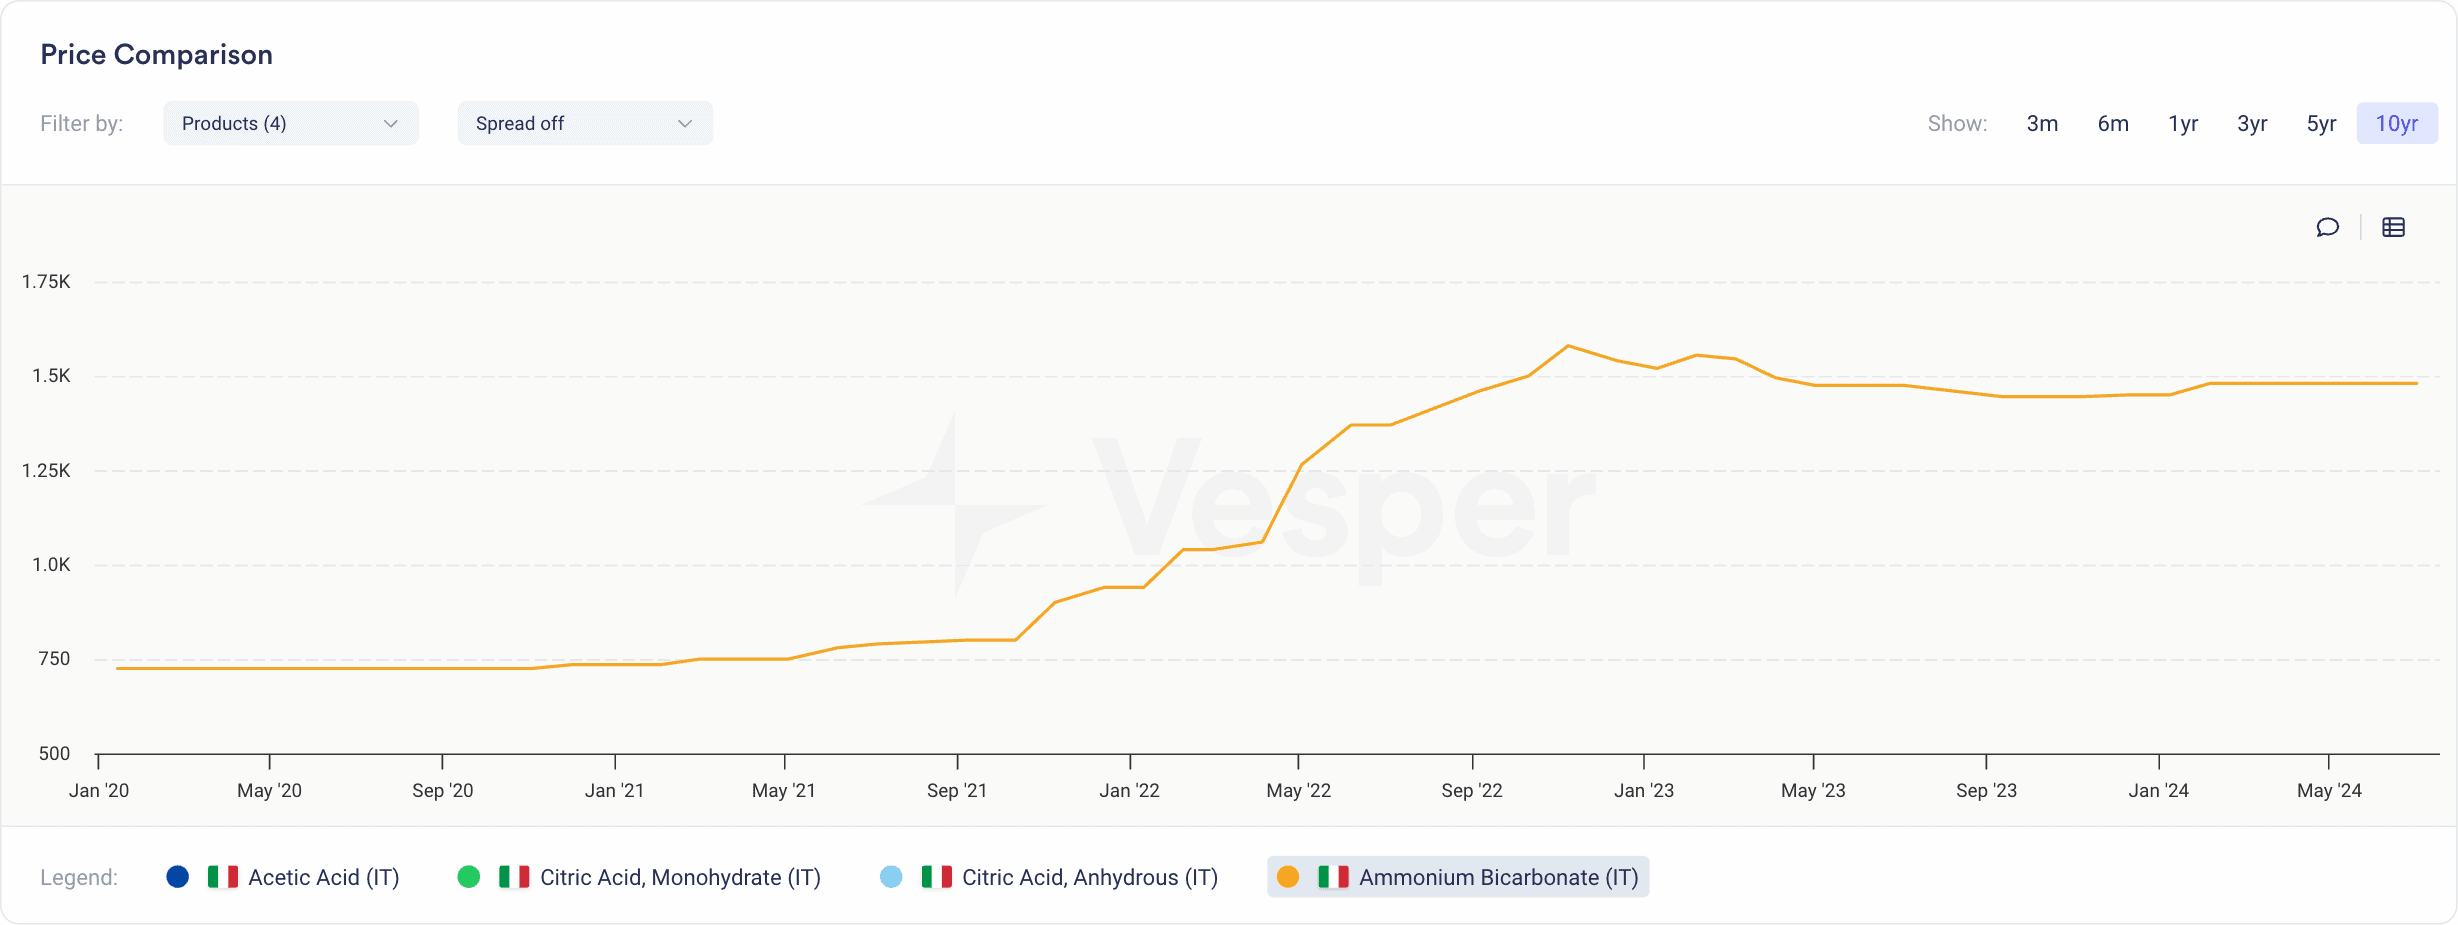
- Ammonium Bicarbonate: Prices for Ammonium Bicarbonate remained relatively stable until September 2021. This stability was due to balanced supply and demand dynamics. However, from late 2021 onwards, there was a noticeable upward trend in prices, driven by tighter environmental regulations in key producing regions like China, which restricted output, and strong demand from the agriculture and food sectors. This shift towards a more constrained supply environment coupled with steady demand led to increased market prices.
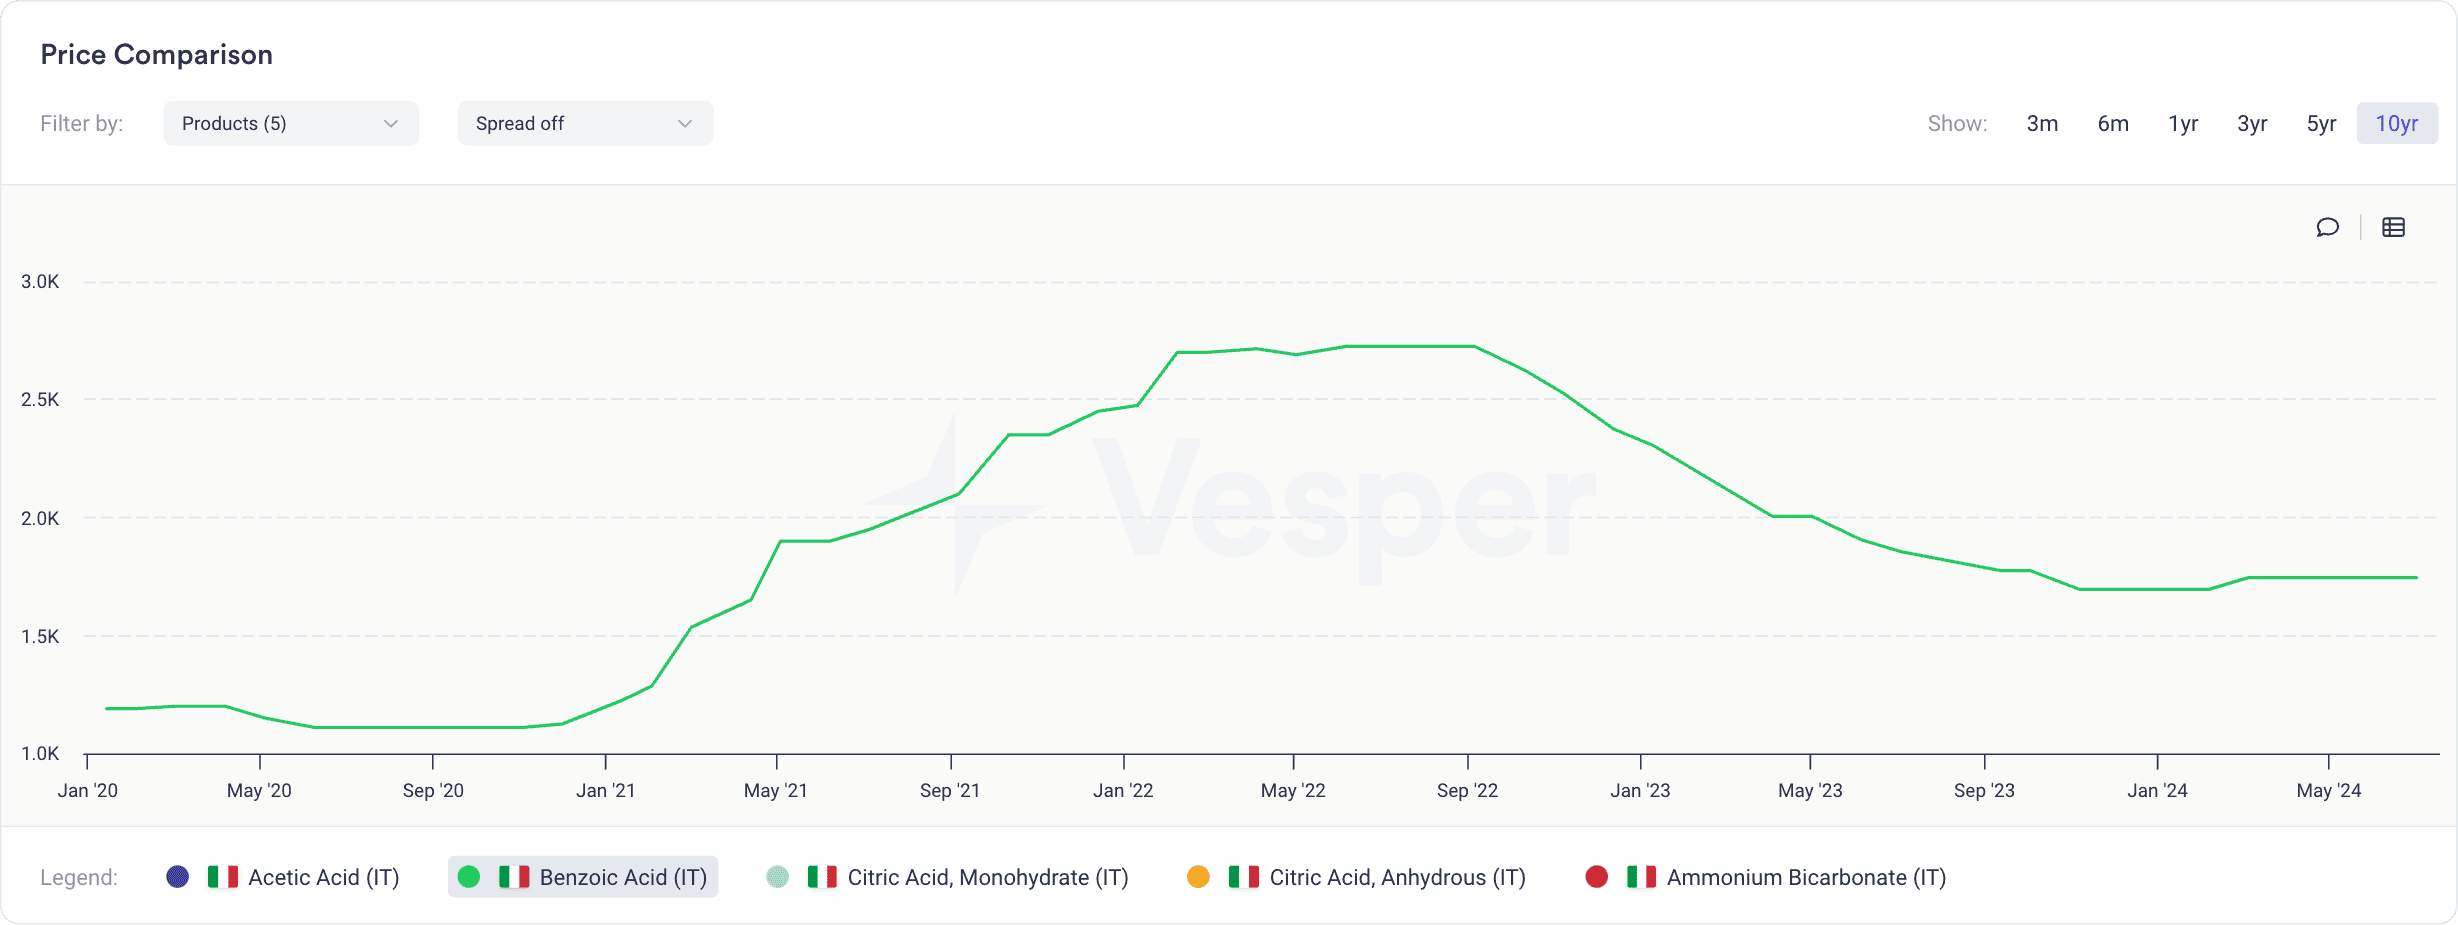
- Benzoic Acid: Benzoic Acid prices remained stable until mid-2021, after which a sharp increase occurred, peaking in early 2022. This rise was driven by increased demand for safer preservatives in food and beverage industries, supply chain disruptions, and stricter environmental regulations in major production regions, such as China. The subsequent decline from 2022 to 2023 reflects market rebalancing as supply constraints eased and demand normalised.
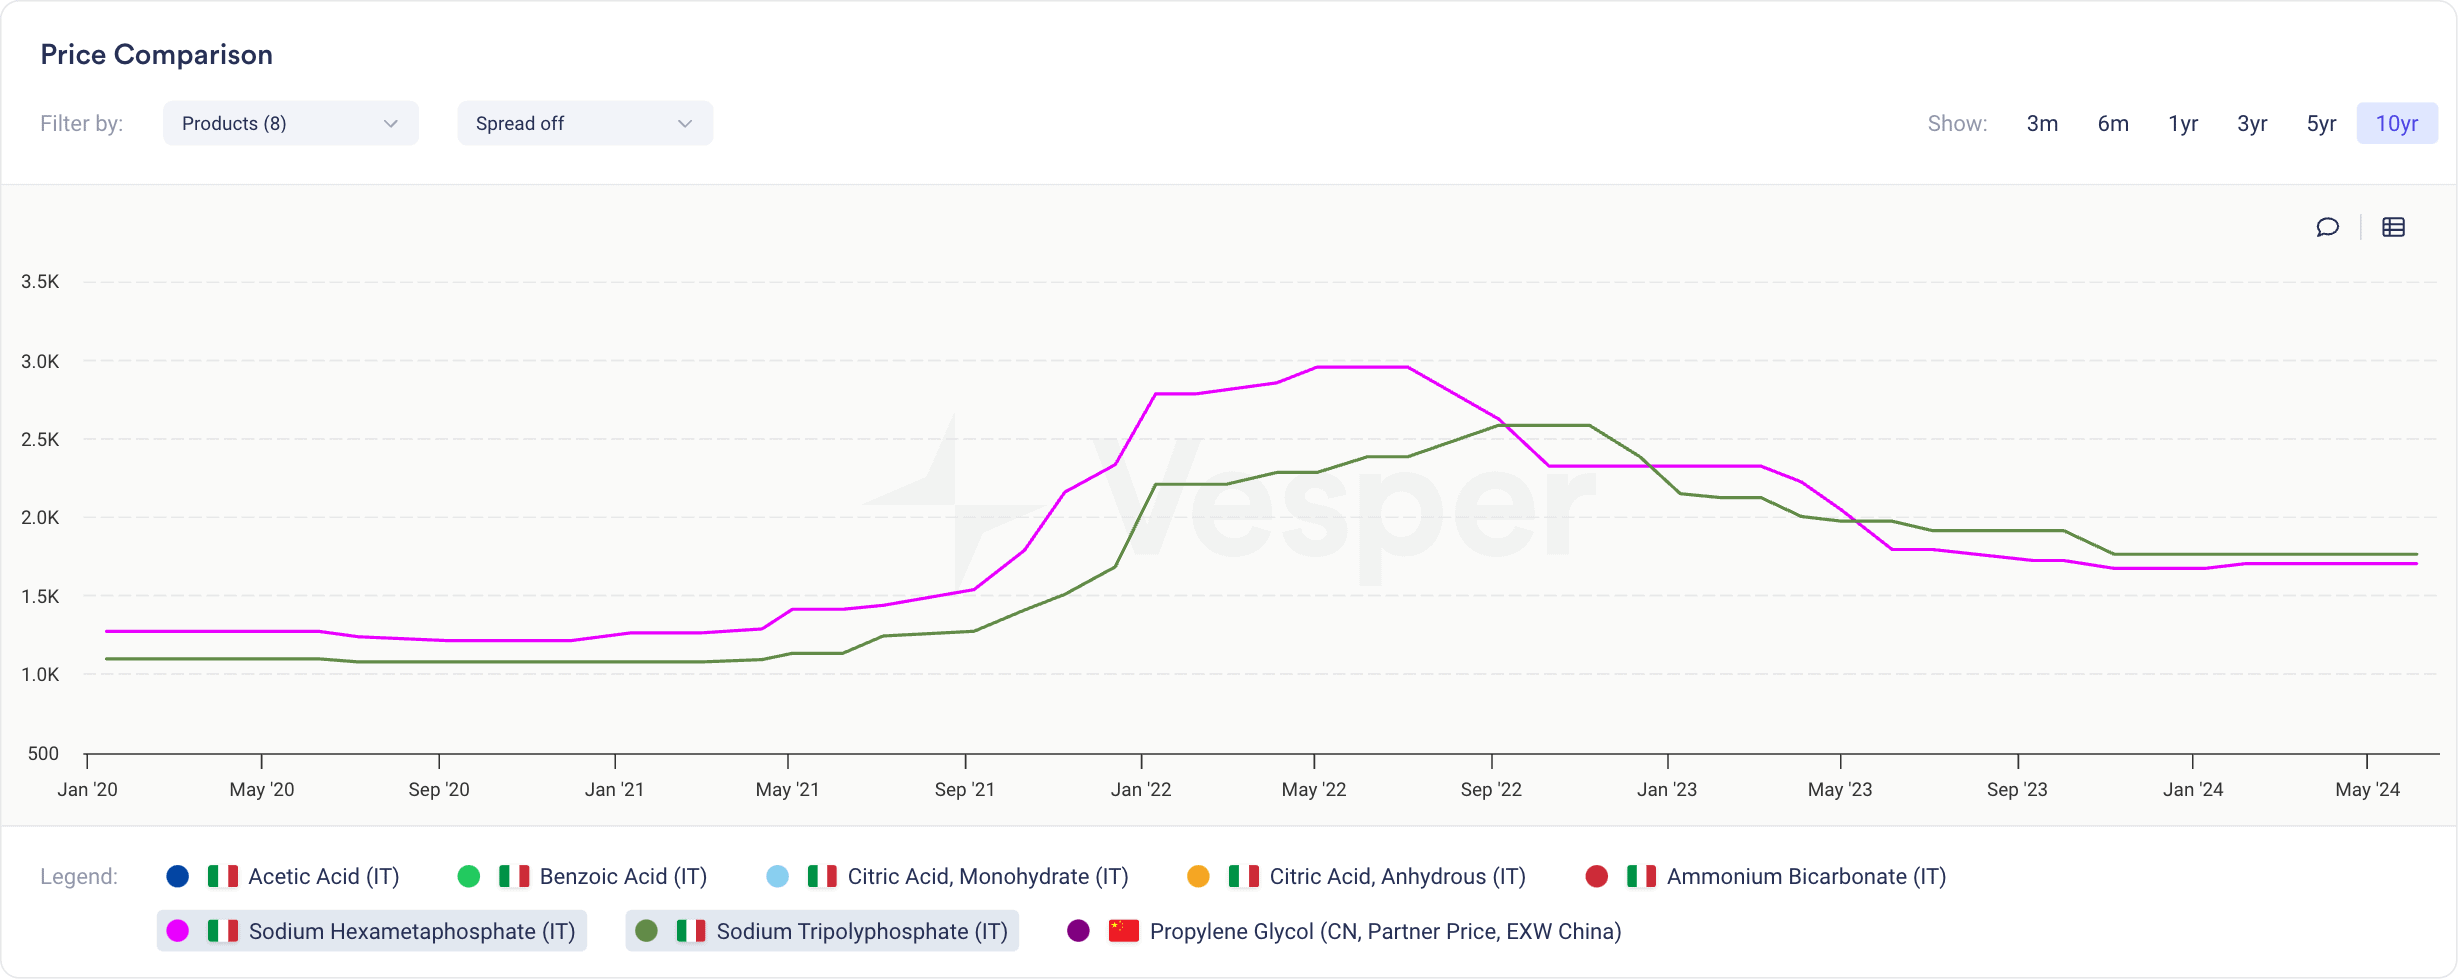
- Sodium Hexametaphosphate and Sodium Tripolyphosphate: Prices for these chemicals rose sharply from early 2021 to mid-2022, driven by strong industrial demand, especially in water treatment and detergents, and stricter environmental policies limiting production in key regions. Supply chain disruptions and rising raw material costs further exacerbated price increases. After mid-2022, prices declined as supply conditions improved and demand stabilised.
What Are the Key Sources of Historical Chemicals Data?
Historical chemicals data can be sourced from various platforms and institutions, providing businesses with the insights needed to make informed decisions:
- Market Intelligence and Financial Data Platforms: Platforms like Vesper, ICIS, Argus Media, Bloomberg, Reuters, and S&P Global Platts offer comprehensive datasets, including spot prices, historical pricing, price forecasts, forward prices, and detailed market analysis. These platforms use advanced analytics and algorithms to provide accurate, up-to-date information on the chemical industry. They also offer market news and insights, helping businesses track broader economic and market trends, anticipate price movements, and make informed decisions.
- Government Databases: Many government agencies, such as the U.S. Energy Information Administration (EIA) and the European Chemical Industry Council (CEFIC), offer public access to data on chemical production, imports, exports, and pricing trends.
- Trade Associations: Organisations like the American Chemistry Council (ACC) and the International Council of Chemical Associations (ICCA) publish regular reports and statistics that include historical data on various chemical products.
- Commodity Exchanges: Exchanges such as the Chicago Board of Trade (CBOT) and the London Metal Exchange (LME) provide historical price data for various chemical commodities, especially those traded in bulk.
- Academic and Research Institutions: Universities and research organisations, including MIT’s Energy Initiative, the University of Oxford’s Smith School of Enterprise and the Environment, Stanford’s Precourt Institute for Energy, and Carnegie Mellon University’s Center for Environmental Research and Education, publish studies with historical data on chemicals. Other notable institutions include the Fraunhofer ISI, TNO, the European Commission’s Joint Research Centre (JRC), the National Renewable Energy Laboratory (NREL), UC Berkeley’s Center for Green Chemistry, Imperial College London’s Centre for Environmental Policy, and the International Institute for Applied Systems Analysis (IIASA). These reports focus on environmental impacts, production processes, and economic trends.
- Consulting Firms: Firms specialising in the chemical industry, such as McKinsey & Company, BCG, and Bain & Company, often produce reports and data-driven insights that include historical analysis as part of their advisory services.
By leveraging these diverse sources, businesses can gain a more comprehensive view of historical chemicals data, enabling them to make strategic decisions and stay competitive in a dynamic market.
Frequently asked questions
How does historical chemicals pricing data help procurement teams plan ahead?
Past pricing reveals patterns and cyclical behaviour in chemical markets, so you can anticipate likely movements rather than react to them. Teams use it to manage risk by understanding how volatile a given input has been, to budget with more confidence, and to time purchases or contract renewals. Explore historical chemicals price data to ground these decisions in evidence.
Which chemicals tend to show the most price volatility, and why?
The article highlights citric acid, acetic acid, ammonium bicarbonate, benzoic acid, and sodium phosphates as inputs that saw notable swings. Common drivers include supply chain disruptions, plant shutdowns, tighter environmental regulation in major producing regions, rising raw material and energy costs, and shifts in demand from sectors like food, pharmaceuticals, and water treatment.
Where can I source reliable historical data for chemical commodities?
The article points to market intelligence platforms, government databases such as the EIA and CEFIC, trade associations like the ACC and ICCA, commodity exchanges, academic research institutions, and consulting firms. Cross-referencing several sources gives a fuller, more defensible view. Vesper consolidates spot, historical, forecast, and forward pricing alongside long-run historical price series.
How does historical price data strengthen supplier negotiations?
Knowing how a chemical has actually moved over time lets you challenge quotes that drift from market reality and benchmark a supplier's offer against documented trends. It also helps you spot likely dips and spikes, so you can time orders and structure contracts to your advantage rather than negotiating blind. That evidence base supports stronger, more durable supplier relationships.