What Are the Key Components of Sugar Supply and Demand Data?
Sugar supply and demand data is critical for understanding the balance between how much sugar is available on the market and how much is required by consumers and industries. This data covers essential metrics such as production volumes, stock levels, export and import figures, and consumption trends across different regions and product categories.
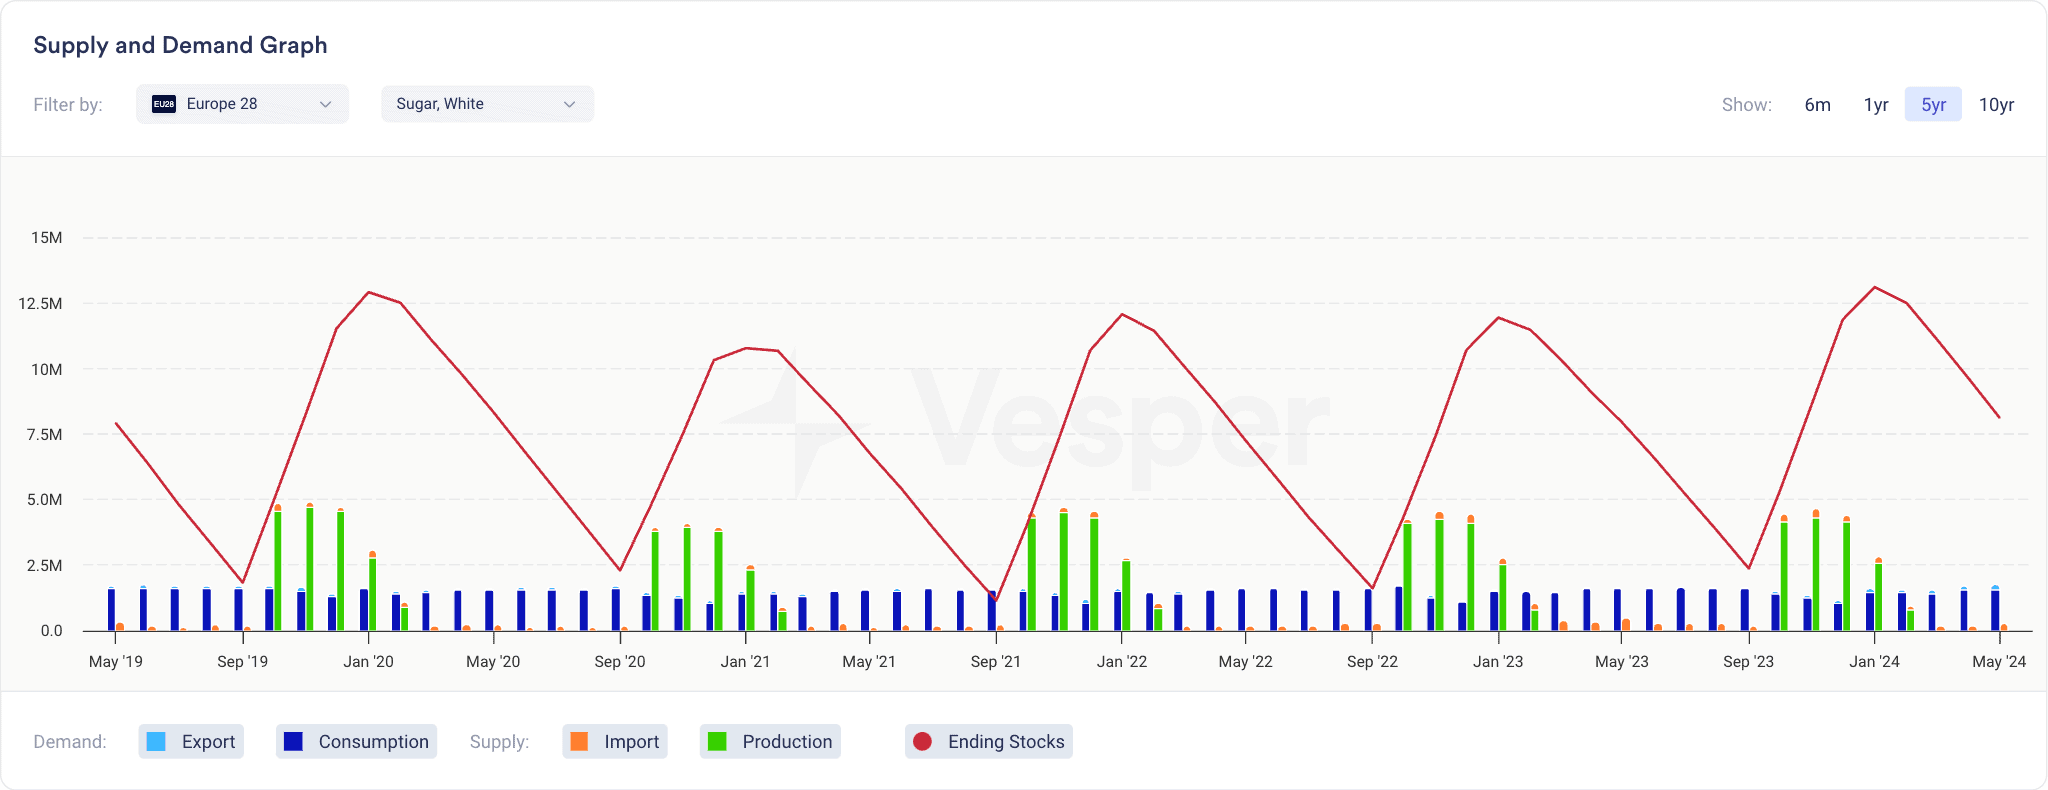
The graph below is a clear representation of how sugar supply and demand data is visualized on Vesper, using the European Union’s white sugar data from the past five years as an example.
Supply
Production
The green bars on the graph represent the total production output of sugar each month. Tracking these production levels is key to assessing the capacity of European producers to meet both domestic and international demand. As observed in the graph, production generally spikes from October to January each year, reflecting the sugar beet harvesting season in Europe. This seasonal surge is followed by a decline as production winds down in February.
Import
The small orange segments at the top of the bars indicate the volume of sugar imported into Europe. Import data is vital for understanding the role of external supply sources in the European market, especially when domestic production does not meet demand. The graph shows that imports are relatively minor, suggesting that Europe is largely self-sufficient in sugar production with minimal reliance on external sources.
Demand
Consumption
The blue bars represent the total quantity of sugar consumed within Europe each month. Consumption patterns appear stable throughout the year, with only slight fluctuations. This consistency in consumption underscores the ongoing demand for sugar in various sectors, including food production and industrial uses.
Export
The light blue sections within the blue bars show the volume of sugar exported from Europe to international markets. These export figures are crucial for understanding global demand and Europe’s role in balancing local production with international consumption needs. The graph indicates that exports are a consistent element of the European sugar market, although the volume remains relatively stable.
Ending Stocks
Ending Stocks
The red line on the graph represents the ending stocks of sugar at the close of each month. This line is critical for assessing market balance—whether supply is exceeding demand or vice versa. In the graph, ending stocks typically increase from October to January, aligning with the peak production season. However, as production tapers off from February onwards, stocks gradually decrease. The September ending stocks are particularly significant, serving as a benchmark to gauge the overall tightness or surplus in the market. A decline in September stocks suggests a tighter market, potentially leading to price increases, whereas higher stocks indicate a surplus that could exert downward pressure on prices.
How Does Sugar Supply Affect Global Prices?
Sugar supply plays a crucial role in determining global prices, as fluctuations in production, exports, and stock levels can lead to significant price shifts in the global market. The sugar market is highly sensitive to supply-side factors, which can either create a surplus or a deficit, influencing prices accordingly.
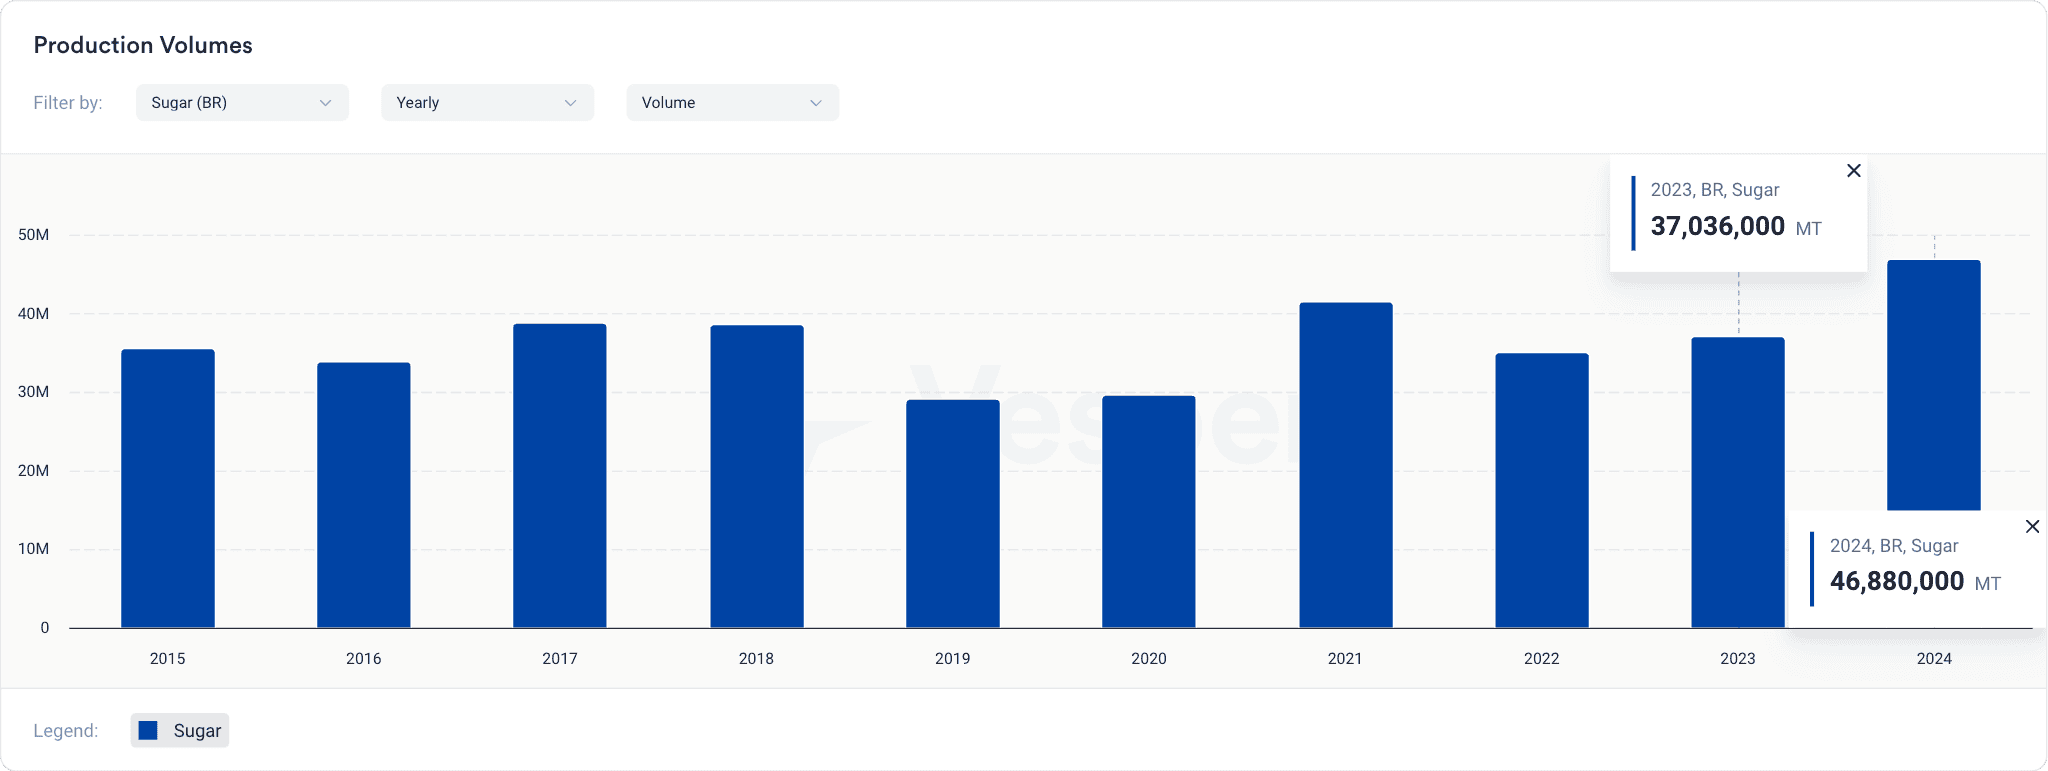
Consider the impact of Brazil’s sugar production, a significant player in the global sugar market. For the 2024/2025 campaign, Brazil’s sugar production is estimated to reach 46.88 million metric tonnes, an impressive increase of nearly 27% compared to the previous season. This substantial surge in production has already started to exert downward pressure on global sugar prices, as shown in the attached price graph.
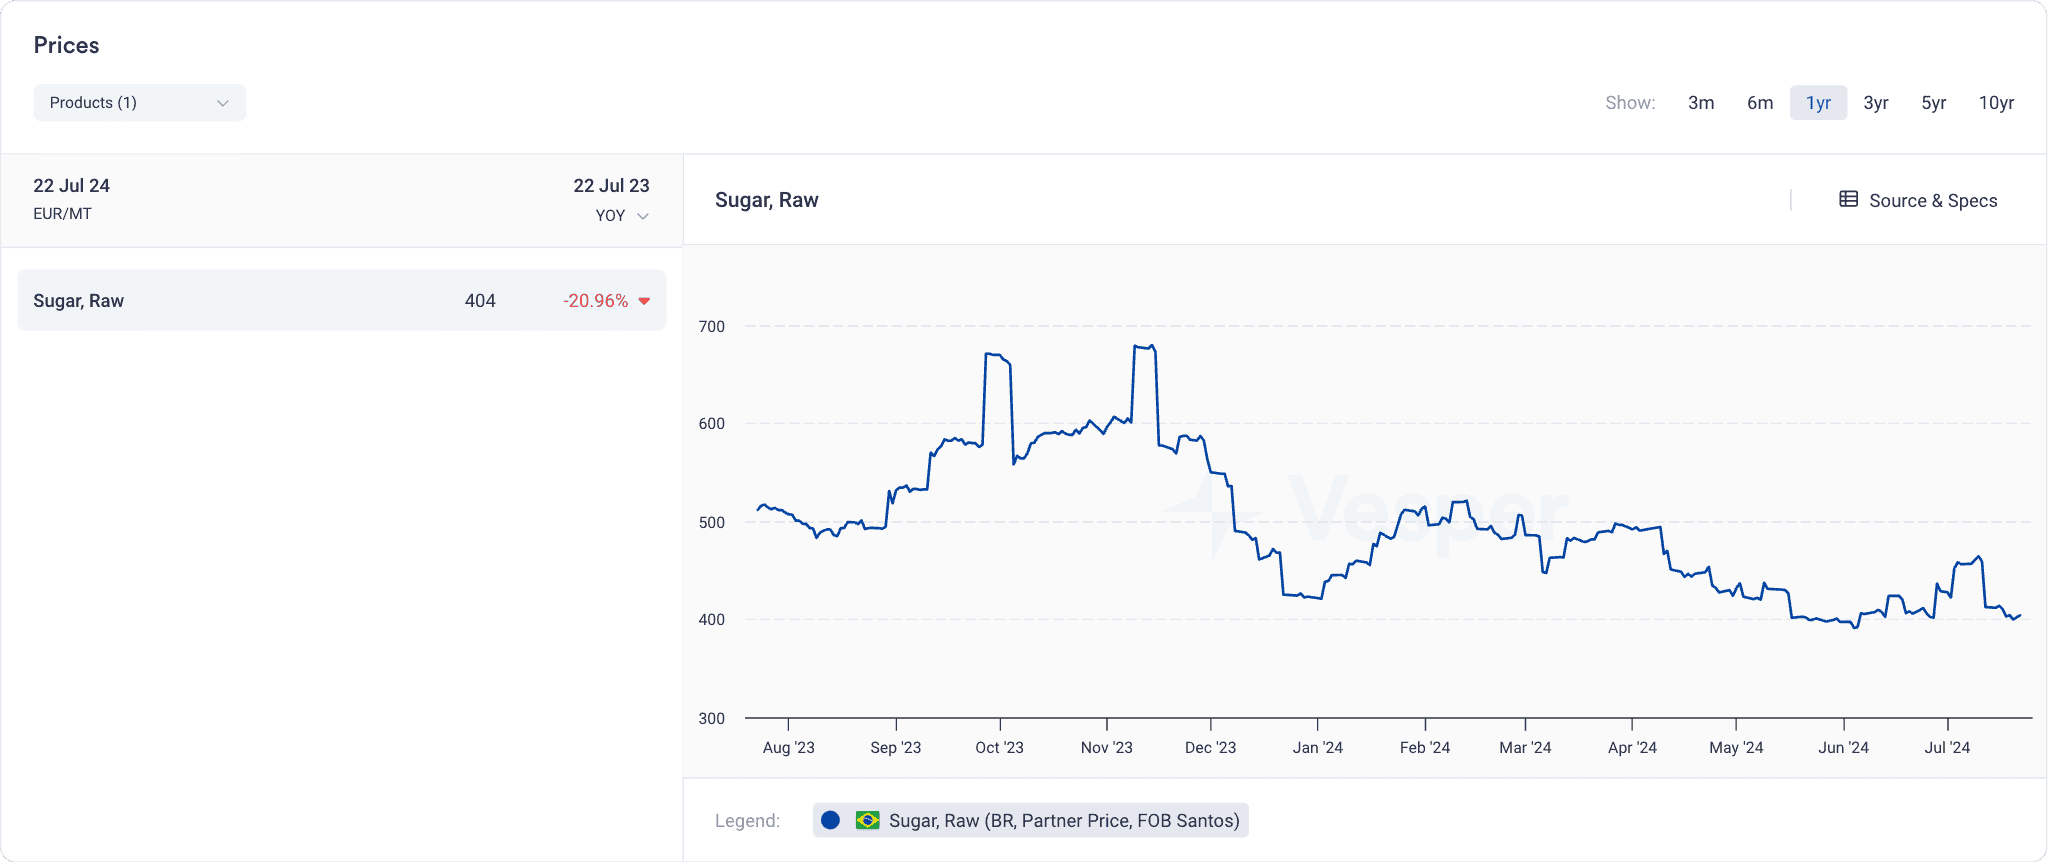
The graph illustrates how prices have responded to Brazil’s increased production levels. As Brazil ramps up its output, the global market anticipates a surplus, which typically leads to lower prices. In this case, the price of raw sugar has decreased by nearly 21% year-over-year, reflecting the impact of Brazil’s higher production. Such a significant drop in prices is a direct consequence of the increased supply, demonstrating the strong influence that major producers like Brazil have on the global sugar market.
However, it’s important to note that while Brazil’s production surge is a significant factor, the overall price movement is the result of multiple contributing elements that interact within the complex dynamics of the global sugar market, like weather conditions, currency fluctuations, changes in consumer demand, government policies and many more.
What Factors Influence Sugar Demand?
Several factors influence sugar demand, including:
- Consumer Preferences: Shifts in dietary habits, such as increased demand for low-sugar or sugar-free products, can affect sugar consumption.
- Economic Growth: In developing countries, economic growth can lead to increased sugar consumption as incomes rise and consumers can afford more processed and sweetened foods.
- Population Growth: An increasing population generally leads to higher sugar consumption, particularly in regions where sugar is a staple in the diet.
- Health Regulations and Taxes: Government policies, such as sugar taxes or health regulations aimed at reducing sugar intake, can decrease demand.
- Seasonality and Cultural Factors: In some regions, sugar demand peaks during festive seasons or harvest periods due to traditional food consumption patterns.
- Industrial Demand: The food and beverage industry, which uses sugar in a wide range of products, can drive demand. Changes in this sector, such as the development of new products or shifts towards alternative sweeteners, can also impact sugar demand.
How Can Sugar Supply And Demand Data Be Used To Predict Market Movements?
Sugar supply and demand data is crucial for predicting market movements by providing insights into potential price changes and availability. Here’s how it works:
- Identifying Surpluses or Deficits: By comparing supply data (production, imports, stock levels) with demand data (consumption, exports), stakeholders can identify potential surpluses or deficits. A surplus might signal falling prices, while a deficit could indicate rising prices.
- Seasonal Patterns: Sugar supply and demand often follow seasonal patterns, with production spikes during harvest seasons and higher consumption during festive periods. Recognising these patterns helps predict price fluctuations.
- Forecasting Trends: Historical data can reveal trends that might repeat under similar conditions. For instance, if a major producer like Brazil increases production significantly, it might lead to lower global prices, as seen in past trends.
- Responding to External Factors: Events such as adverse weather conditions, policy changes, or economic shifts can impact supply and demand. Data helps predict how these factors might influence market movements, enabling stakeholders to make informed decisions.
Where Can I Access Reliable Sugar Supply And Demand Data?
Reliable sugar supply and demand data can be accessed from various sources:
- Government Agencies: National and international agricultural departments, such as the United States Department of Agriculture (USDA) or the Food and Agriculture Organization (FAO), provide comprehensive reports and data on sugar production, consumption, and trade.
- Commodity Intelligence Platforms: like Vesper, where you obtained the current data, offer real-time and historical data, including price indices, production volumes, and trade flows. These platforms are often used by traders, producers, and analysts for detailed market insights.
- Industry Reports: Major commodity and market research firms, such as International Sugar Organization (ISO) and market analysis companies, regularly publish detailed reports on global sugar markets, including forecasts and trend analyses.
- Academic and Research Institutions: Universities and research institutions often publish studies and reports on sugar markets, which include data on supply, demand, and price trends.
- Trade Associations: Industry groups, such as the American Sugar Alliance or European Association of Sugar Manufacturers (CEFS), provide data and reports that are useful for understanding regional markets.
How Does Global Sugar Consumption Affect Supply And Demand?
Global sugar consumption plays a pivotal role in shaping supply and demand dynamics within the sugar market. Here’s how it influences both:
1. Impact on Demand:
- Direct Relationship: As global consumption of sugar increases, the demand for sugar rises. This can occur due to population growth, increased industrial use in food and beverage production, and rising consumer preferences for sugar-laden products in developing economies.
- Price Pressures: Higher consumption drives up demand, which can lead to upward pressure on sugar prices, especially if supply struggles to keep pace. This scenario often leads to tighter markets where the available sugar is limited, driving prices higher.
- Shift in Consumption Patterns: Changes in global consumption patterns, such as a shift towards healthier diets or alternative sweeteners, can decrease the demand for traditional sugar, thus affecting the market negatively by lowering prices.
2. Impact on Supply:
- Production Adjustments: To meet rising global consumption, producers may increase sugar production, either by expanding sugarcane or beet cultivation or by investing in higher-yield technologies. Conversely, if consumption trends downwards, production might be scaled back to avoid oversupply.
- Stock Management: Increased consumption may lead to lower ending stocks if production does not sufficiently cover the demand. In contrast, if consumption falls, stock levels might rise, leading to potential surplus and price drops.
- Influence on Trade: Countries with surplus production often export to regions with higher consumption needs. A rise in global consumption can thus stimulate international trade, while a decline may reduce export volumes.
In recent years, as the economies of China and India have expanded, their sugar consumption has grown as well. This increased demand is largely driven by higher consumer spending on processed foods and beverages, which tend to be high in sugar content. To meet this growing demand, both China and India have increasingly relied on imports to supplement their domestic production, particularly during periods of low yields caused by adverse weather or other challenges.
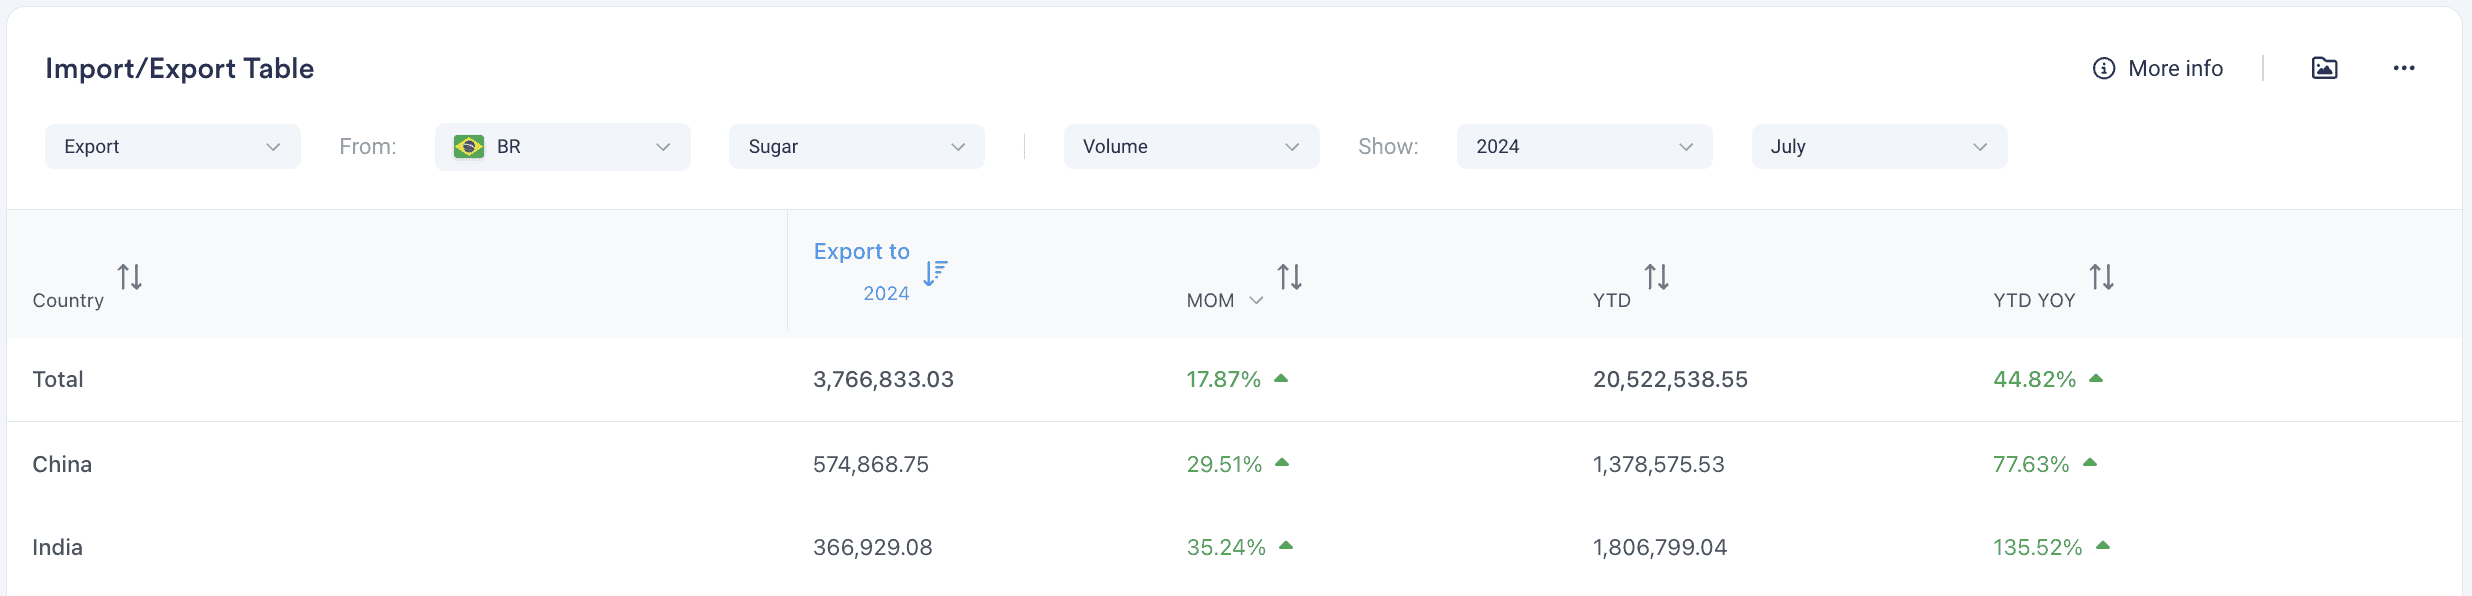
Brazil, the world’s largest sugar producer, quickly capitalized on this opportunity. By July 2024, Brazil’s sugar exports to India had increased by over 135% compared to the previous year, with exports to China also rising significantly by more than 77% year-over-year, as shown in Vesper’s Import/Export table below. Brazil’s ability to produce sugar at a lower cost and in larger quantities than many other countries made it the preferred supplier for these high-demand nations.
3. Balancing Supply and Demand:
- Market Equilibrium: The balance between global sugar consumption (demand) and production (supply) is crucial for maintaining stable market conditions. When consumption outstrips supply, it can lead to shortages and price spikes. Conversely, when supply exceeds consumption, it can lead to surpluses and falling prices.
- Policy and Regulation: Governments may intervene to manage this balance by imposing export bans, subsidizing production, or controlling stock levels to ensure adequate domestic supply without causing significant disruptions to the global market.
A real-life example of government intervention to manage market equilibrium in the sugar industry is India’s export ban on sugar in 2023.
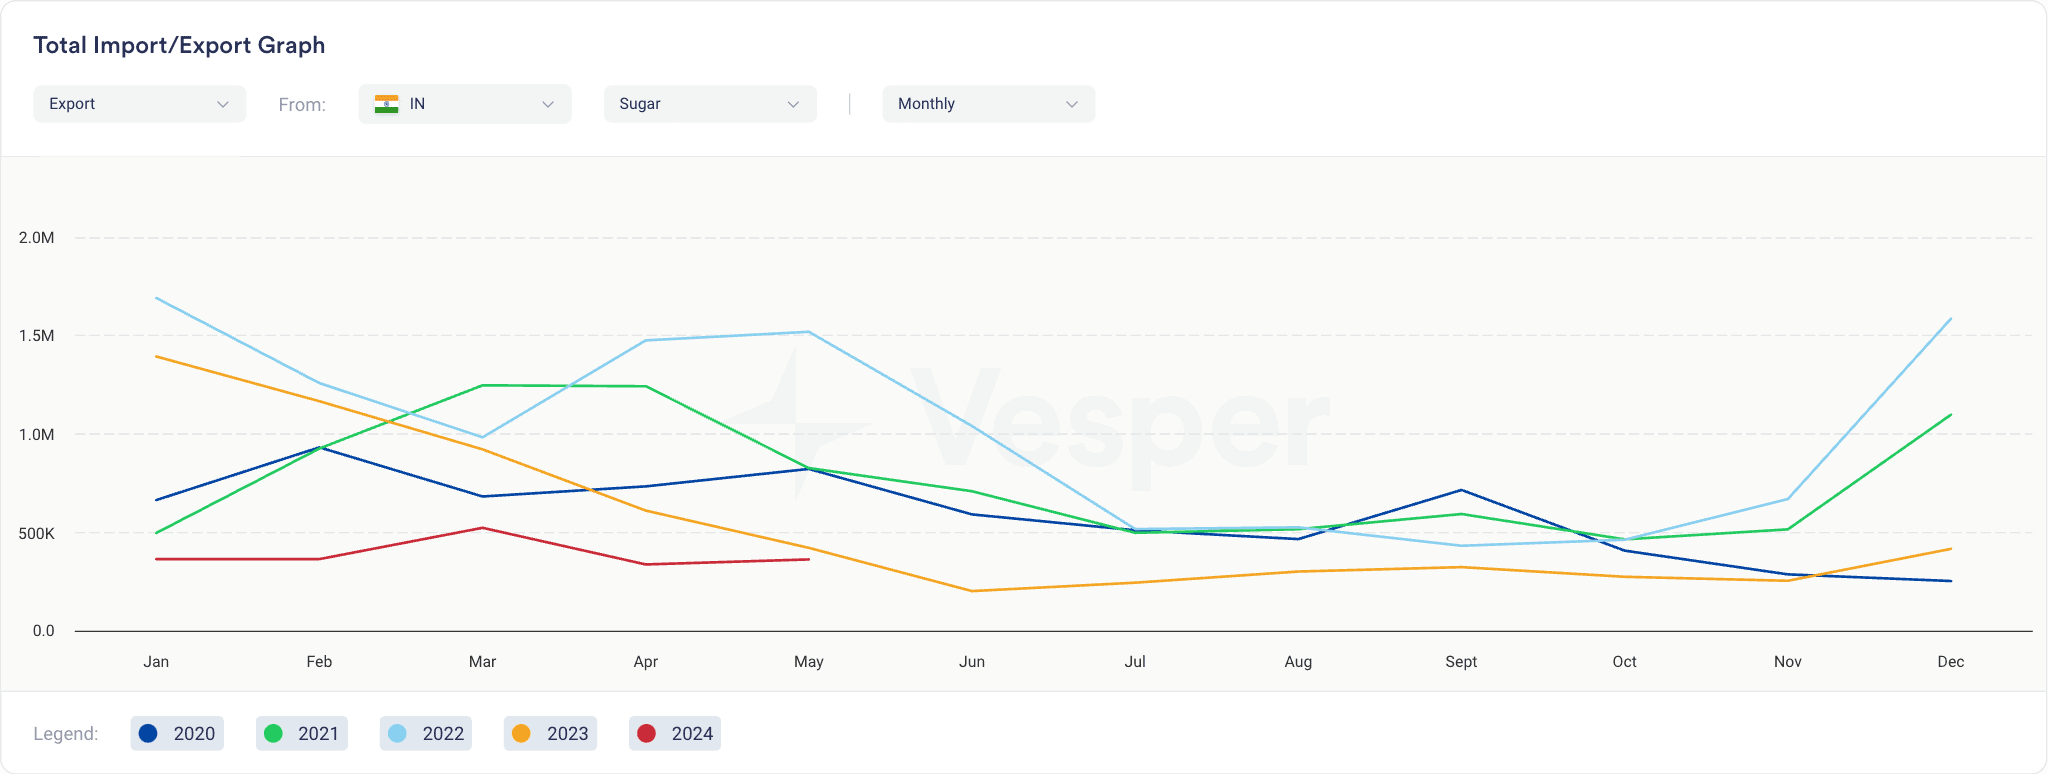
India, one of the world’s largest sugar producers, faced a significant drop in sugar production in the 2022/2023 season due to poor monsoon rains and adverse weather conditions. As a result, domestic sugar stocks were under pressure, raising concerns about meeting domestic consumption needs. To prevent a shortage in the domestic market and avoid a sharp increase in prices, the Indian government imposed an export ban on sugar in August 2023, leading exports to decrease significantly, with a year-over-year drop of 46.34% from January to December 2023. The monthly export trends in the figure below further illustrate a sharp decline in export volumes compared to previous years, reflecting the impact of the ban on India’s sugar trade.
Initially, the ban was set to expire in October 2023, but it was extended indefinitely due to ongoing concerns about domestic supply levels. This intervention was aimed at ensuring that enough sugar was available for domestic consumption and to stabilize prices within the country.
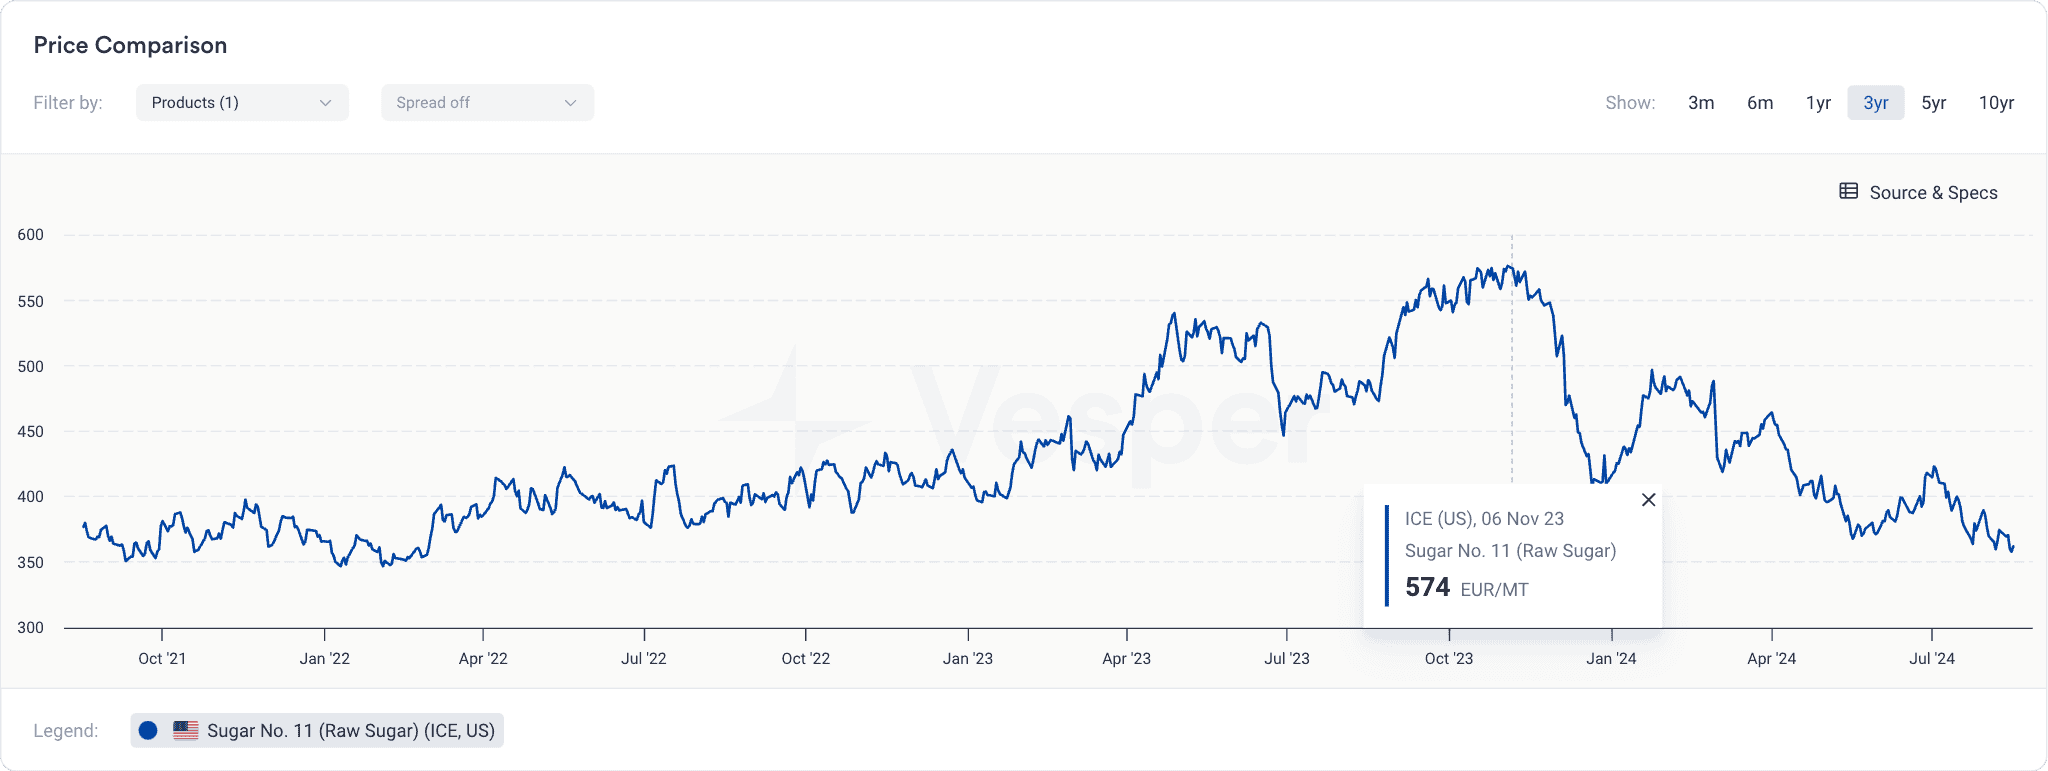
The export ban had significant implications for the global sugar market. As India typically exports large quantities of sugar, the ban reduced global supply, contributing to higher international sugar prices. In just a few months, global sugar prices saw a significant increase. By 1 November 2023, this price had risen to 574 EUR/MT, marking a notable increase over this short period, see figure below.
This is a clear example of how government policies can be used to manage the balance between supply and demand, protecting domestic interests while also influencing global market dynamics.
In summary, global sugar consumption is a key driver of demand that directly influences supply strategies, market pricing, and trade flows. Any significant change in consumption patterns can lead to corresponding adjustments in production and stock management, ultimately affecting the global sugar market’s stability and pricing.