Sugar Market Analysis
Conducting a thorough sugar market analysis is essential for anyone involved in the sugar industry, whether you’re a producer, trader, or investor. Understanding the dynamics of the sugar market enables you to make informed decisions, anticipate price movements, and identify potential opportunities.
In this article, we’ll explain how to conduct a comprehensive sugar market analysis. We’ll guide you through understanding the key factors driving the sugar market, which datasets to monitor, how market analysis can help you predict price movements, where to find the essential data you need, and which tools can assist you in your analysis.
Key Datasets for Sugar Market Analysis
When conducting a sugar market analysis, it’s essential to consider a range of key datasets that reflect the various factors driving the market. These datasets provide the foundational information needed to understand the market dynamics and predict future price movements. Below is a more detailed explanation of the critical datasets you should use in your sugar market analysis, with examples to illustrate their importance.
1. Supply and Demand Data
Supply and demand are the most fundamental factors in any commodity market, including sugar. The balance between the amount of sugar produced and the quantity consumed directly impacts prices.
- Production Data: This includes data on the total amount of sugar produced globally and regionally. Tracking production volumes over time allows analysts to identify trends, such as increasing or decreasing output in key producing countries like Brazil, India, and Thailand. For example, if Brazil, the world’s largest sugar producer, forecasts a significant drop in production due to weather conditions, it would likely lead to higher global sugar prices.
- Consumption Data: This includes the amount of sugar consumed by different countries or regions. Changes in consumer preferences, health trends, and economic conditions can all influence sugar consumption levels. For instance, a growing trend towards sugar reduction in diets in Western countries could lead to lower demand and potentially lower prices.
- Import/Export Data: Understanding trade flows between countries is essential for assessing global supply and demand. If a major importer like China reduces its sugar imports due to domestic production increases, this could lower global demand and exert downward pressure on prices.
2. Weather Conditions Data
Weather plays a crucial role in sugar production, particularly for sugarcane and sugar beet crops. Adverse weather conditions can drastically affect crop yields, which in turn impacts supply and prices.
- Temperature and Precipitation Data: Monitoring weather patterns, such as rainfall levels and temperatures, in key sugar-producing regions helps predict potential disruptions in supply. For instance, a severe drought in India’s sugarcane-growing regions could lead to reduced yields, decreasing supply and driving up prices.
- Extreme Weather Events: Data on hurricanes, floods, or other extreme weather events can provide early warnings of potential supply disruptions. For example, during an El Niño event, which is associated with warmer-than-average sea surface temperatures, parts of Southeast Asia, including Thailand, often experience severe droughts. Such droughts could significantly reduce sugarcane yields, leading to a spike in global sugar prices due to the sudden reduction in supply. Conversely, a La Niña event could bring heavier-than-normal rainfall to the same region, potentially causing floods that could similarly disrupt sugar production and push prices higher.
- Climate Trends: Long-term climate data helps in understanding how changing weather patterns might impact sugar production in the future. If climate change leads to more frequent droughts in major sugar-producing areas, this could have long-term implications for global sugar supply and prices.
3. Government Policies and Regulations
Government interventions can significantly influence the sugar market through subsidies, tariffs, and trade policies. These policies can either support or hinder production and trade, affecting global supply and prices.
- Subsidies and Support Prices: Data on government subsidies and minimum support prices in major sugar-producing countries like India can provide insights into production levels. For example, if the Indian government raises the minimum support price for sugarcane, it may lead to increased production, contributing to a surplus and potentially lower global prices.
- Import/Export Tariffs: Information on tariffs and trade barriers is crucial for understanding international trade flows. For instance, if the European Union imposes higher tariffs on sugar imports, it could reduce the flow of sugar into the EU, tightening supply and raising prices within the region.
- Regulatory Changes: Data on new regulations, such as restrictions on sugar production due to environmental concerns, can impact supply. For example, if Brazil implements stricter environmental regulations on sugarcane farming, it could reduce production capacity, affecting global supply and prices.
4. Currency Fluctuations
Currency exchange rates have a direct impact on international trade and, consequently, on the sugar market. Since sugar is traded globally, the value of the currency in major sugar-producing or consuming countries can influence prices.
- Exchange Rate Data: Tracking the exchange rates of currencies in key sugar-exporting countries like Brazil and India is crucial. For example, if the Brazilian real weakens against the U.S. dollar, Brazilian sugar becomes cheaper for foreign buyers, potentially increasing demand and driving up prices.
- Inflation Data: Inflation rates in major economies can also influence currency values and trade. For instance, high inflation in a sugar-producing country might weaken its currency, making its exports more competitive and affecting global sugar prices.
5. Biofuel Prices and Production Data
The relationship between sugar and biofuels, particularly ethanol, is a critical factor in the sugar market, especially in countries like Brazil where sugarcane is used for both sugar and ethanol production.
- Ethanol Prices and Production Data: Data on ethanol prices can help predict shifts in production priorities. For example, if ethanol prices rise sharply, sugar producers might switch more of their sugarcane to ethanol production, leading to a decrease in sugar supply and higher prices.
- Government Biofuel Policies: Policies promoting biofuel use, such as subsidies or mandates for ethanol blending in gasoline, can increase demand for sugarcane in ethanol production. This shift can reduce the amount of sugar available for food markets, affecting global prices. The Indian government, for instance, has been actively promoting the use of ethanol-blended petrol as part of its National Biofuels Policy. The goal is to increase the ethanol content in petrol to 20% (E20) by 2025, which is a significant step up from the current blend of 10% ethanol (E10).
6. Import Parity and Export Parity Prices
Import parity and export parity prices are key indicators in the sugar market that help determine the viability of importing or exporting sugar. Monitoring IPP and EPP helps predict trade flows and price movements.
- Import Parity Price (IPP): The import parity price is the cost at which a commodity can be imported, including all costs associated with bringing the product to the domestic market. This includes the international price of sugar, shipping costs, insurance, customs duties, and any other import-related expenses. For example, if sugar prices are lower on the international market compared to domestic prices, importers may find it cheaper to import sugar rather than purchase it locally. For instance, if domestic sugar prices in India are higher than the IPP, traders may opt to import sugar, increasing supply in the domestic market and potentially lowering local prices.
- Export Parity Price (EPP): The export parity price is the price at which a commodity can be exported, taking into account all costs associated with selling the product internationally. This includes the domestic price of sugar, plus transportation, shipping, insurance, and any export-related taxes or fees. For instance, if the domestic price of sugar in Brazil is lower than the EPP, it may be more profitable for producers to export sugar rather than sell it in the domestic market. This can reduce the domestic supply of sugar, leading to higher local prices, while increasing supply in the global market.
Where Can I Find the Primary Datasets to Use in My Sugar Market Analysis?
This list will help you locate reliable data sources for each category, providing the comprehensive information needed for your sugar market analysis.
1. Supply and Demand Data
- Production Data:
- US Department of Agriculture (USDA): USDA Foreign Agricultural Service
- Food and Agriculture Organization (FAO): FAOSTAT
- International Sugar Organization (ISO): ISO Reports
- UNICA (Brazil): UNICA Reports
- Ministry of Agriculture & Farmers Welfare (India): Indian Sugar Data
- Consumption Data:
- USDA Economic Research Service (ERS): USDA ERS
- FAO: FAOSTAT
- ISO: ISO Reports
- Import/Export Data:
- World Trade Organization (WTO): WTO Trade Data
- USDA Foreign Agricultural Service (FAS): USDA FAS
- Global Trade Atlas: Global Trade Data
- International Trade Centre (ITC): ITC Trade Map
2. Weather Conditions Data
- Temperature and Precipitation Data:
- NOAA (National Oceanic and Atmospheric Administration): NOAA Data
- Hyperlocal and Satellite Analytics Technology (HSAT)
- Extreme Weather Events:
- Global Disaster Alert and Coordination System (GDACS): GDACS Alerts
- NOAA: NOAA Extreme Weather Data
- Climate Trends:
- Intergovernmental Panel on Climate Change (IPCC): IPCC Reports
- NASA’s Goddard Institute for Space Studies (GISS): GISS Climate Data
- European Environment Agency (EEA): EEA Climate Data
3. Government Policies and Regulations
- Subsidies and Support Prices:
- Ministry of Agriculture & Farmers Welfare (India): Indian Government Policies
- Brazilian Ministry of Agriculture (MAPA): MAPA Policies
- European Commission: EU Agriculture Policies
- Import/Export Tariffs:
- World Trade Organization (WTO): WTO Tariffs Data
- International Trade Centre (ITC): ITC Market Access Map
- Regulatory Changes:
- FAO Legal Office: FAO Legal and Regulatory Data
- OECD (Organisation for Economic Co-operation and Development): OECD Agricultural Policies
4. Currency Fluctuations
- Exchange Rate Data:
- XE Currency Data: XE Currency Tools
- Bloomberg: Bloomberg Exchange Rates
- Inflation Data:
- International Monetary Fund (IMF): IMF Inflation Data
- World Bank: World Bank Economic Indicators
- Trading Economics: Global Inflation Data
5. Biofuel Prices and Production Data
- Ethanol Prices and Production Data:
- US Energy Information Administration (EIA): EIA Biofuels Data
- Renewable Fuels Association (RFA): RFA Ethanol Data
- UNICA (Brazil): UNICA Ethanol Reports
- Government Biofuel Policies:
- Indian Ministry of New and Renewable Energy (MNRE): India Biofuels Policy
- U.S. Department of Energy (DOE): DOE Biofuels Policy
- European Commission: EU Renewable Energy Directive
6. Import Parity and Export Parity Prices
- Import Parity and Export Parity Prices:
- Vesper
- Datagro
- GreenPool
- Czarnikow
How Can Commodity Intelligence Platforms Enhance Your Sugar Market Analysis?
Commodity intelligence platforms offer powerful tools and insights that can significantly enhance your sugar market analysis. By integrating real-time data, advanced analytics, and customizable features, these platforms help you make more informed decisions, anticipate market trends, and respond swiftly to changing conditions. This section explores how commodity intelligence platforms can elevate your analysis and provide a competitive edge in the sugar market, using Vesper’s commodity intelligence platform as an example.
Vesper’s commodity intelligence platform provides a comprehensive solution with real-time data, market forecasts, and analysis tools tailored specifically for the sugar market. Vesper’s dashboard is designed to be user-friendly, even for those who may not be experts in data analysis. The clean, intuitive interface makes it easy to navigate between different sections and datasets. Vesper offers the following features useful for market analysis:
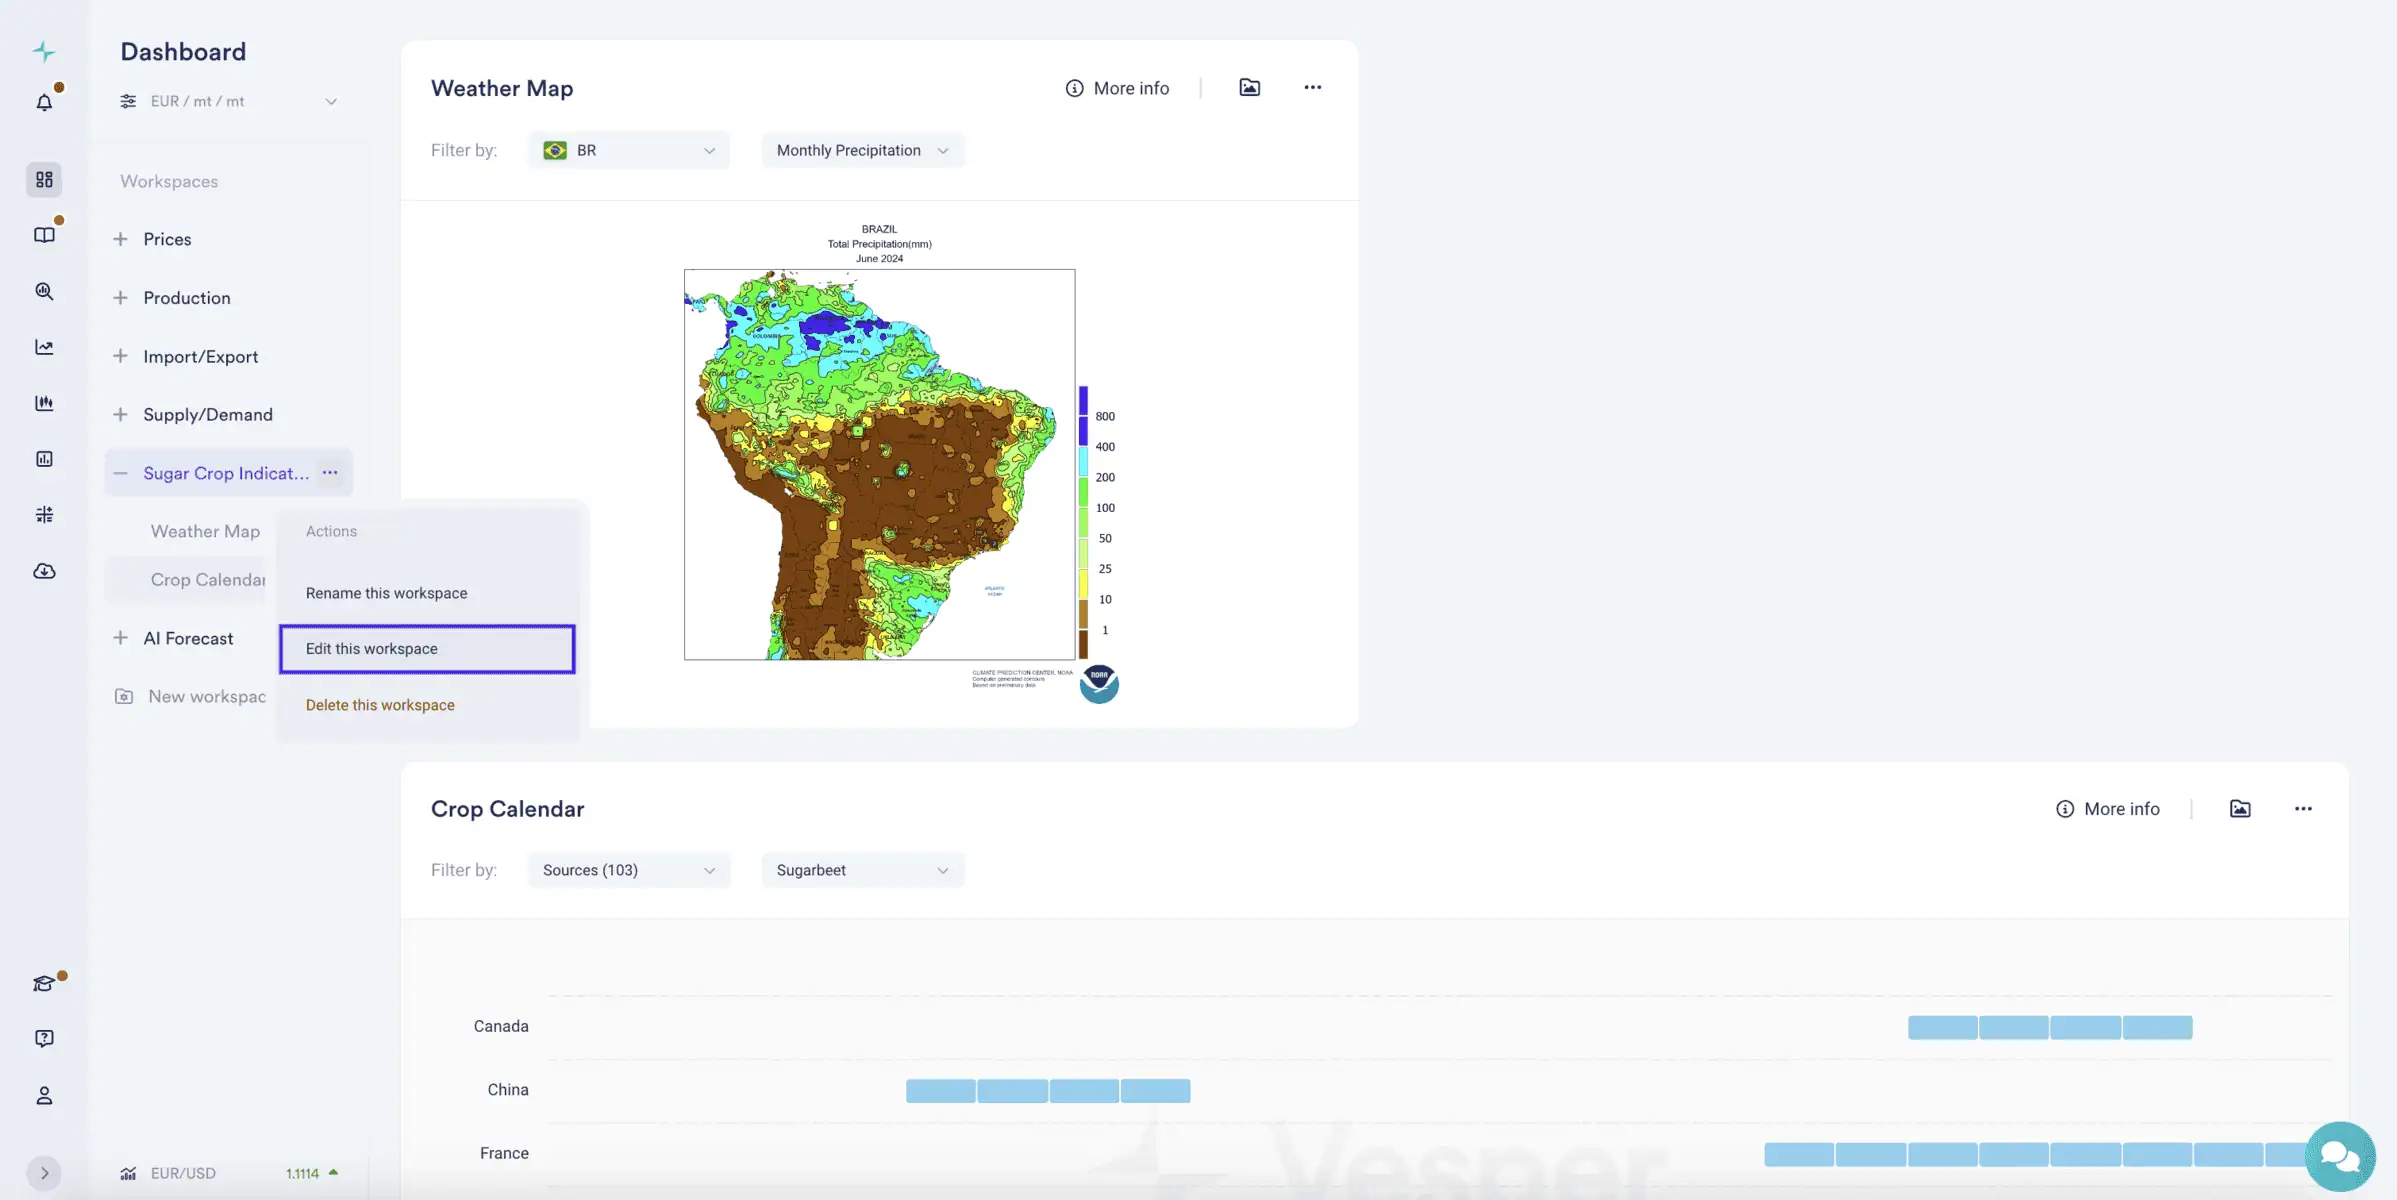
- Personalization: Vesper’s dashboard lets you add, remove, or rearrange widgets based on the data and insights most relevant to your work. Whether you need to track real-time sugar prices, monitor weather conditions, or analyze import/export data, you can configure your dashboard to display the information that matters most to you.In the example below, a dashboard is created to focus solely on Crop Indicators for the sugar market, including datasets like Weather Map and Crop Calendar.

As shown in the image above, the weather in Brazil’s Center-South (CS) sugarcane-producing regions remains hot and dry, with no rain expected for the next two weeks. This follows a production slowdown caused by rains in the first half of July 2024, which disrupted harvesting activities. Additionally, there are growing concerns about cane quality, with reports of a lower-than-expected sugar mix and yields. The ongoing drought has further strained cane quality, which could negatively affect overall sugar output.
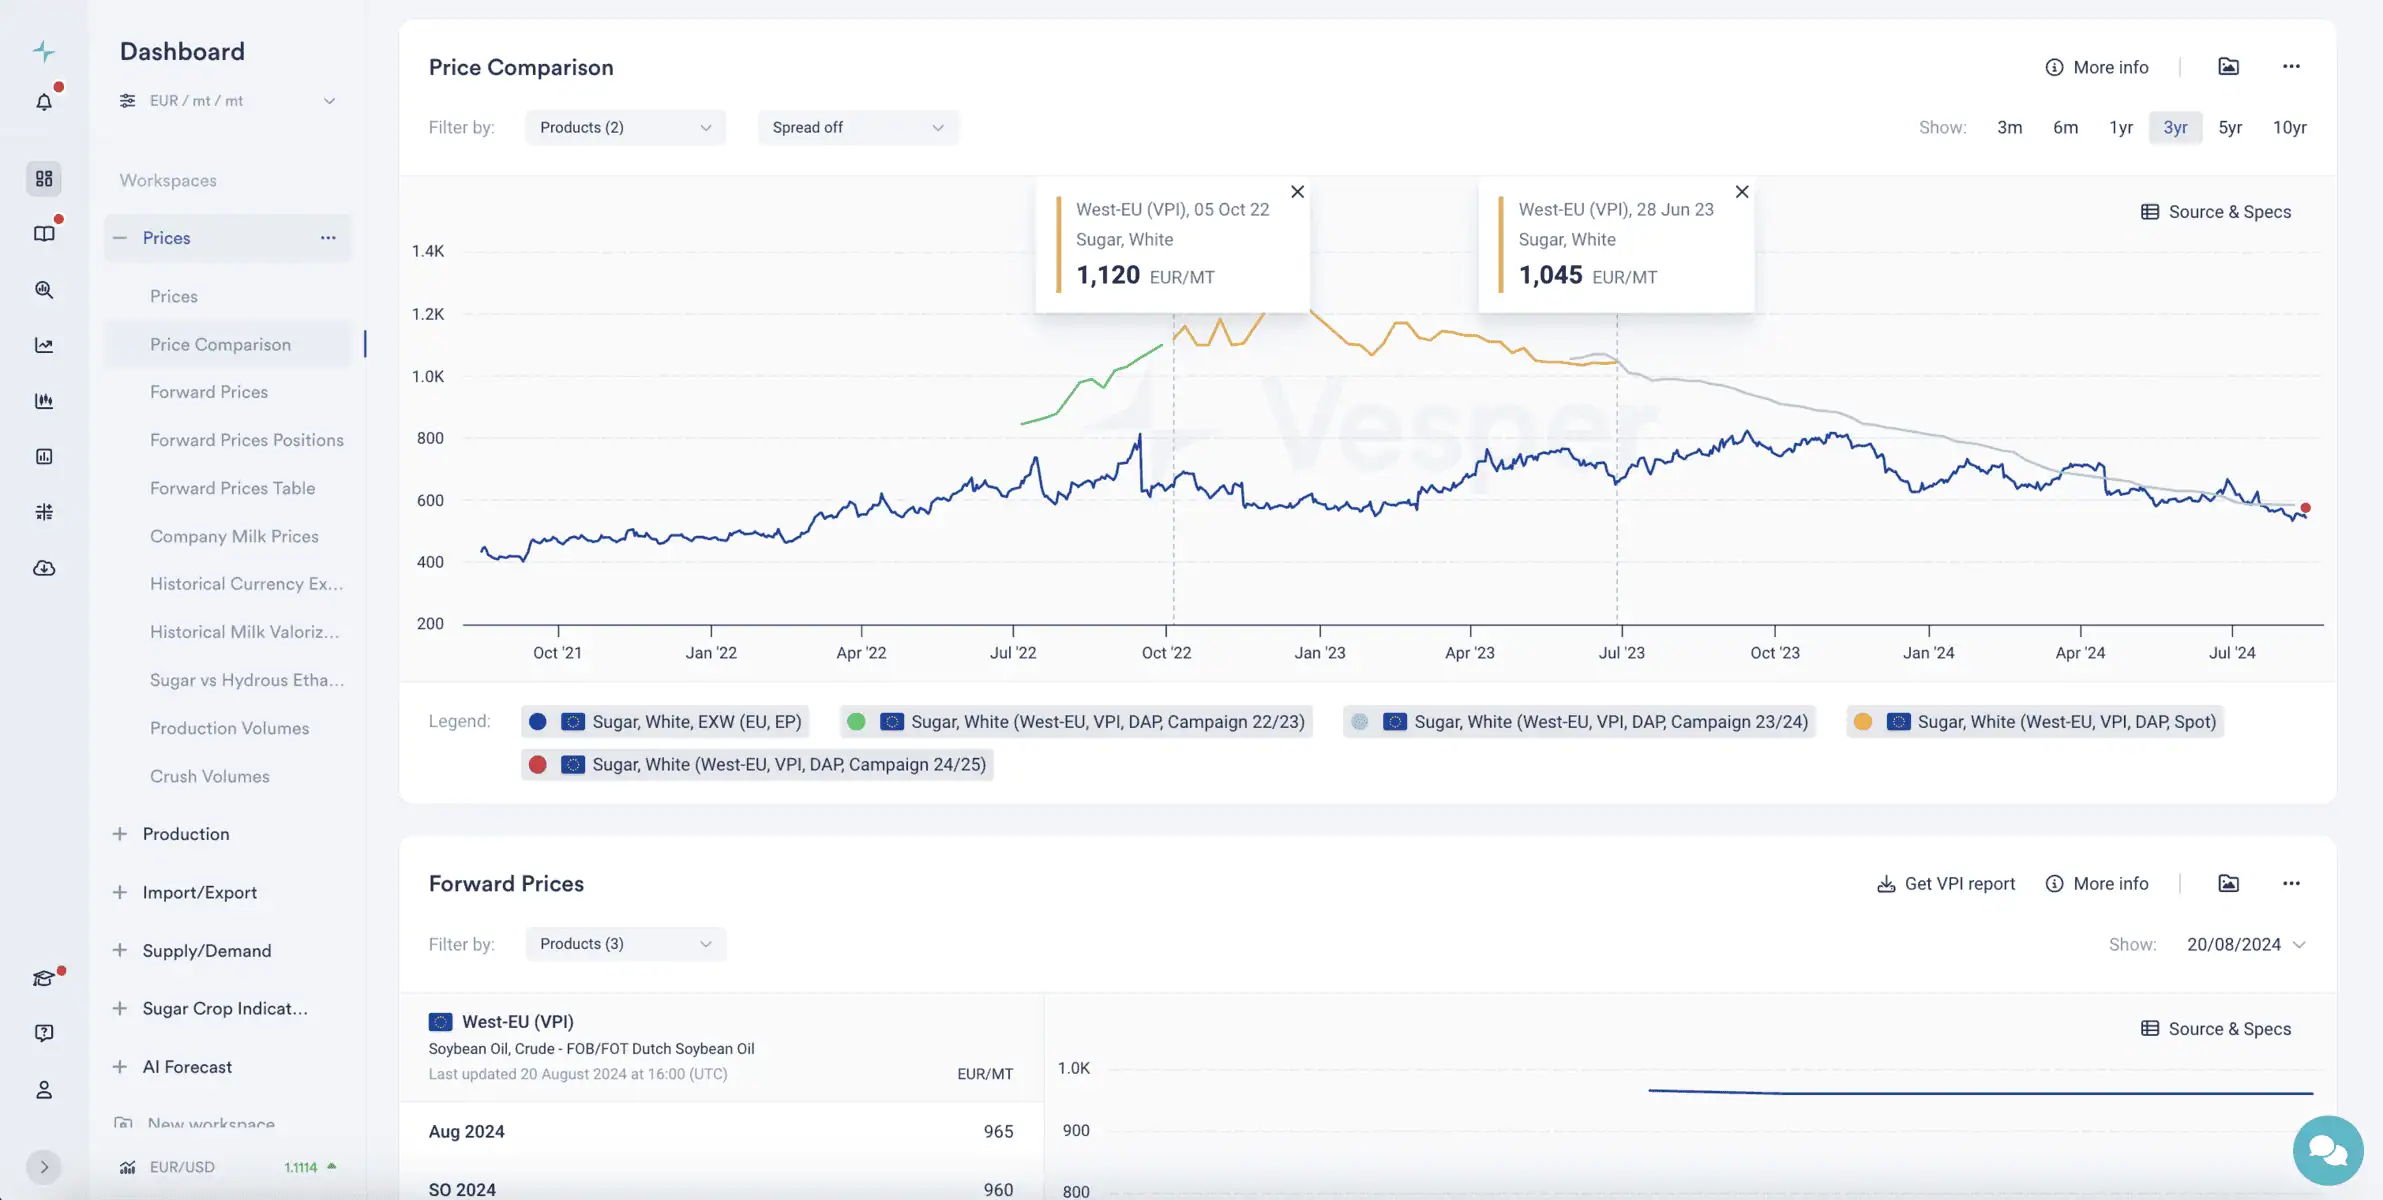
- Interactive Charts and Graphs: Vesper’s dashboard includes tools for visualizing data through charts and graphs, which you can customize to compare different datasets, spot trends, and conduct in-depth analysis.In the example below, Vesper enables you to compare multiple prices on a single chart, allowing you to lock in multiple tooltips for use in internal meetings. Here, you can see a comparison of Spot and Campaign Prices with the Export Parity price for white sugar in Europe.

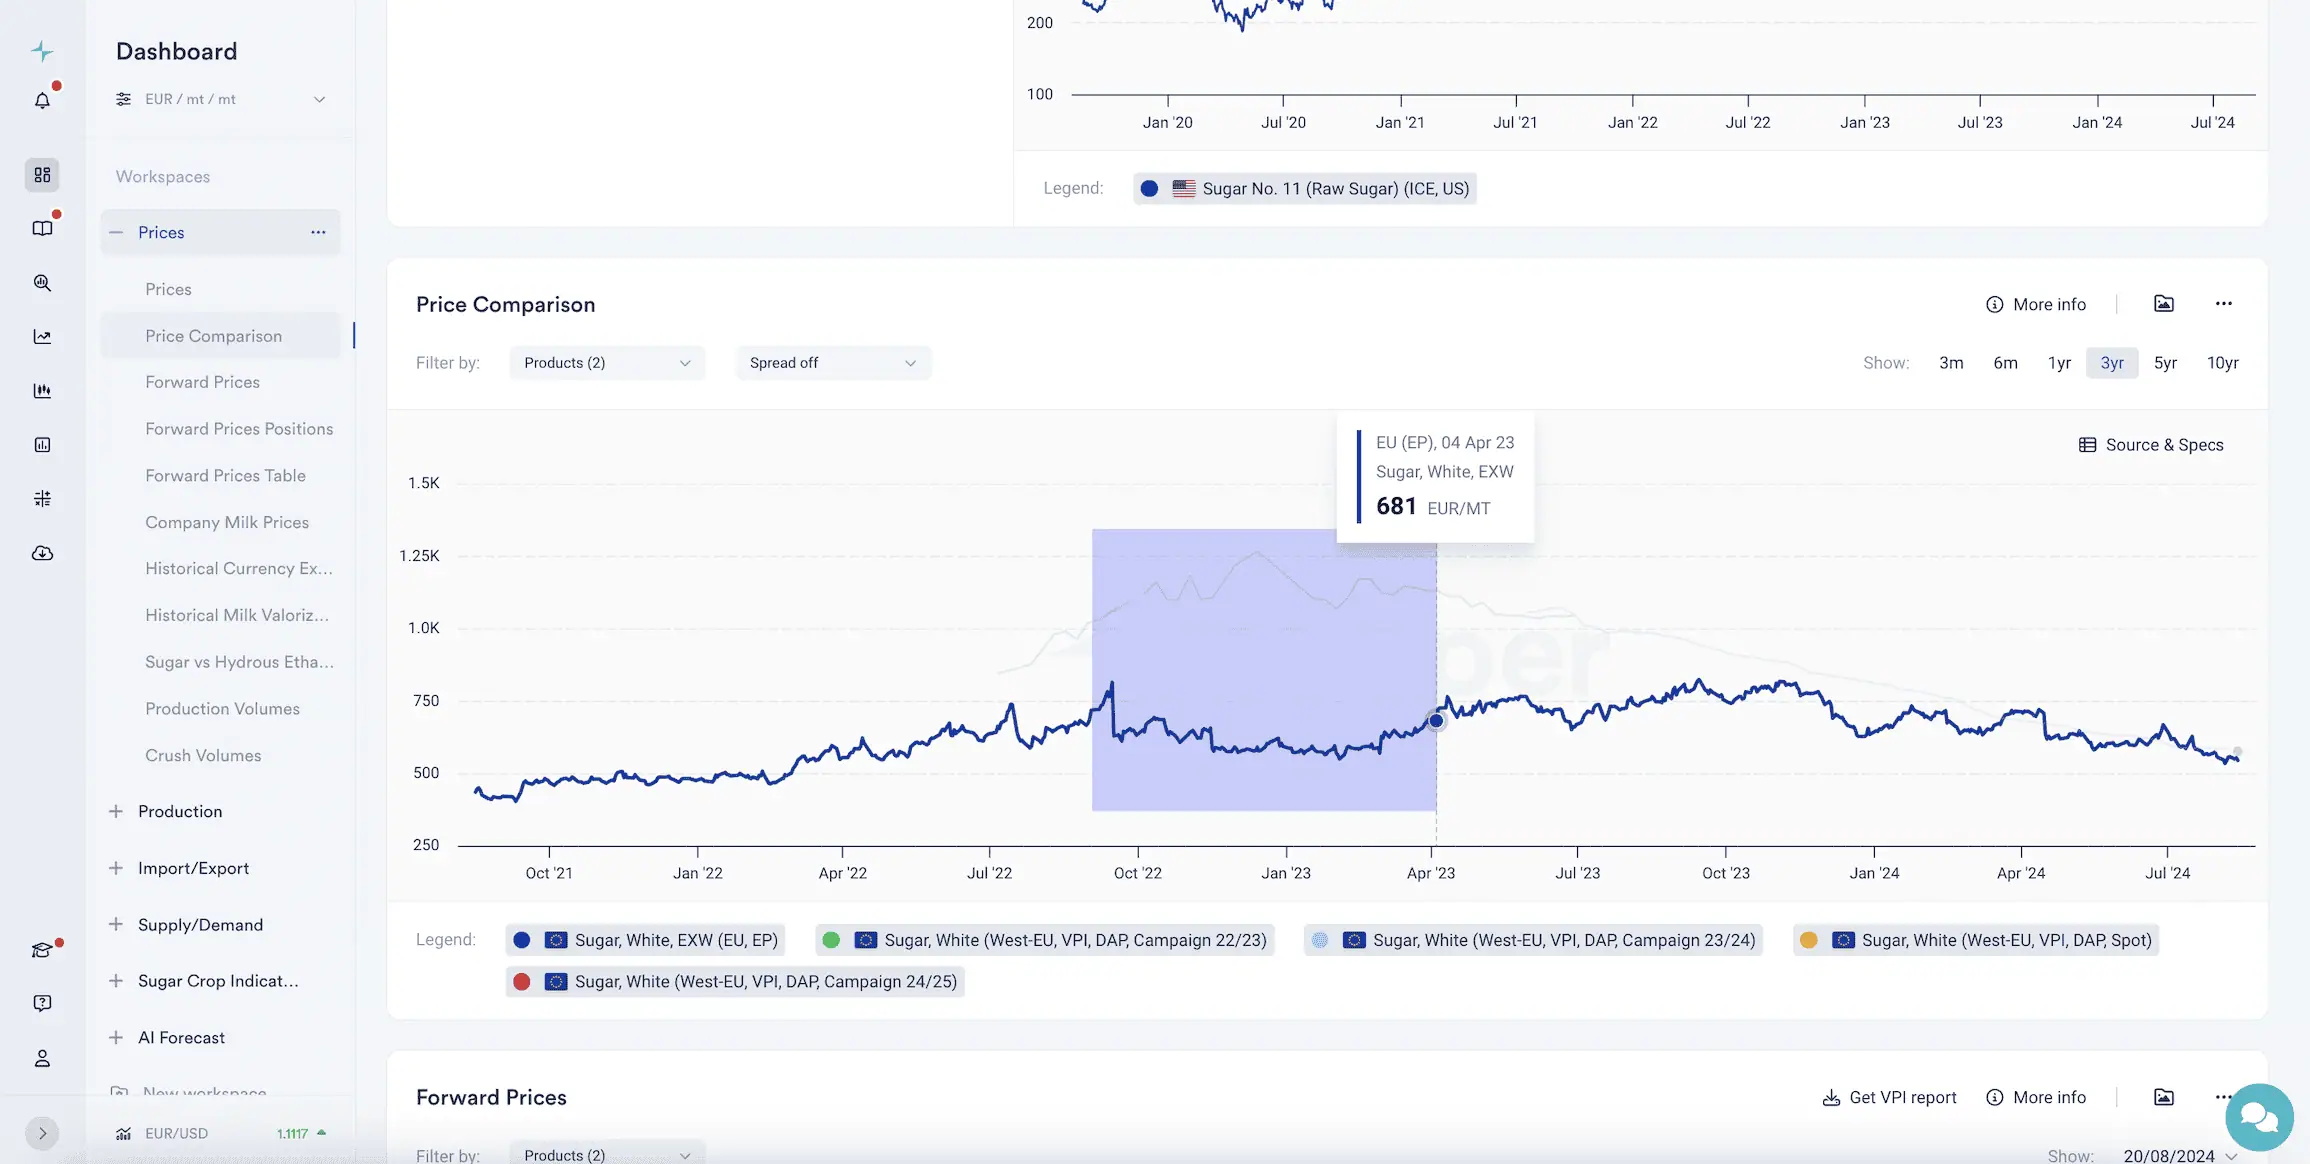
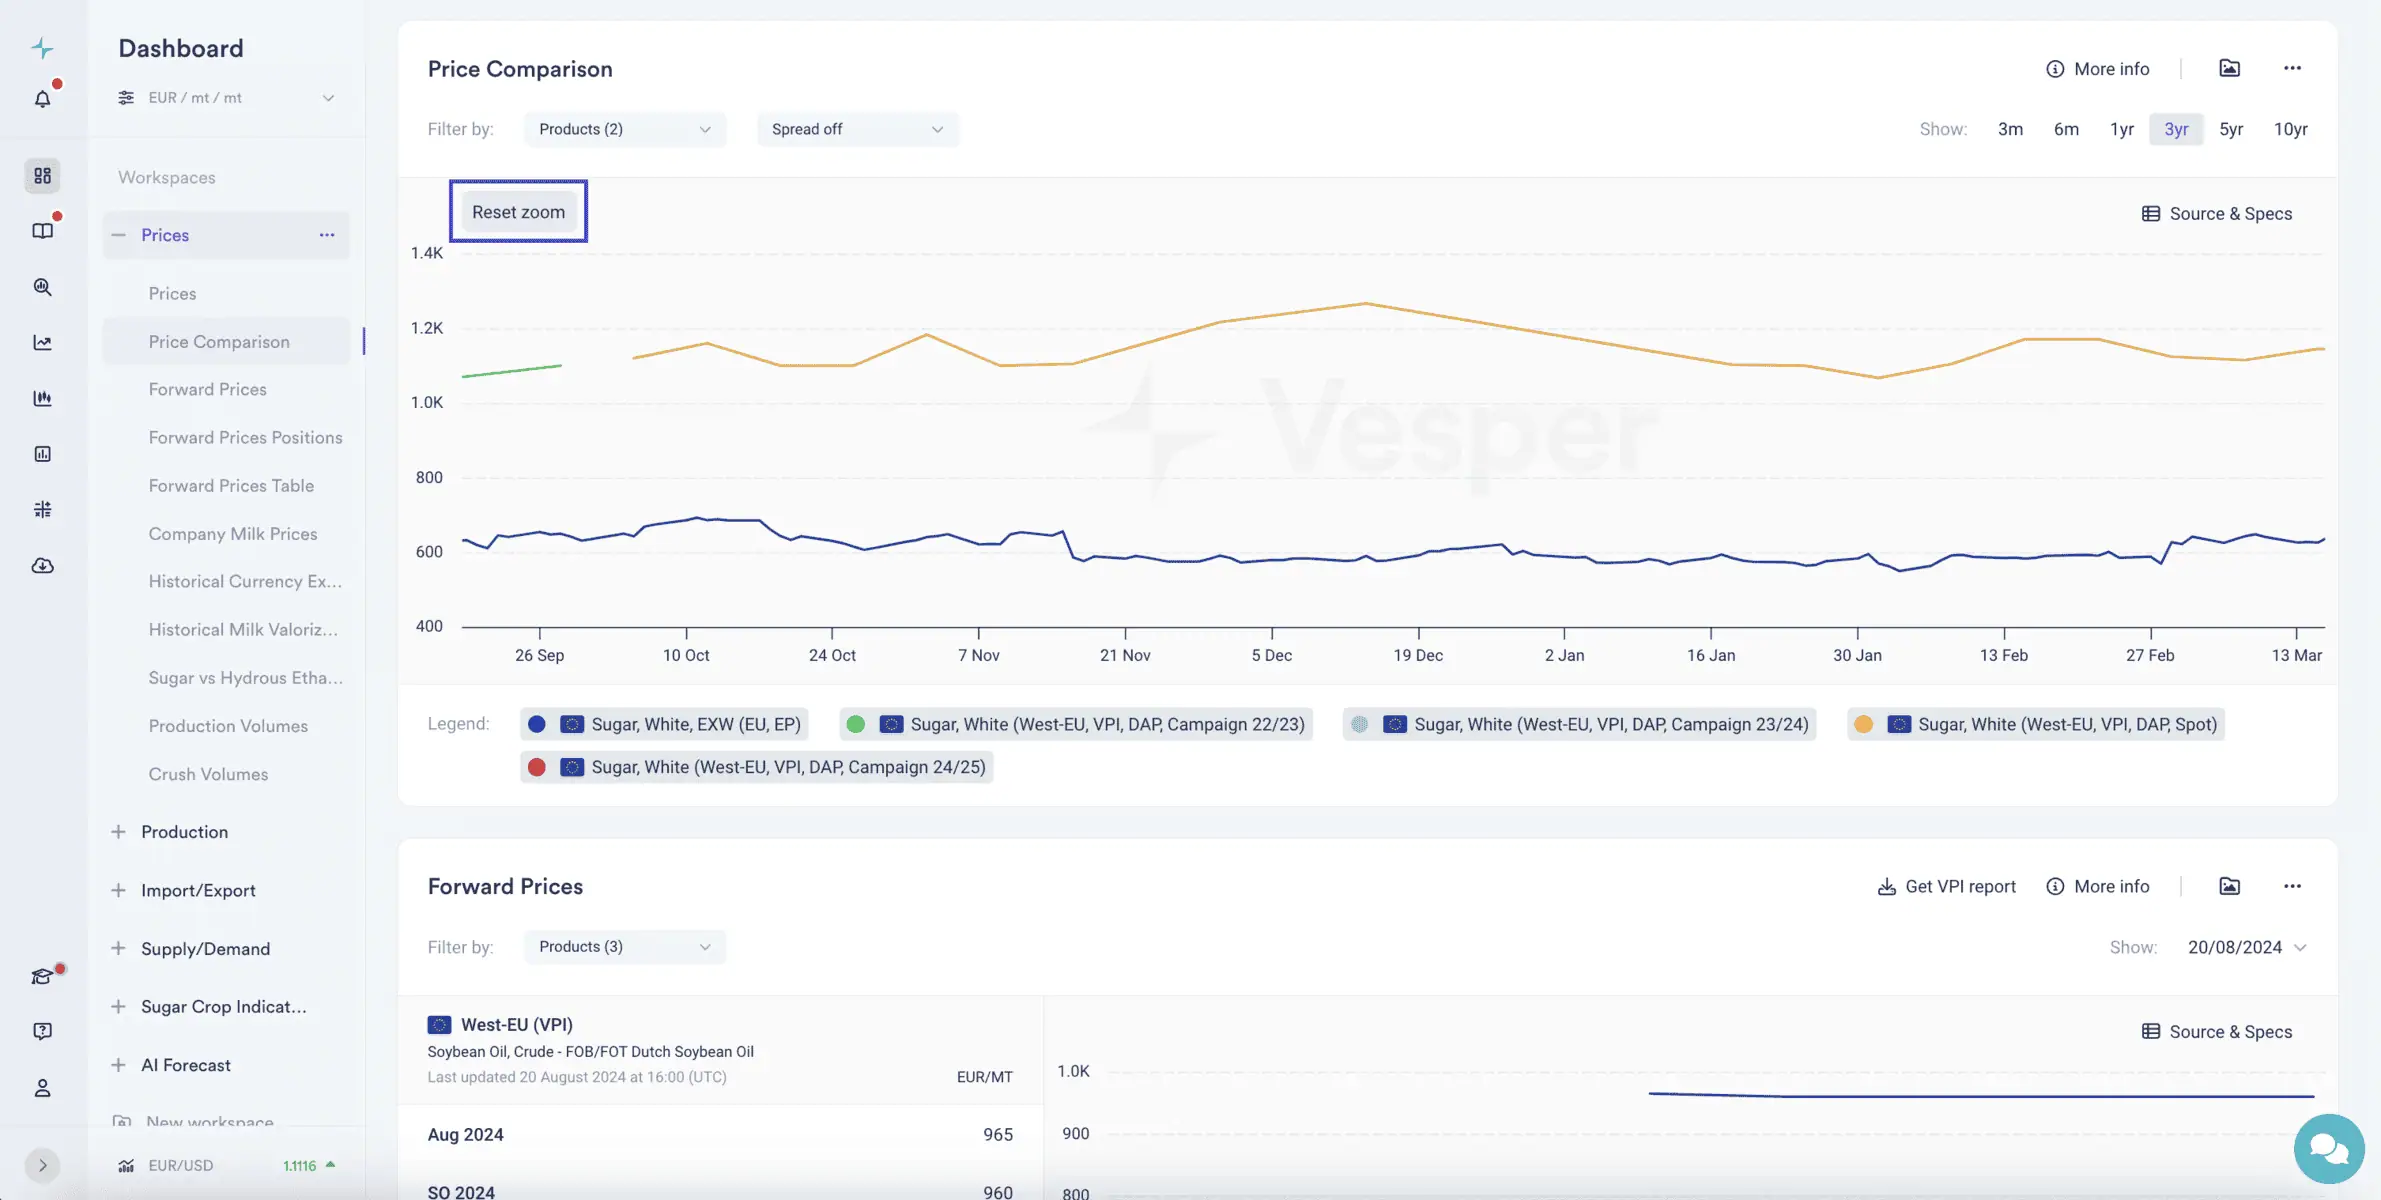
Vesper also provides a zoom-in function for more detailed analysis. Simply select the timeframe you want to focus on, as shown below, and click the zoom-out button to return to the original full 3-year timeline view.


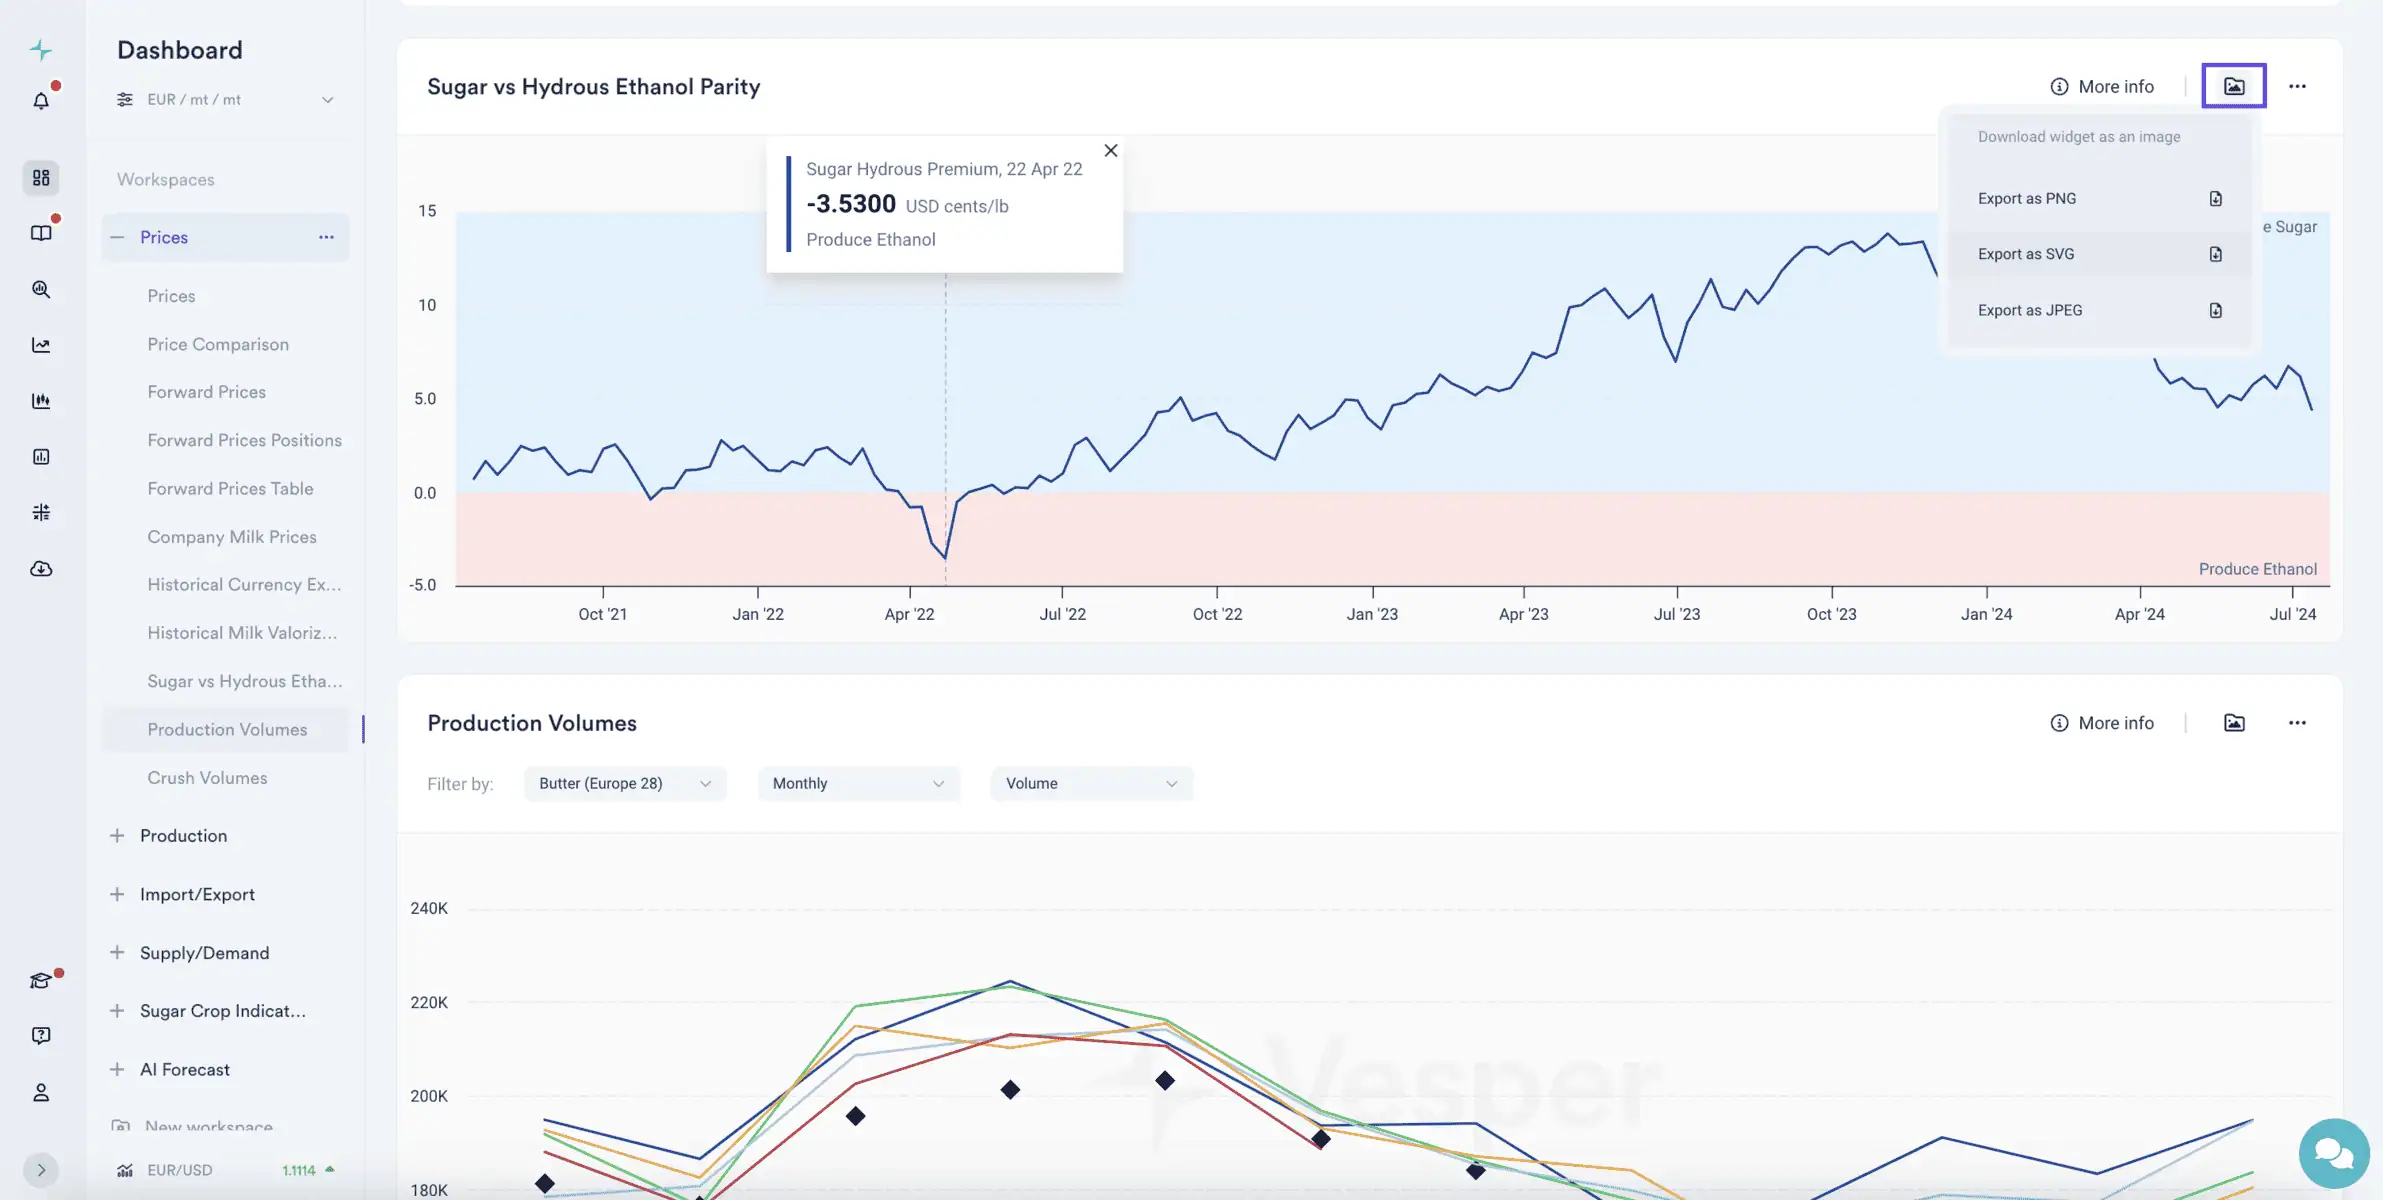
- Export and Sharing Options: Vesper offers you the ability to easily export your analysis, charts, and reports, in different file formats or share them directly with colleagues, streamlining collaboration and decision-making processes.In the example below, a tooltip is added to the Sugar vs. Hydrous Ethanol Parity Widget. You can easily export this widget, along with its tooltips, as an image in PNG, SVG, or JPEG format.

- API Integration: You can integrate Vesper’s data into your internal database you already use, creating a unified platform where all your key information is accessible in one place, with our API Integration.This setup not only enriches your data repository with seamless access to over 160+ data sources but also automates the generation of custom reports and dashboards, standardizes data access across your organization, and enhances your overall data analysis capabilities.Additionally, this integration optimizes resource allocation, reduces redundant subscriptions, and saves you time by automating updates, allowing you to focus on strategic tasks and deeper insights.Check out in this case study how FrieslandCampina benefits from using Vesper’s API for improving pricing strategies.
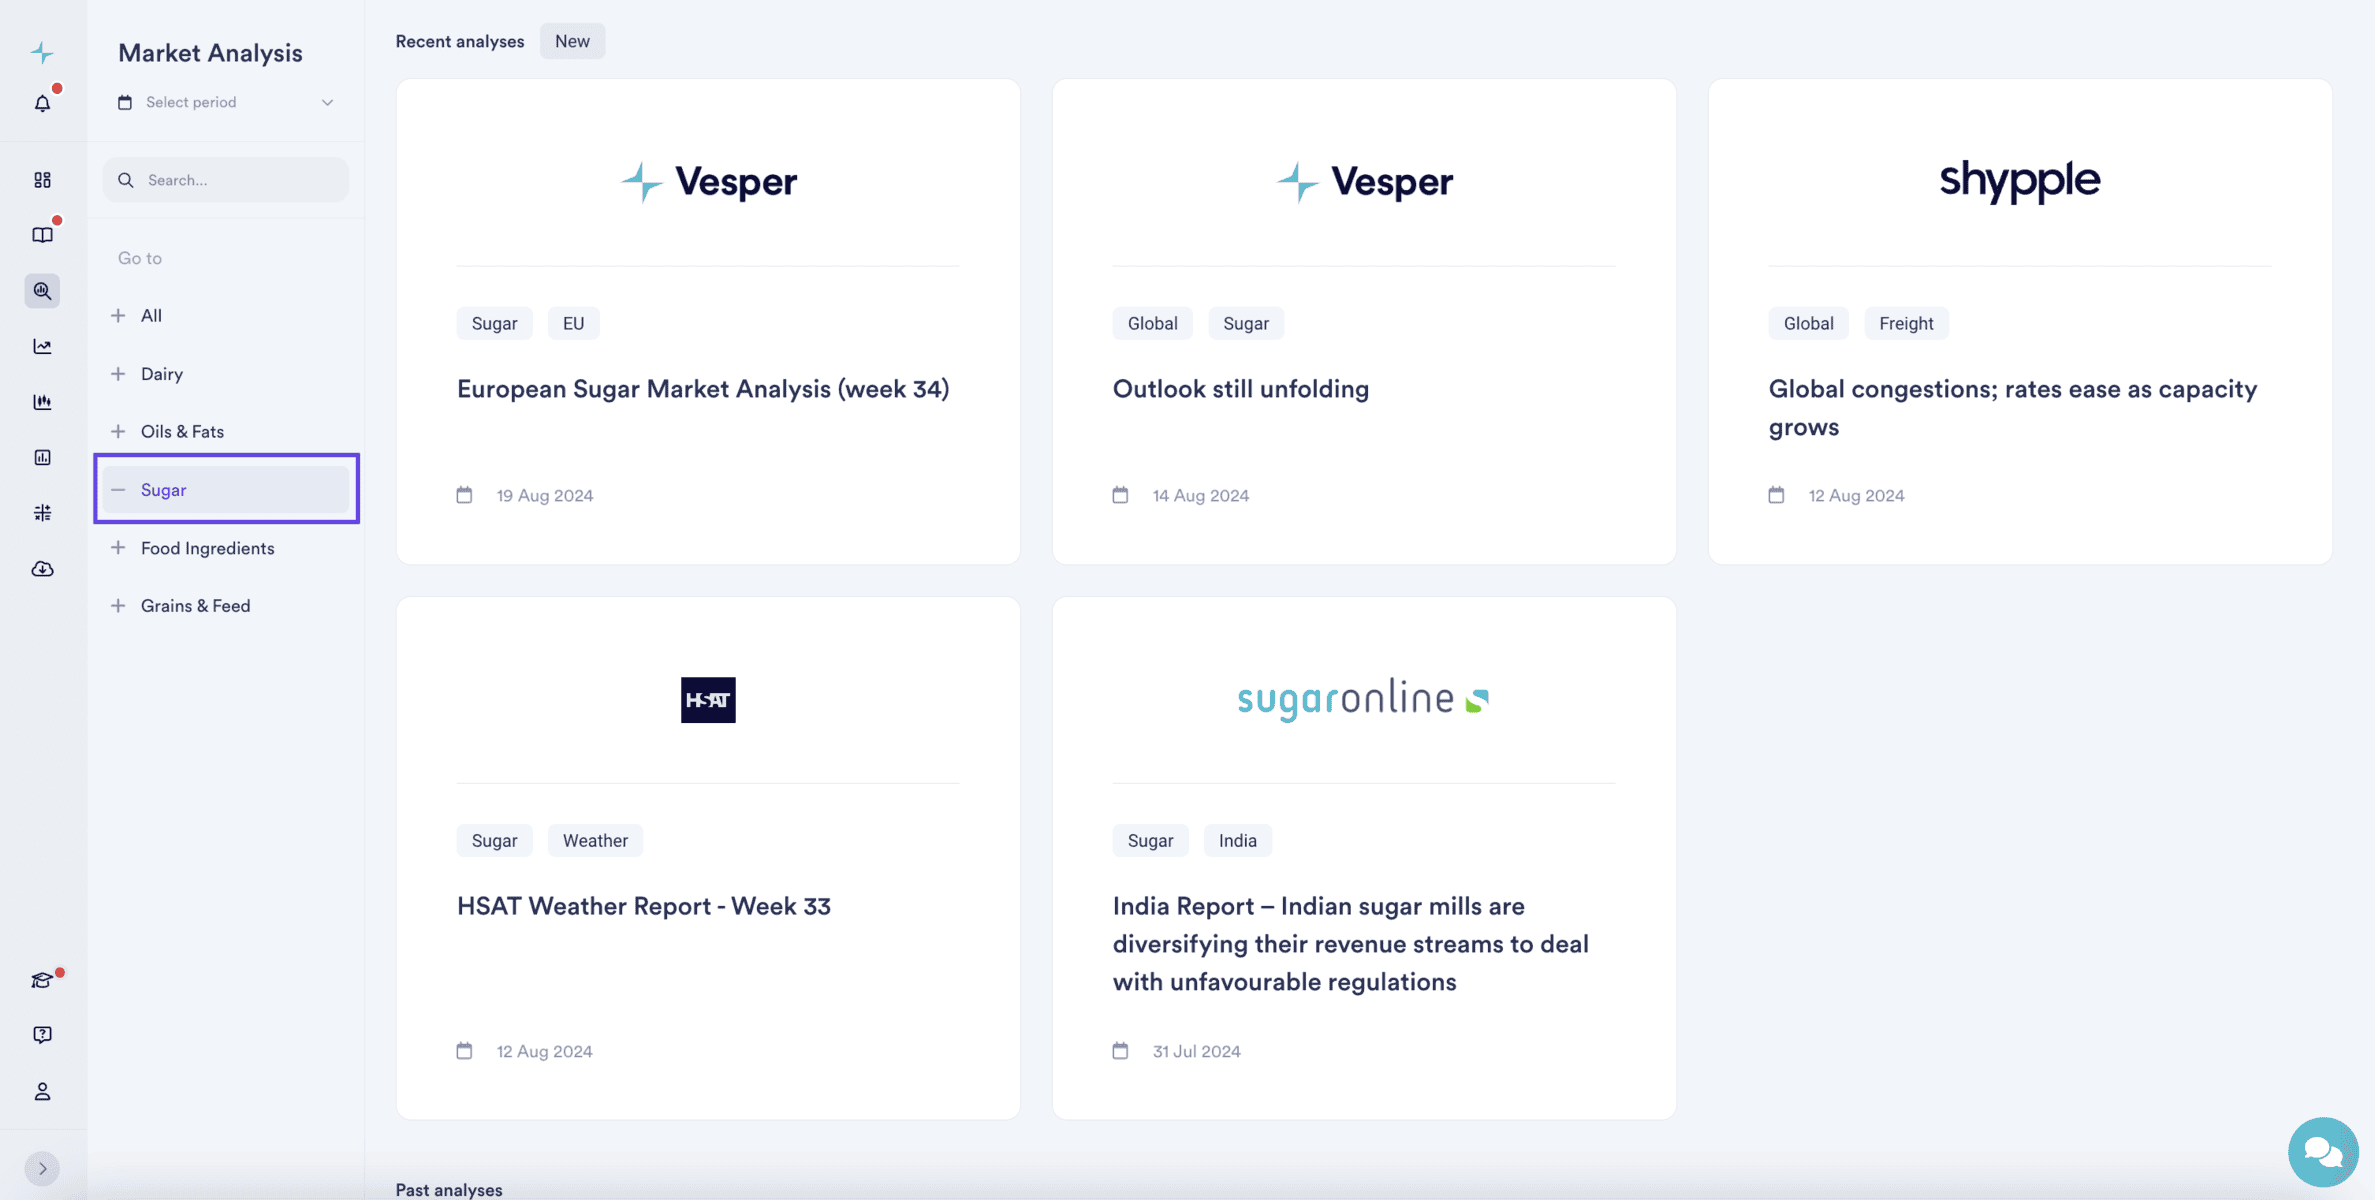
- Ready-Made Sugar Market Analyses: One of the biggest advantages of using a commodity intelligence platform like Vesper is that it doesn’t just provide you with raw data—it also does the heavy lifting of data analysis for you. This saves you significant time and effort, allowing you to focus on decision-making rather than sifting through complex datasets.Vesper includes a variety of market analyses created by in-house experts who are well-versed in the intricacies of the sugar market. These analyses offer deep insights into market trends, price forecasts, and potential risks, giving you a solid foundation for your strategic decisions.Additionally, Vesper provides access to market analyses from its partnerships with leading industry experts and platforms such as Sugaronline, Shypple, HSAT, and many more, see figure below. This collaborative approach ensures you’re getting a well-rounded perspective, incorporating different viewpoints and expertise. Whether you need insights into global freight trends, weather impacts on sugar production, or regional market developments, Vesper’s platform delivers comprehensive analyses that keep you ahead of the curve.
Conclusion
Incorporating a commodity intelligence platform like Vesper into your sugar market analysis offers a significant advantage. With its real-time data, customizable dashboard, interactive tools, and expert market analyses, commodity intelligence platforms simplify complex data, enabling you to make informed decisions quickly.
Related Content
Quickly navigate this page
Was this information useful?
Share: