Skim milk powder (SMP) and Non-Fat Dry Milk (NFDM) are often referred to as the most ‘commoditised’ products within the dairy landscape. They are characterised by simpler specifications compared to many other dairy ingredients and command significant volumes in global trade. This highly competitive market sees the US, Europe, and New Zealand, all of whom rely on securing sufficient export demand to maintain healthy domestic pricing levels. The US market, in particular, experienced a relatively subdued performance in 2023. After a decline from the high levels of January 2022, the highest since 2014, prices have predominantly fluctuated between the 1.10 - 1.20 $/Lb range throughout the year. Pricing has been a key driver of demand, with demand tapering off or shifting to other regions whenever prices approached or exceeded the 1.20 $ threshold, see Figure 1.
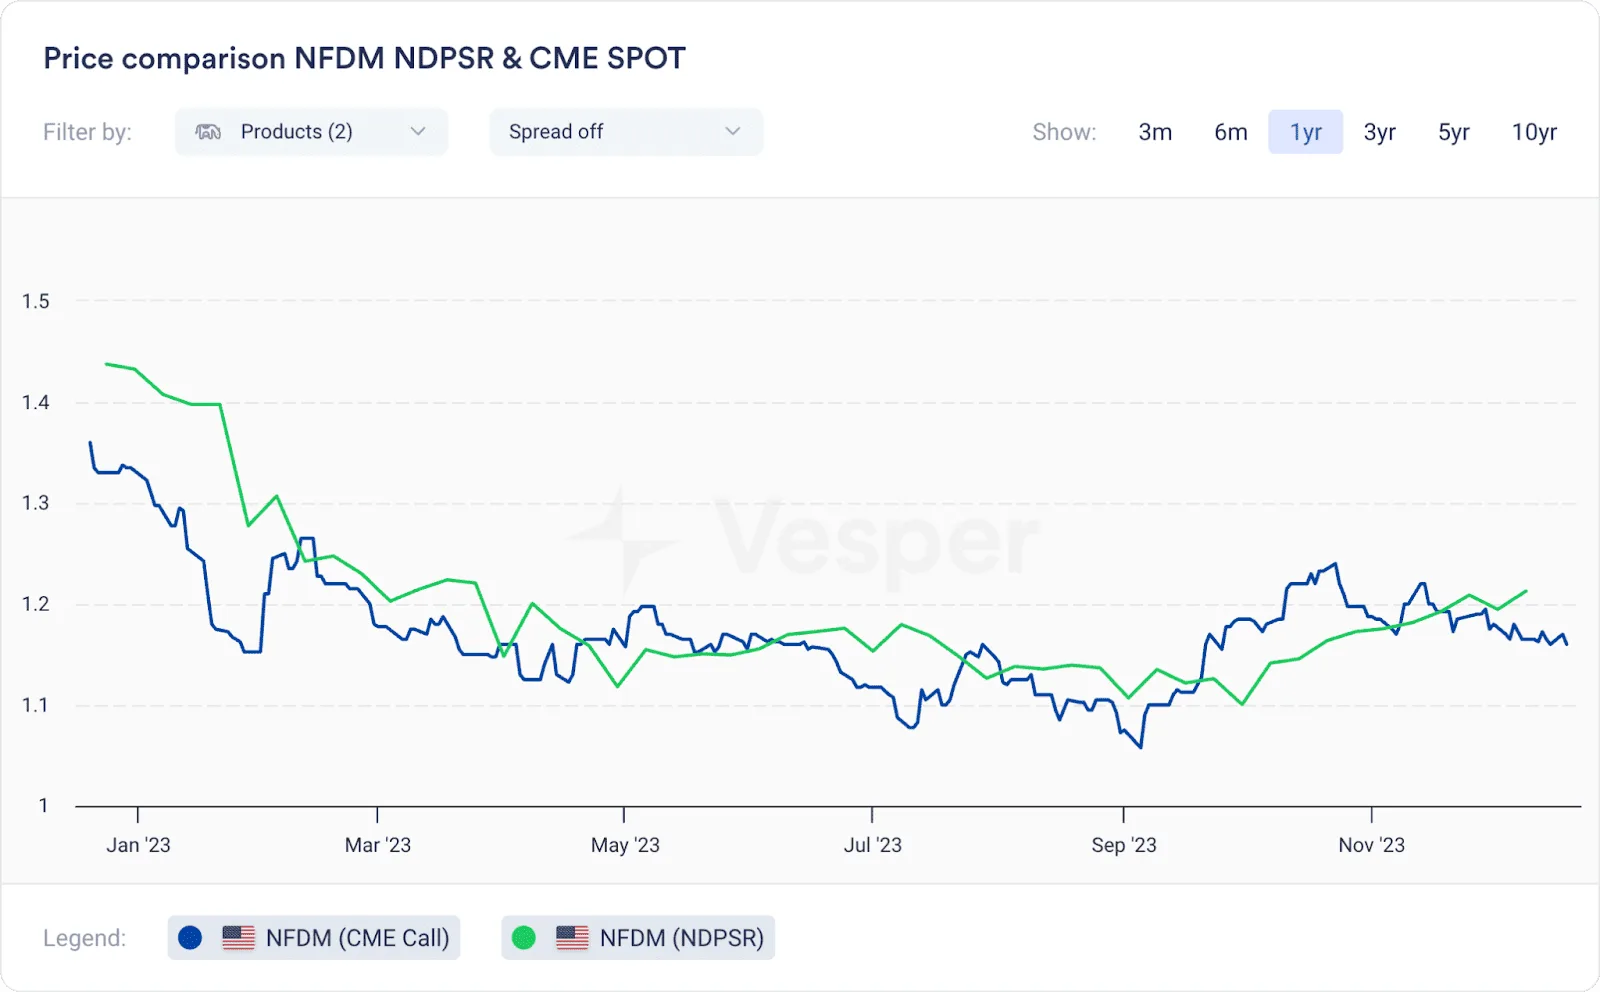
Figure 1: Price Comparison for NFDM NDPSR & CME Spot prices
This article aims to provide an outlook for the 2024 NFDM market of the US, offering fundamental background information and insights into the nuanced landscape the industry will (have to) navigate in 2024. We’ll cover the supply balance sheet with an overview of US and global milk production, NFDM & SMP production, and stock levels for key regions. Additionally, we’ll examine the potential effects of China’s changing production patterns and consider the effect on New Zealand’s product mix, which is critical for understanding future competitiveness.
How did the export volumes of SMP and NFDM from the US, the European Union, New Zealand, and China compare during the year 2023?
In the export market of SMP/NFDM, the US, the European Union, and New Zealand are the dominant players. Due to intense competition for global exports, prices between these regions are usually closely aligned. This is a direct result of the necessity to remain competitive in a market where exports can comprise up to two-thirds of the demand, with domestic consumption accounting for the remaining third in the US.
If we look at the export volumes and compare how these three key players have performed throughout 2023, it seems like the US export industry has lost out the most, with export figures showing red numbers for almost every country in the top 10 export countries (YoY YTD October). These figures ‘only’ led to a 3.42% decrease, largely due to a big increase in exports to Mexico. We see that the US has lost its competitiveness, specifically in Asia, see Figure 2.
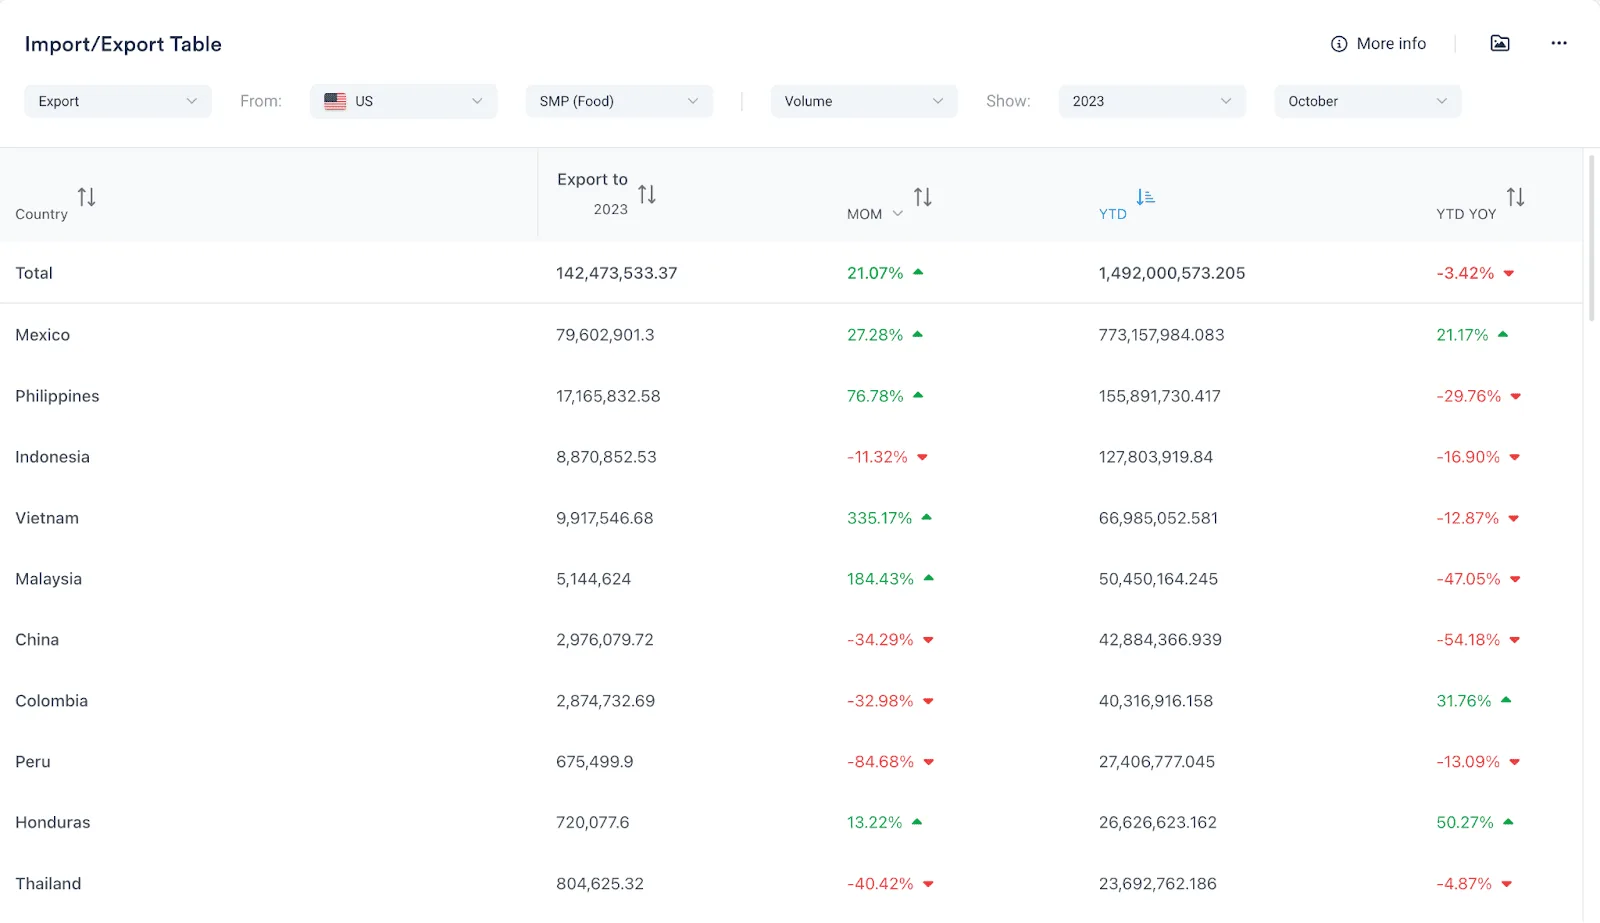
Figure 2: Import/Export table for the top 10 export countries of SMP (Food)
While this decrease coincides with subdued imports from the Southeast Asian region (-13.67% October), we still see an increase in SMP exports from NZ to the region, actively eating into market share that went to the US in prior years.
For China, the world’s largest importer of SMP/NFDM, we see a growth of 7,23% (YTD yoy -November) in SMP imports, while the US reports a decrease of 54.18% of SMP/NFDM exports to China (YTD yoy -October), see Figure 3. Again, figures indicate that New Zealand is taking over most of this market share. In November 2023, China’s imports of SMP (Food) from New Zealand amounted to 11,224 metric tonnes, constituting 48.60% of its total imports. This marked a 17.80% increase from the previous year, see Figure 4.
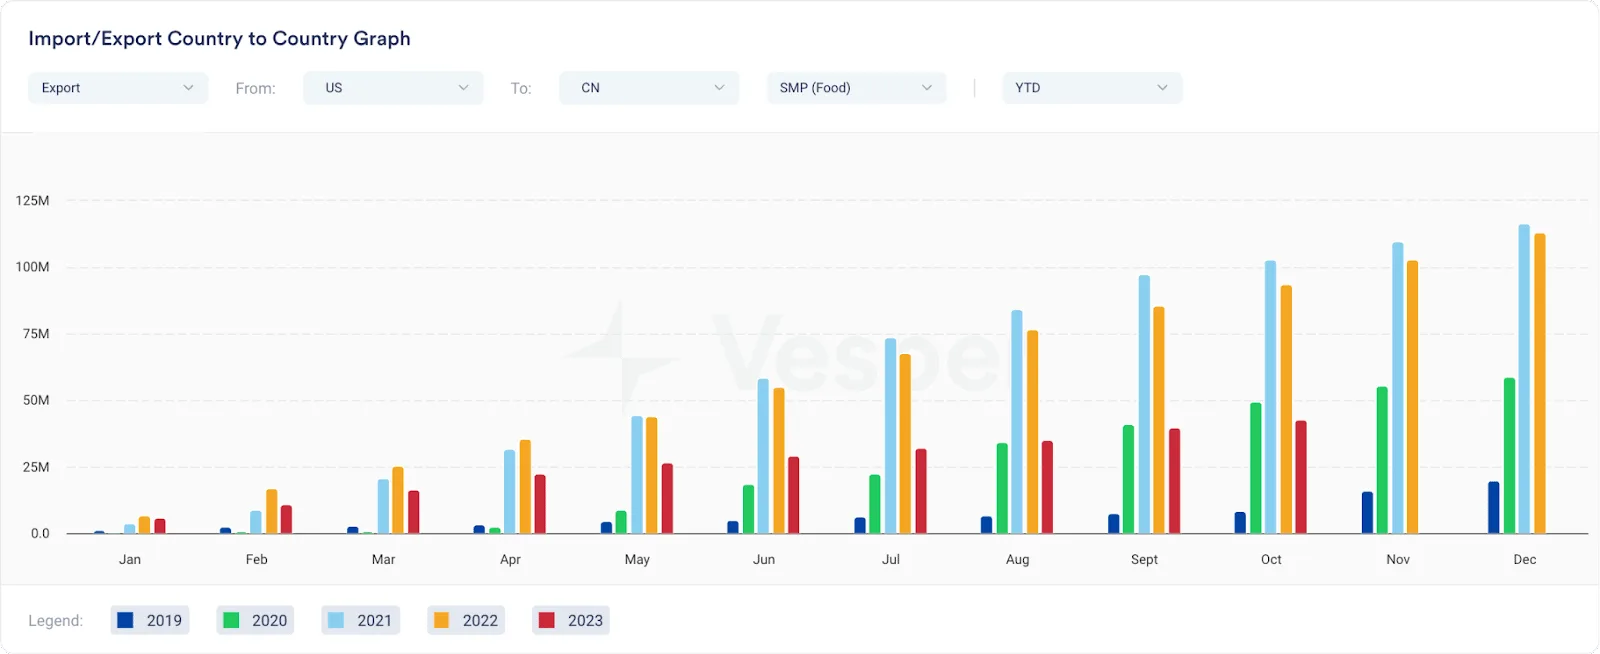
Figure 3: Export US China SMP (Food)
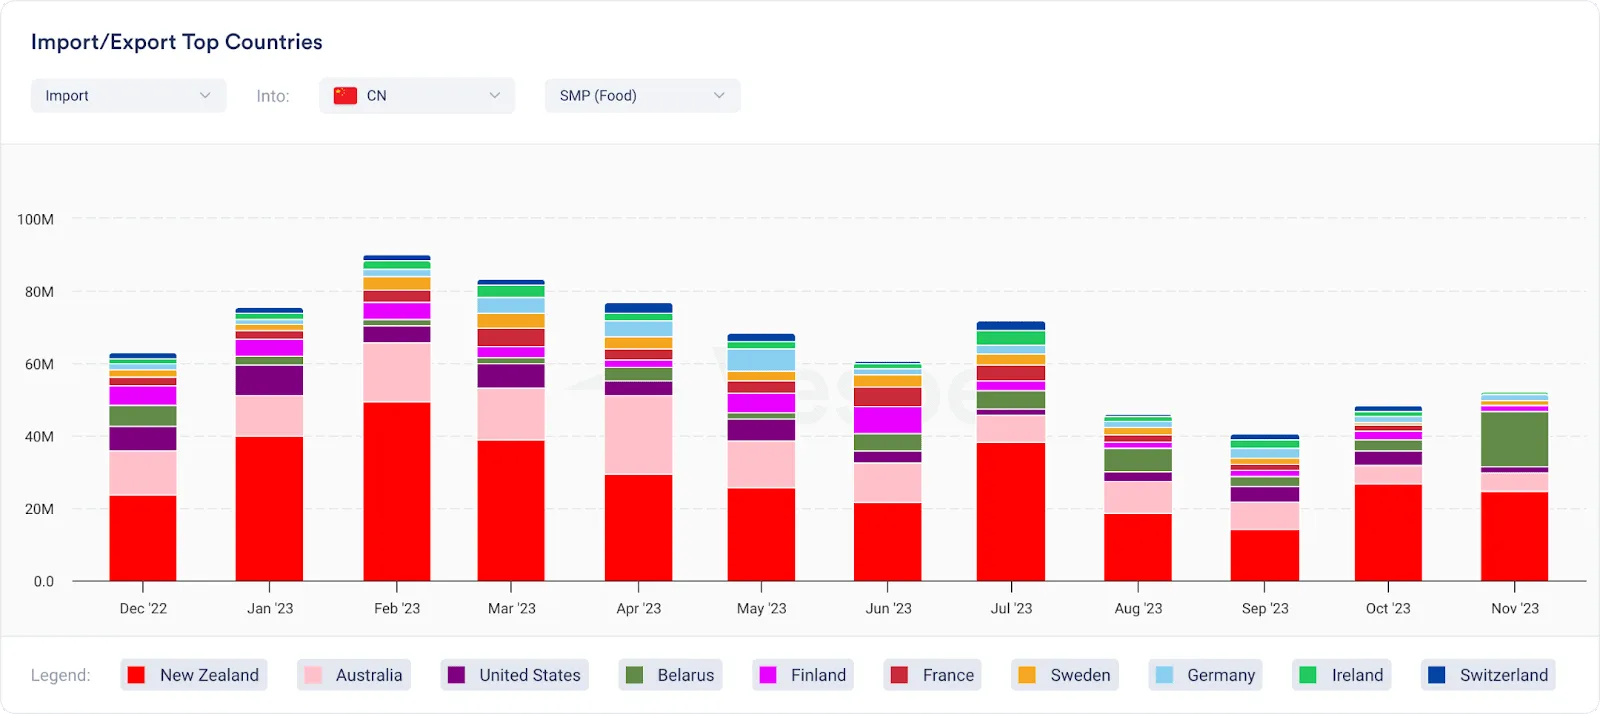
Figure 4: China SMP (Food) imports - Top 10 importing countries
Next, let’s explore the supply side of the market to comprehend the effect of these export trends on the United States.
How did milk production trends in the US during 2023 correlate with the changes in milk and feed prices?
Milk production in the US started 2023 off how 2022 had ended strong. The first months of the year showed strong YoY growth numbers, close to the very strong 2021 milk season. Despite this solid start of the season, we have seen an inevitable drop in production, as milk prices took a dive throughout the first months of the year, see Figure 5.
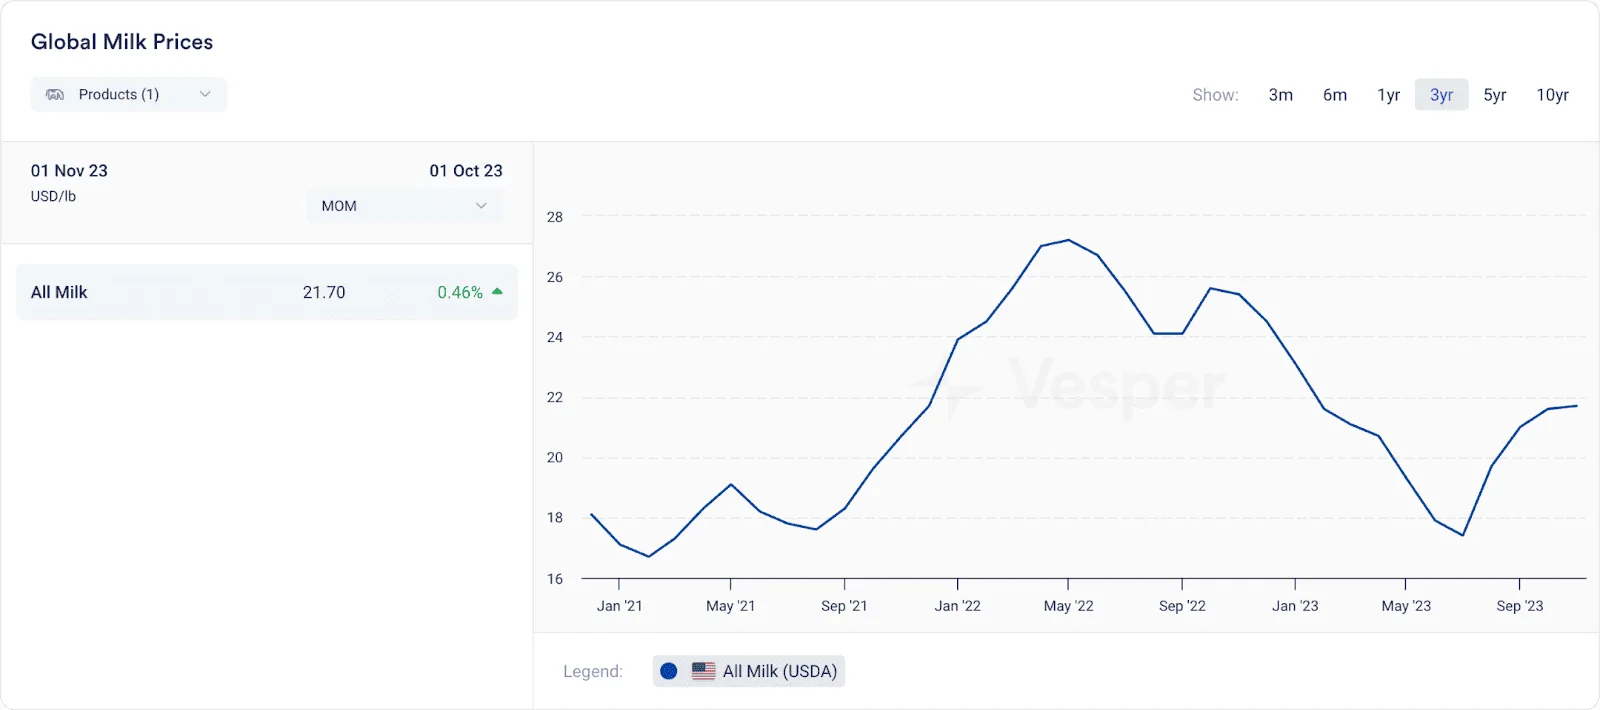
Figure 5: Milk price according to USDA (All Milk)
As milk prices declined in the first half of 2023, farmers faced reduced profitability. This was due to a narrowing margin between the cost of feed (their largest and most fluctuating expense) and the prices they received for milk - Feed Prices remained at historically high levels, while milk prices came down drastically. The first relief was in August after the margin between the two hit its lowest point in July 2023, see Figure 6.
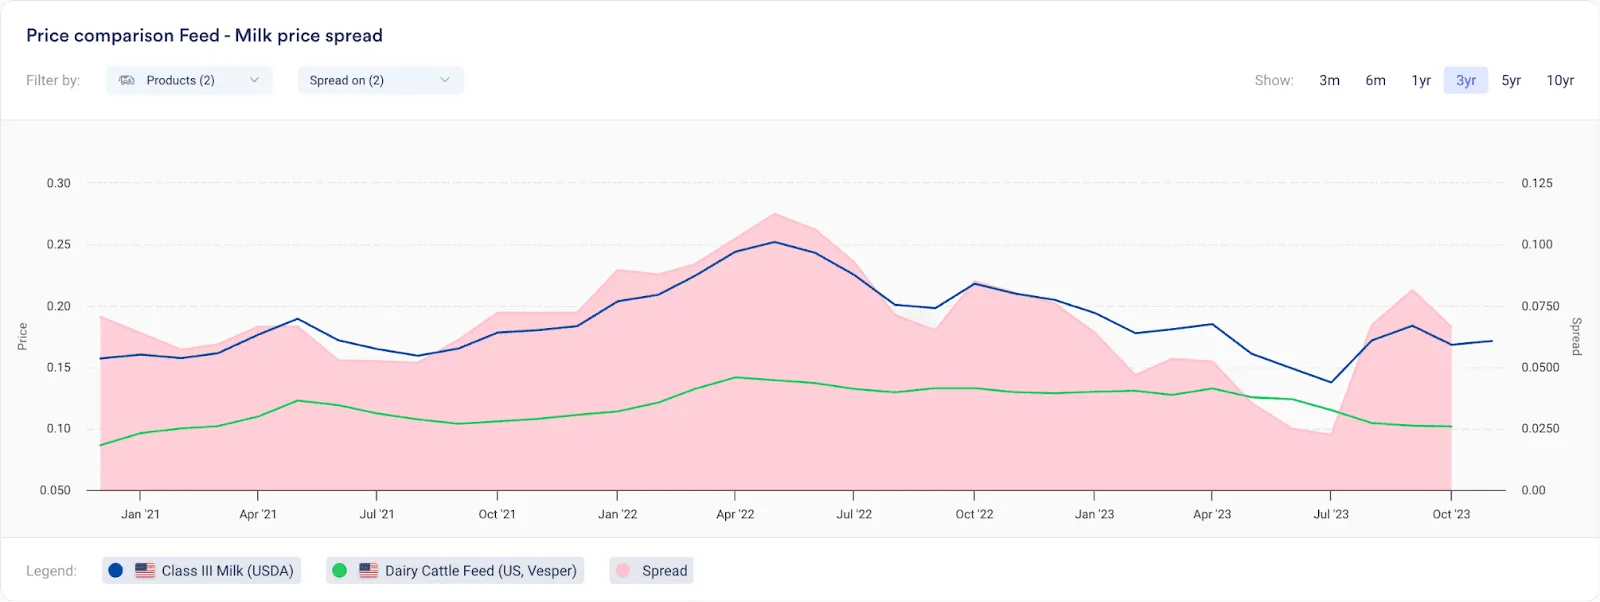
Figure 6: Price comparison between Class III Milk and Dairy Cattle Feed
Despite historically low margins squeezing farmer profitability, milk production remained resilient, exceeding 2022 levels. However, this national picture masks significant regional variations. The traditional cheese states in the Midwest thrived with 1.76% growth, while the West coast, which includes California, a NFDM-heavy region, struggled, experiencing a 1.5% decline in milk production, see Figure 7.
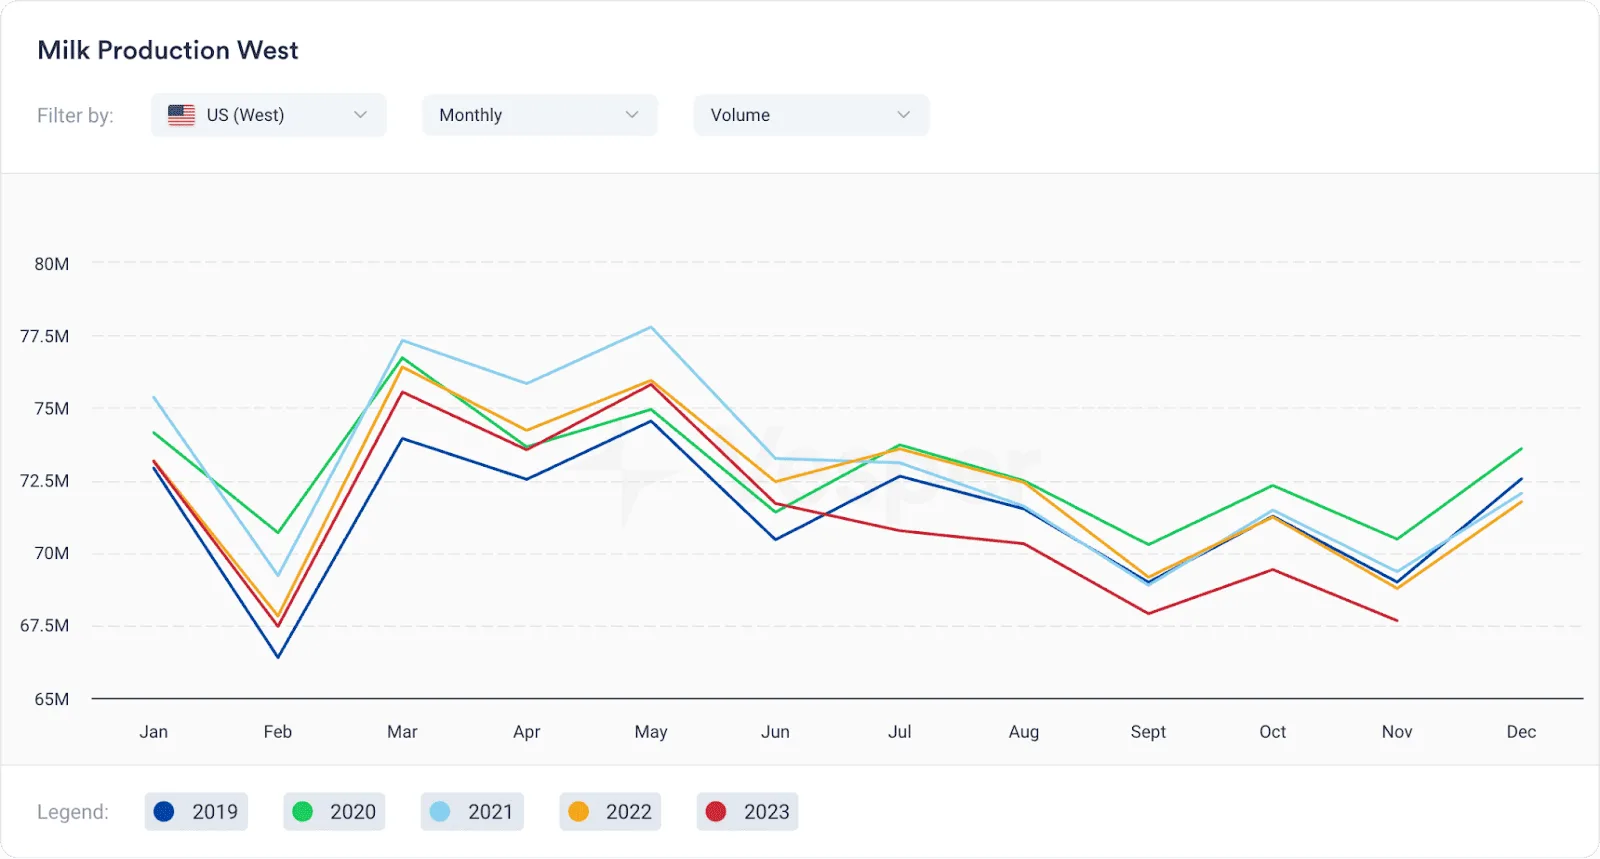
Figure 7: Milk Production in US (West)
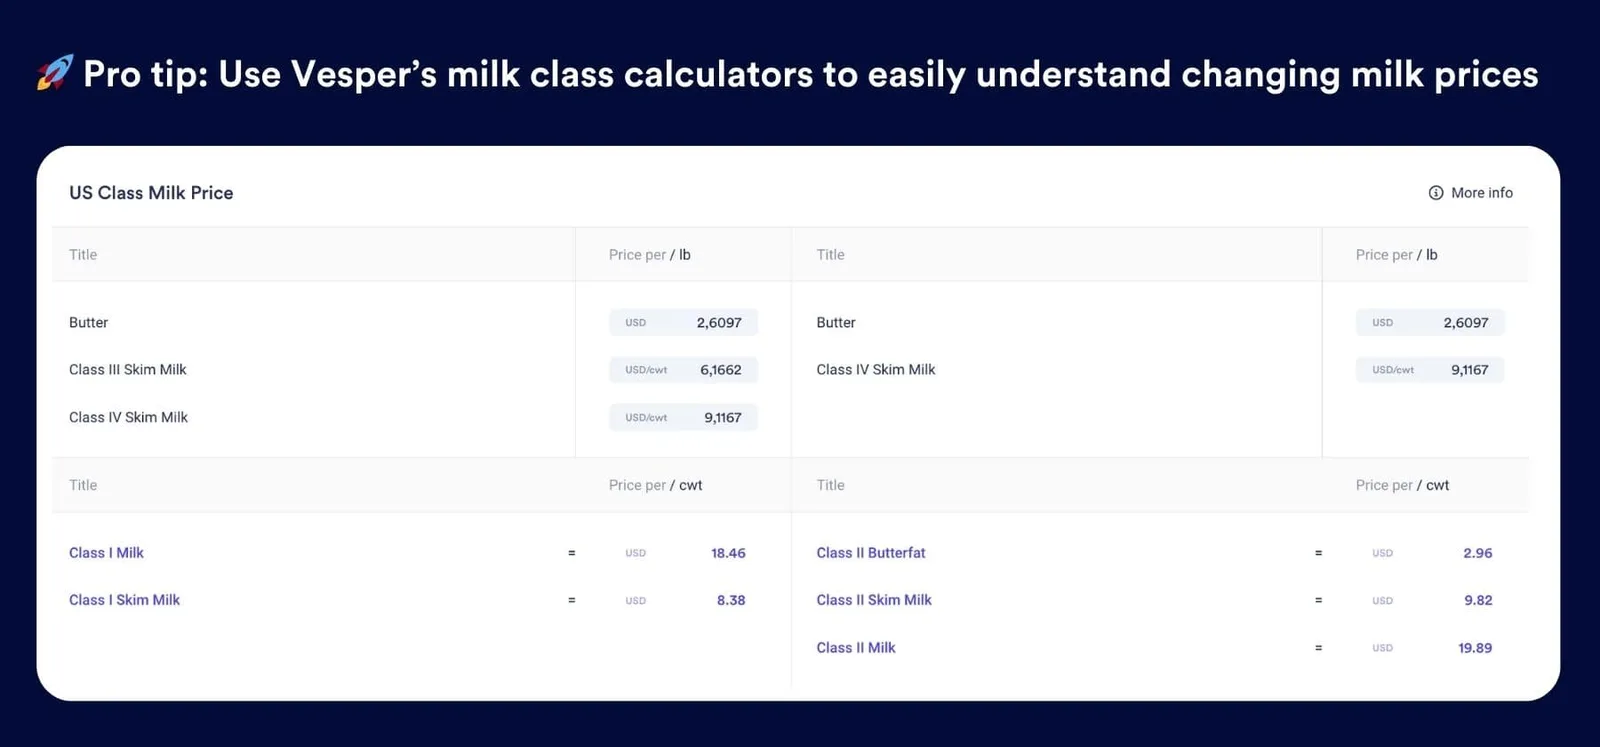
-> Explore our online calculators or start a free trial to unlock all calculations.
What was the effect of Milk Production levels on the production of NFDM in the US in 2023?
The effect of dragging milk supplies in the West can be clearly seen in NFDM + SMP production figures, see Figure 8.
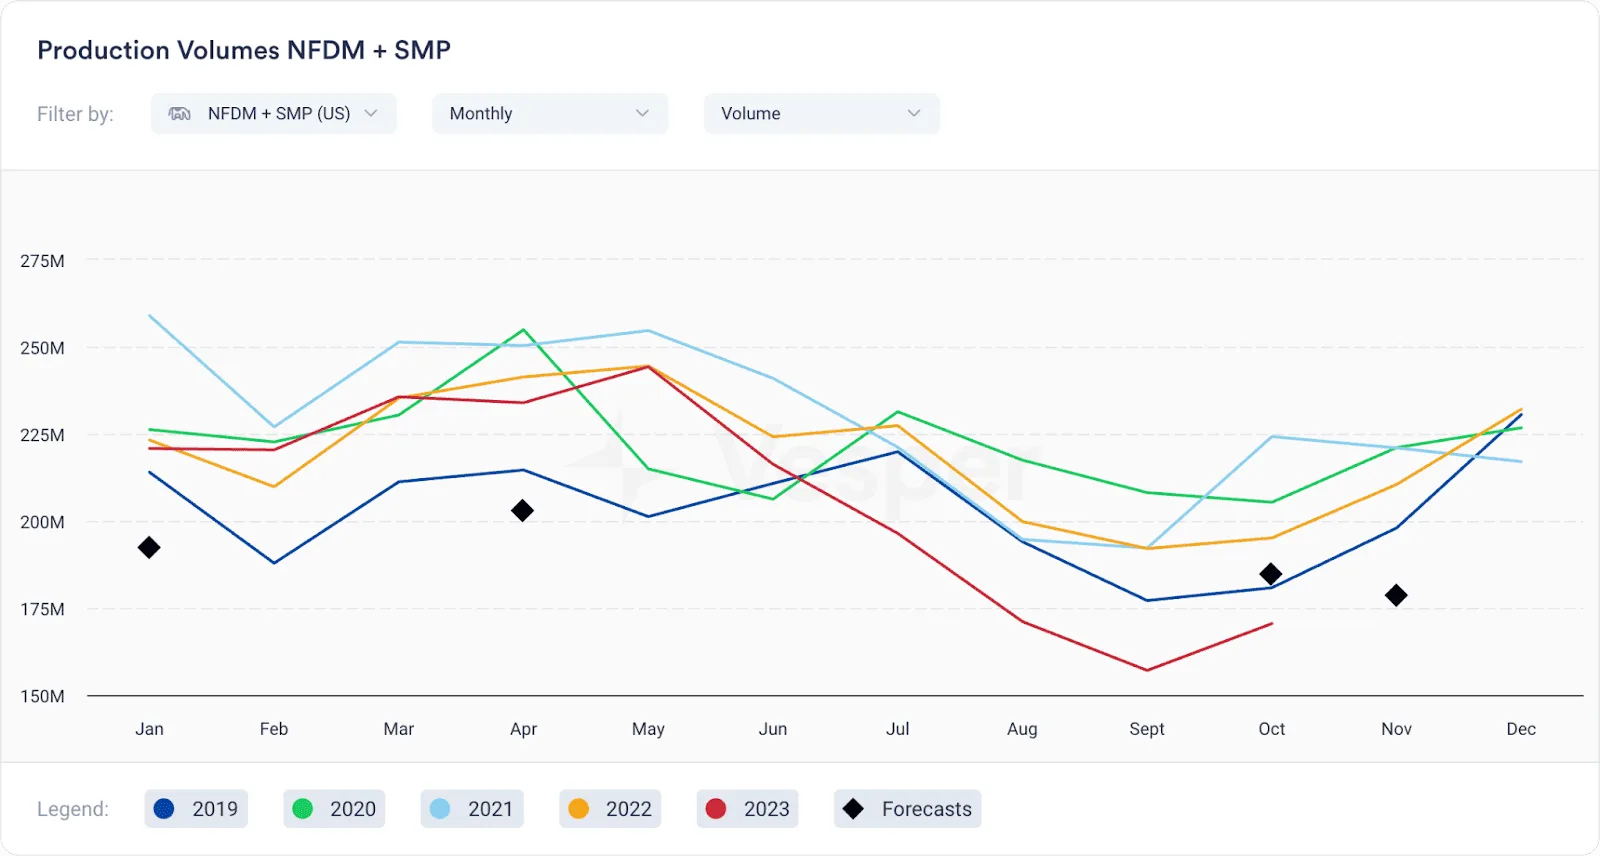
Figure 8: Production volumes of NFDM + SMP (US)
NFDM and SMP stock levels deviated from their usual seasonal pattern. Traditionally, the US milk season sees NFDM stocks climb. However, 2023 started with a modest January increase, followed by a decline throughout the year, see Figure 9.
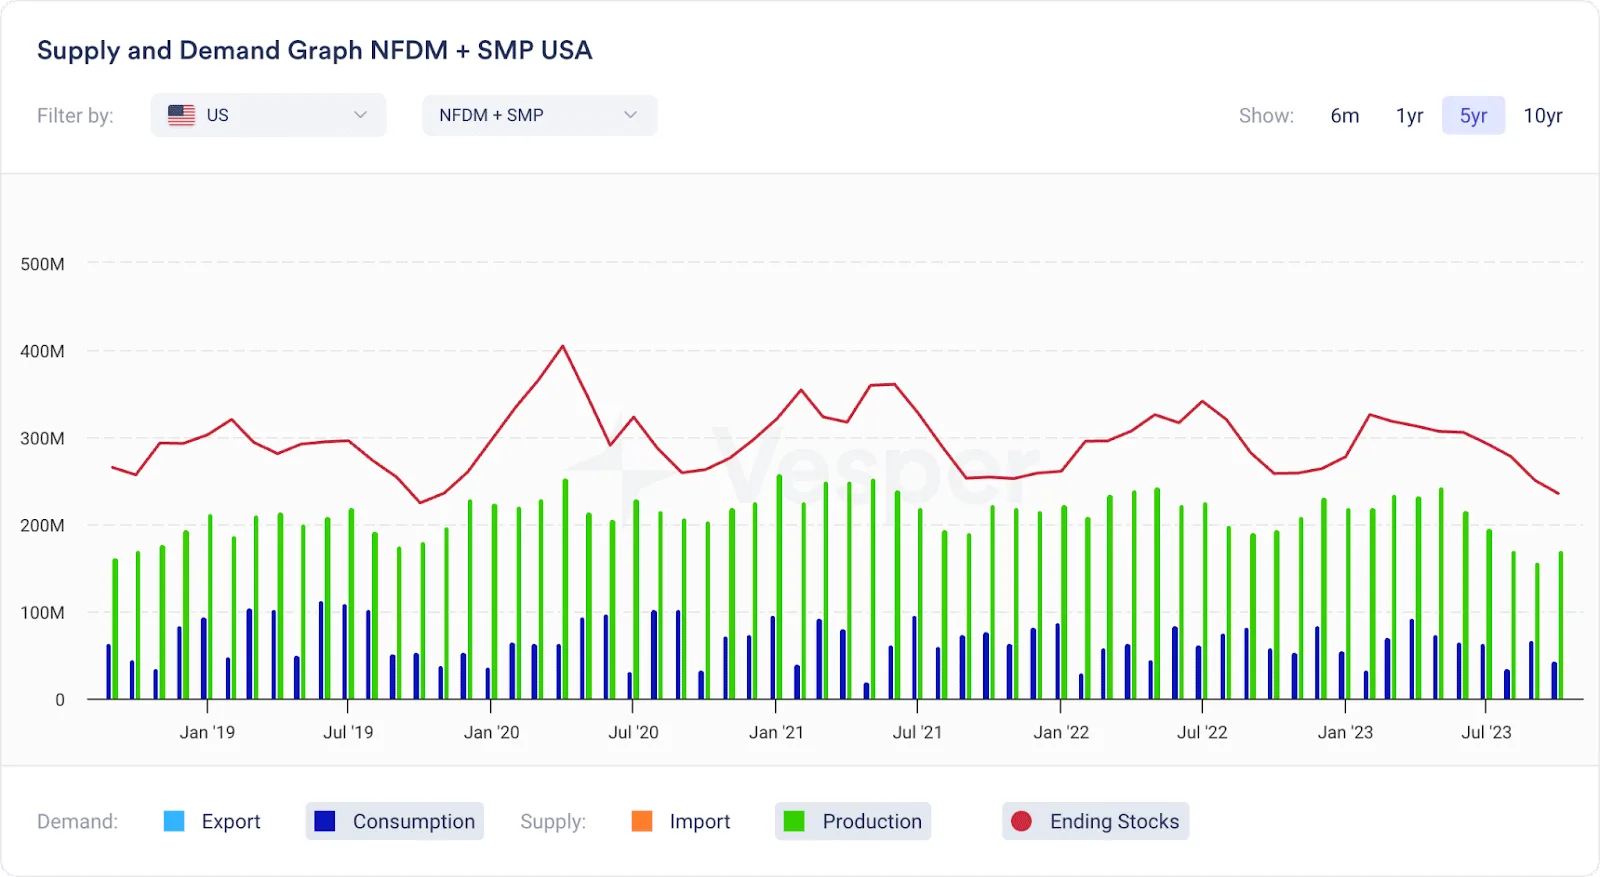
Figure 9: Supply and Demand NFDM + SMP (US)
The red line shows the declining monthly ending stocks, while the bars below illustrate domestic consumption versus production. This highlights the crucial role of exports for the US market.
What was the relationship between global supply and demand in the dairy industry in 2023?
Given the supply picture alone, one might expect a bullish sentiment. However, market reality tells a different story. Subdued prices and lagging exports hint at underlying demand challenges. To understand this disconnect, we need to delve deeper into the demand side, particularly the evolving situation in China.
While China aims for self-sufficiency in food production, including dairy, their journey is far from over. Despite commendable growth - with milk production up at least 8% annually over the past three years and 3.39% in the first 10 months of 2023 - Chinese dairy still has a long way to go, see Figure 10.
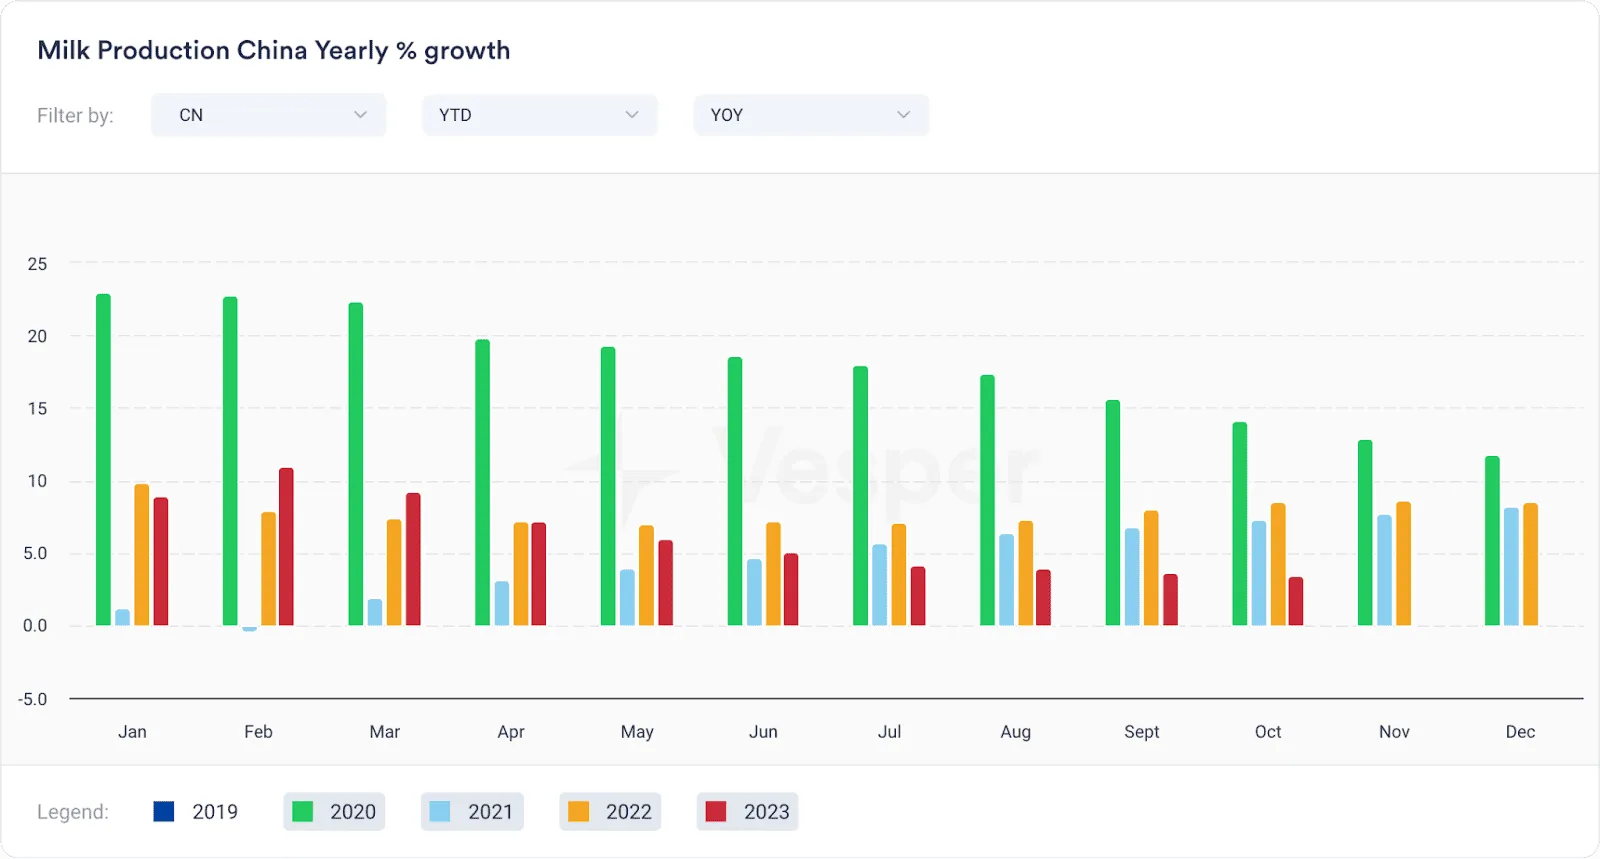
Figure 10: Milk Production China
Most of this additional milk is going towards WMP production. Following a 25.25% surge in 2022 compared to 2021’s decline, WMP output jumped another 13.2% in the first 10 months of 2023. This growth puts pressure on New Zealand’s traditional WMP export market. In response, NZ has shifted milk from WMP to SMP production, resulting in a remarkable 30% increase in SMP output by November 2023, see Figure 11.
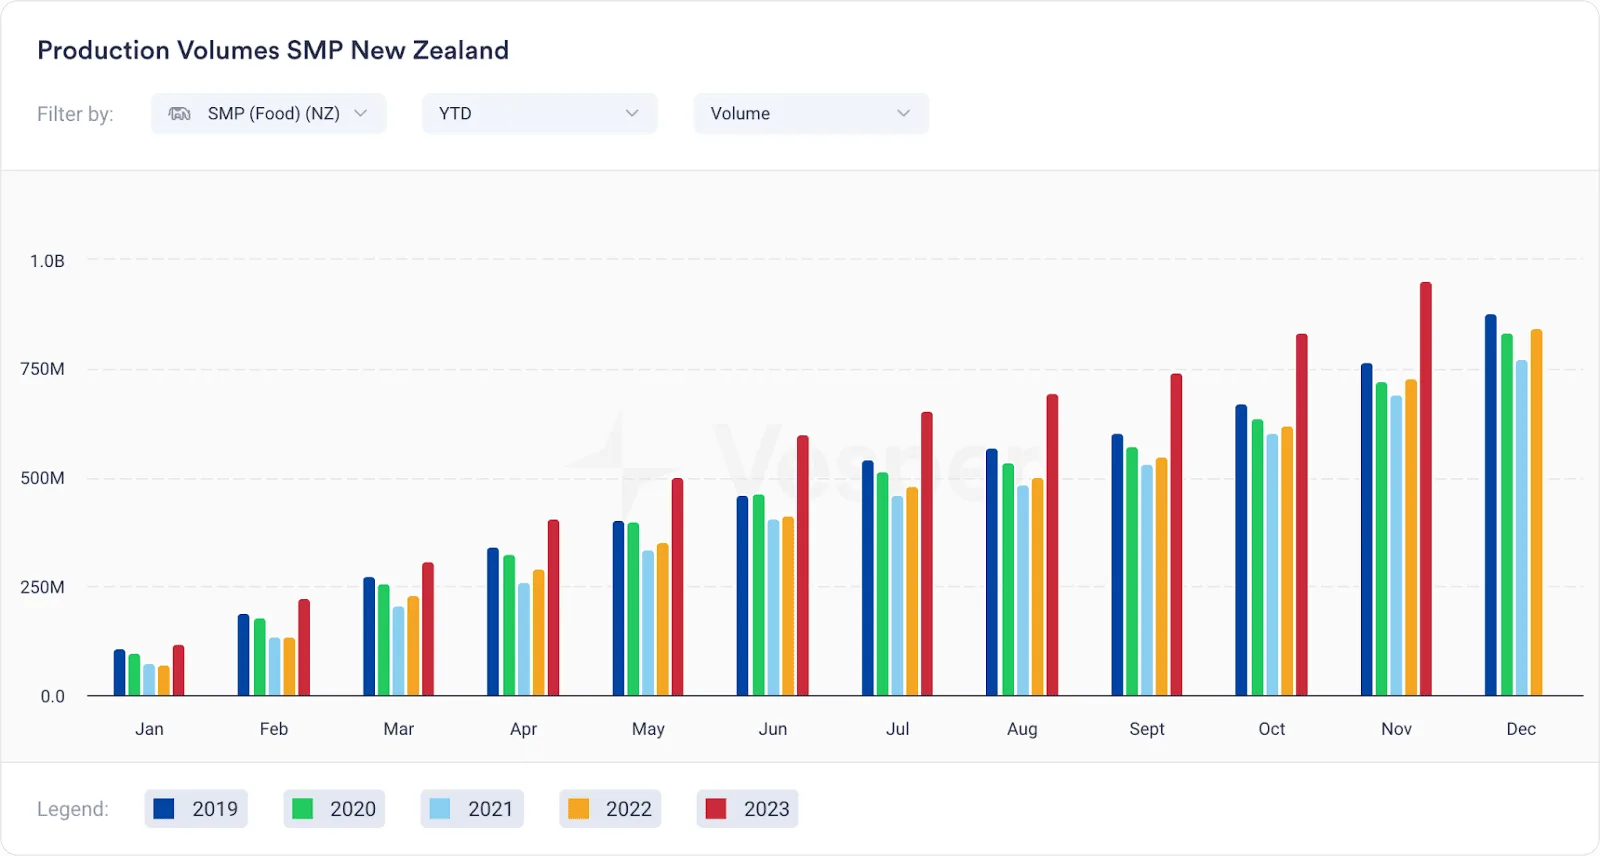
Figure 11: Production Volumes SMP New Zealand
New Zealand’s growing presence in SMP export markets poses a significant challenge for the US. Throughout 2021 and much of 2022, US NFDM (NDPSR) pricing held a clear advantage, offering significantly lower prices than those from New Zealand. However, the past year has seen a shift, with the price gap narrowing considerably, as represented by the pink area in Figure 12. Now, when the pink area dips above zero, it indicates that New Zealand’s prices are actually lower than NDPSR.
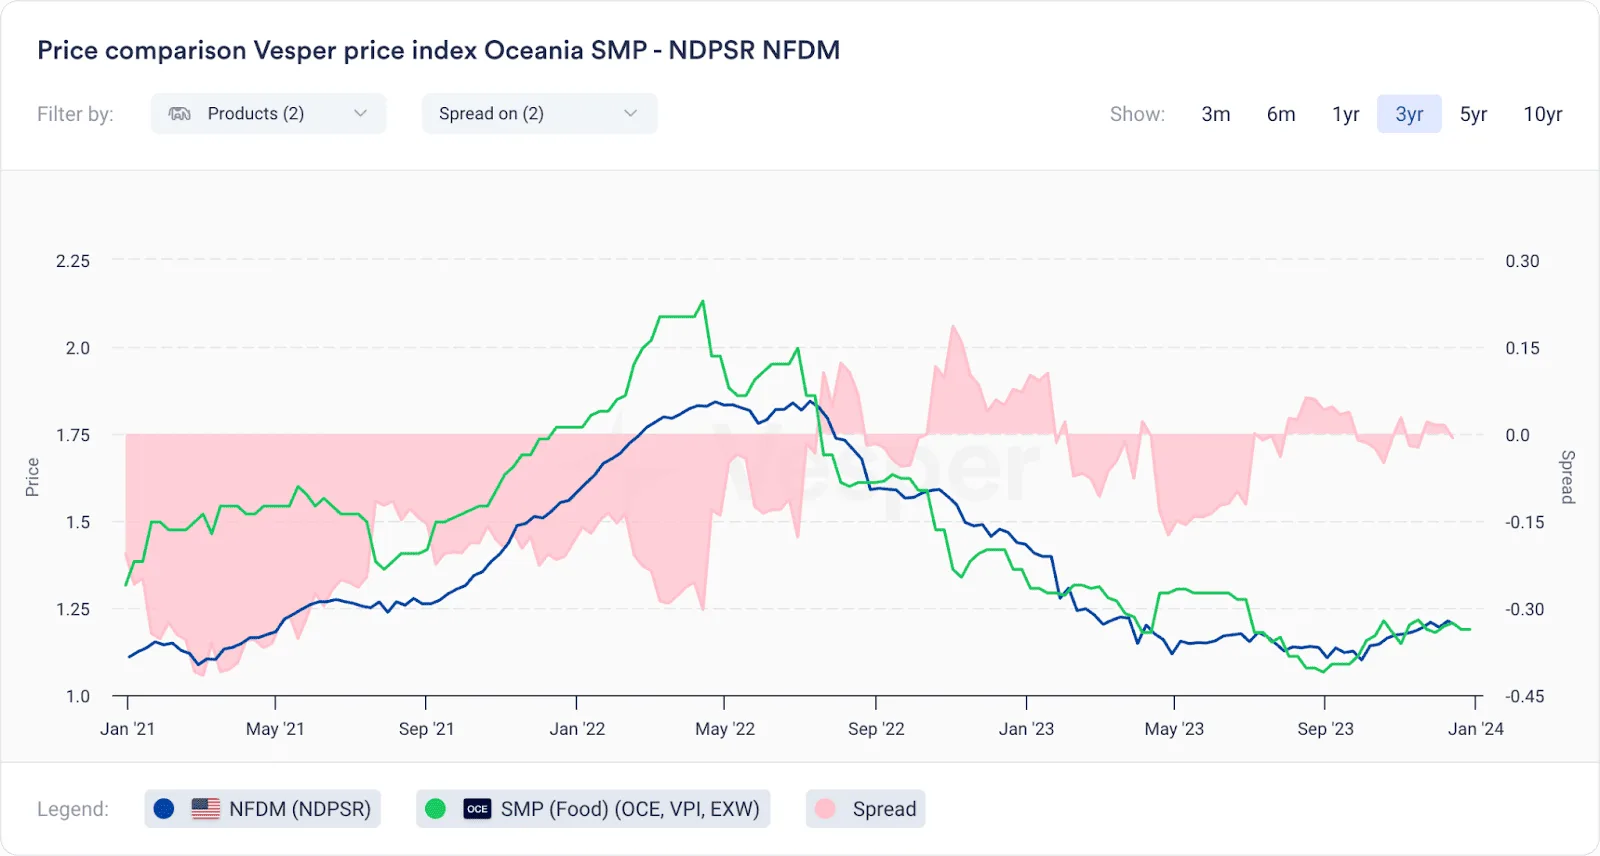
Figure 12: Price comparison between NFDM and SMP (Food)
While narrower price margins might suggest a more level playing field between US NFDM and New Zealand SMP, the reality is slightly more nuanced. Trade agreements and shipping costs often come into play, acting as invisible price adjusters. For instance, when price differences are minimal (hovering around zero), New Zealand’s favourable trade agreements and potentially lower shipping costs to certain regions can tip the scales in their favor, making their product more attractive despite seemingly comparable pricing. This adds another challenge for US NFDM exporters battling for market share in a close-knit global market. A great example is China, where US exports need to add 10% import tariffs, and New Zealand’s expanded free trade agreement will allow them to import without duties as per 01-01-24. *All import tariffs can be easily found in Vesper’s help and support section.
Another important trend to monitor is the significant increaase in demand from Mexico for products from the US. While the US dairy industry has benefited from a 21.17% increase in SMP and NFDM exports to Mexico (year-to-date as of October), see Figure 13, it’s expected that this rise may revert to more regular levels once prices stabilise or if Mexican stock levels are filled sufficiently.
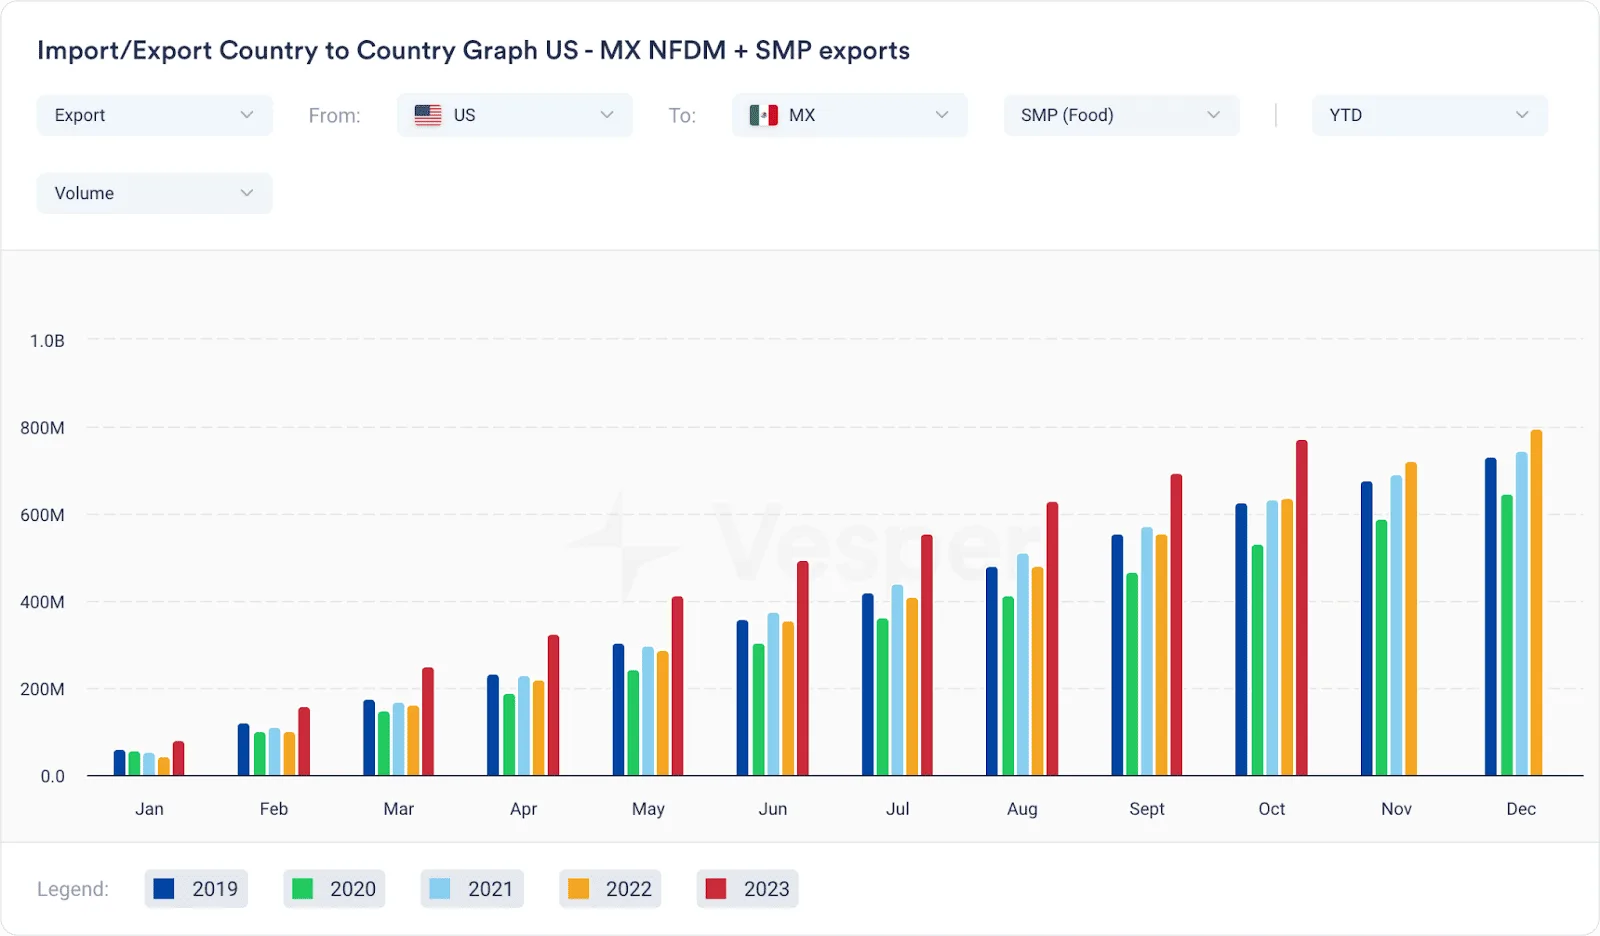
Figure 13: SMP Exports from US to Mexico
Conclusion
With NFDM and SMP being highly competitive bulk dairy ingredients traded globally, China’s rising milk production and therefore increased WMP production has significantly impacted the market. New Zealand’s shift to more SMP production has intensified competition for US exporters of NFDM, particularly in Southeast Asia, a historically key market that has seen the steepest decline in demand due to overall import reduction and New Zealand’s growing market share.
Despite declining milk production in the West. Ultimately, whether global demand can push NFDM prices upward remains to be seen, and careful monitoring of relative price trends with New Zealand and Europe is crucial for US exporters. Sustained pressure from these competitors necessitate staying ahead of the competitive curve and adapting to market shifts.
Download our Global Dairy Market End of Year Report 2023, in which we reflect on past trends, current prices dynamics, and the future outlook of the dairy market.