
Introduction
In the ever-shifting sands of the commodity markets, insights are not just valuable – they are the bedrock of successful trading. Welcome to the world of commodity insights, where understanding the nuances of the market is akin to holding a key to untold treasures.
In this blog, we dive deep into the heart of commodity trading, exploring various facets that every trader, buyer, and seller should be keenly aware of.
From the rhythm of price benchmarking to the subtleties of market drivers, from the strategic implications of shipping costs to the revealing trends of retail consumption, and from the intricate dance of currency fluctuations to the vital pulse of production data – we uncover it all.
This journey is designed to equip you with the insights necessary to not just navigate but thrive in the dynamic world of commodities.
- Uncover Insights with Commodity Price Benchmarking
- Discover What Drives Commodity Prices
- Master Price Comparison in Commodity Markets
- Analyse Retail Consumption Trends in Commodities
- Navigate Currency Fluctuations in Commodity Trading
- Interpret Production Data for Commodity Insights
- Leverage Supply and Demand Analytics in Commodities
1. Uncover Insights with Commodity Price Benchmarking
Having access to a commodity price index for benchmarking is crucial for market players.
Why, you ask? It’s simple:
What’s the Current Market Rate? Benchmarking provides current prices. This is like the heartbeat of the commodity market. You know exactly where you stand.
How Have Prices Changed? Historical data gives perspective. Trends over time reveal more than just numbers. They tell a story of supply, demand, and market shifts.
What’s the Future Outlook? Forecasts offer a glimpse ahead. It’s about anticipating changes, not just reacting to them.
Now, let’s talk about using this insight EFFECTIVELY.
Imagine you’re using a platform like Vesper. You see a dashboard filled with the latest commodity prices. It’s more than data; it’s a decision-making tool.
- Today’s prices: Instant insight into current market conditions.
- Historical data: A timeline of price changes, revealing patterns.
- Forecasts: Predictive analytics guiding your next move.
These aren’t just numbers. They’re a language. Understanding this language gives you an EDGE in negotiations, planning, and strategy.
And the best part? You don’t need to be a data scientist. Platforms like Vesper translate complex data into understandable insights.
For example, look at this screenshot.
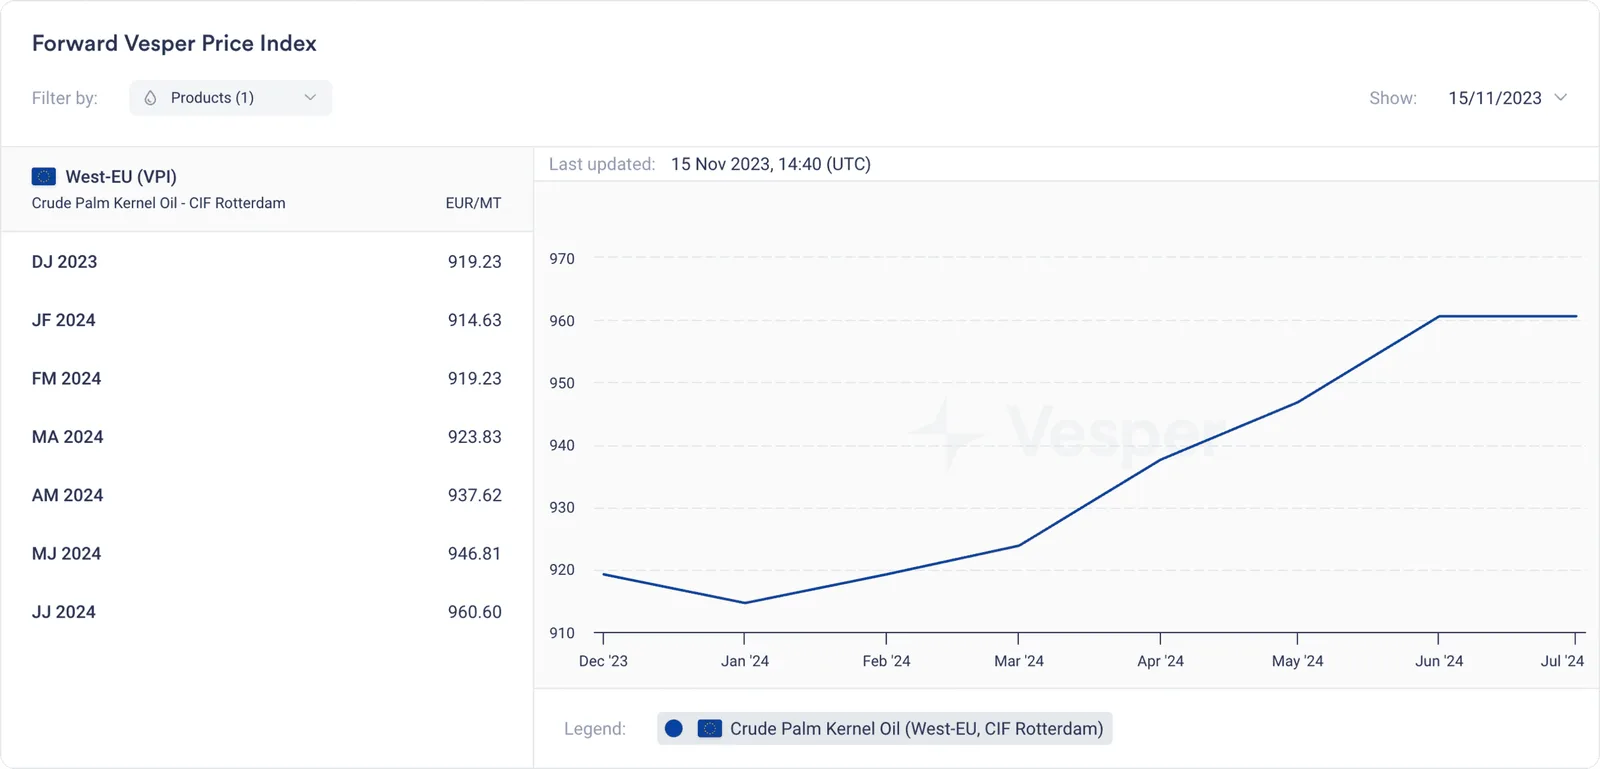
It displays benchmarked Crude Palm Kernel Oil prices projected for the upcoming months in 2024. You’ll notice a consistent upward trend in the prices. This isn’t just a pattern; it’s a signal. As the price steadily increases, it might be time to rethink your strategies for procurement or investment.
Commodity price benchmarking isn’t just helpful; it’s indispensable in a world where prices fluctuate constantly. By leveraging this tool, you stay informed, adaptable, and one step ahead in the market.
2. Discover What Drives Commodity Prices
Discovering what drives commodity prices is key to market success.
Let’s break it down:
Market Sentiment Is the market feeling bullish or bearish? This sentiment sets the tone. It’s like the market’s mood, influencing buyer and seller behavior.
Price Levels High? Low? Normal? Knowing this helps you gauge market stability and potential shifts.
Demand and Supply Dynamics It’s the classic equation. Bullish demand? Strong supply? These forces shape prices like clay.
Stock Levels A surplus or shortage? Stock levels can turn the market tide in an instant.
Futures Market Outlook What’s the future saying? This insight is like a compass pointing to tomorrow’s trends.
AI Forecast Up, down, stable? AI predictions are your crystal ball into future price movements.
Valorization How much value is the market placing on a commodity? This metric is a key indicator of market health.
Indicators Favorable, neutral, unfavorable – these are the signs that guide market navigators.
Now, imagine seeing all this in one glance.
Take this screenshot, for example:
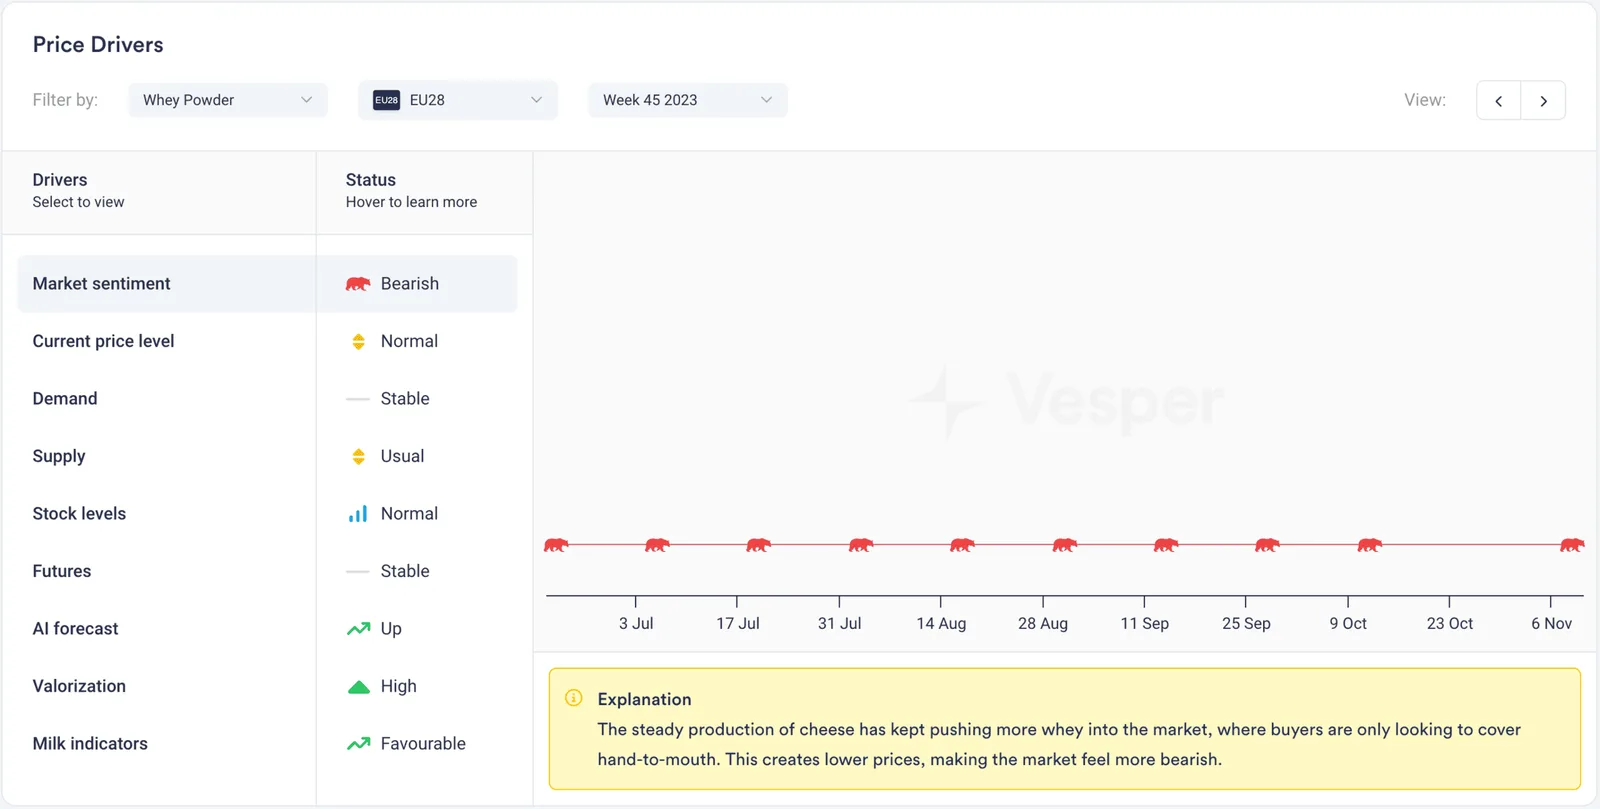
It shows the market sentiment in the EU28 for whey powder – bearish. That’s not just a word. It’s a summary of complex market dynamics, indicating that prices might decline.
This isn’t about just reading data. It’s about interpreting it, understanding the story it tells. A bearish sentiment could mean cautious buying, strategic selling, or exploring alternative markets.
Platforms like Vesper don’t just show numbers; they provide a narrative. A narrative that empowers you to make decisions not on a hunch, but backed by solid, multifaceted insights.
Understanding what drives commodity prices isn’t just useful. It’s essential in navigating the complex and often unpredictable waters of commodity markets. With these insights, you’re not just following the market – you’re staying ahead of it.
3. Evaluate the Impact of Shipping Costs on Commodities
Evaluating the impact of shipping costs on commodities is a vital aspect of global trade.
Here’s a broader view:
Global Market Connectivity Shipping connects markets worldwide. Changes in shipping costs can alter the competitive landscape, making some commodities more or less viable in certain markets.
Cost Pass-Through High shipping rates often trickle down the supply chain. This means consumers may end up paying more for commodities, affecting demand and market dynamics.
Commodity Price Volatility Shipping costs can add a layer of unpredictability to commodity prices. Unexpected spikes in transport costs can disrupt budget forecasts and market stability.
Supply Chain Efficiency Efficient shipping means lower costs, better pricing, and improved market competitiveness for commodities.
Now, let’s dive into a specific example.
Look at this widget:
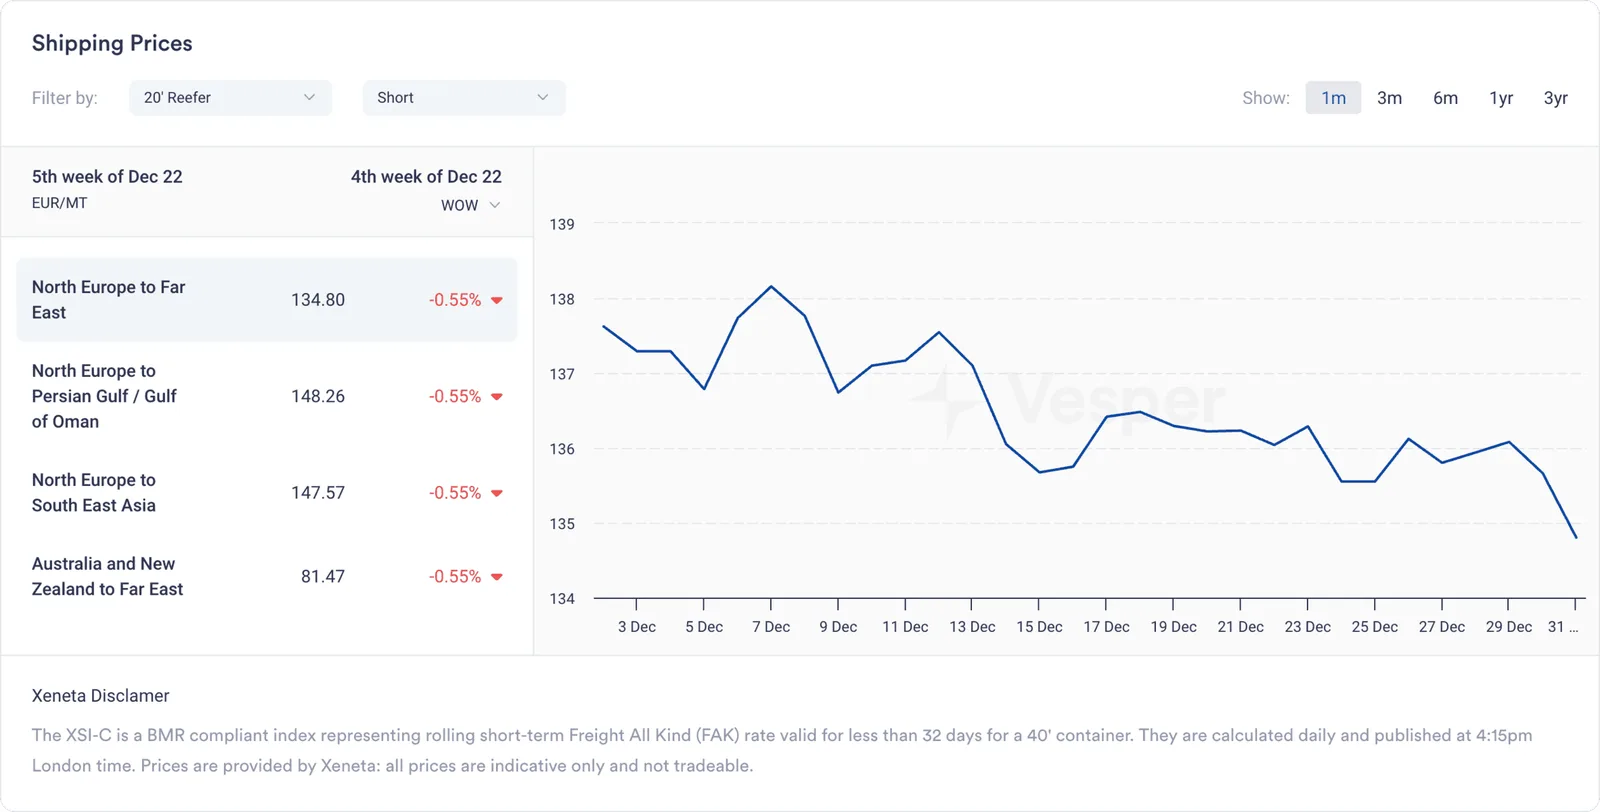
It shows shipping prices in €/FEU, tailored to specific container types and contract durations.
This detailed breakdown provides a clear view of how transport prices per metric tonne vary depending on container type – be it a 20’ Reefer, a 40’ Reefer, or a 40’ Standard Dry. Each type, suited for different commodities, has its own cost implications.
Moreover, the choice between short and long-term contracts can significantly influence overall shipping costs. A short-term contract might offer flexibility but at a higher price, whereas a long-term contract could provide cost stability.
Understanding these specifics is crucial, but it’s also important to see the bigger picture. High transport costs can potentially shift trade routes, influence commodity sourcing decisions, and even reshape global supply chains.
In summary, shipping costs are more than just a logistical concern; they are a strategic element in commodity trading and market positioning. Whether you’re a small trader or a large corporation, a keen understanding of these costs is essential for maintaining competitiveness and profitability in the ever-evolving commodities market.
4. Analyse Retail Consumption Trends in Commodities
Understanding the impact of retail consumption on commodities is pivotal.
Here’s a detailed look:
Tracking Consumption Over Time Observing changes in retail consumption provides a lens into market trends and consumer behavior.
Volume Fluctuations: Indicators of Market Health Increases or decreases in consumption volumes can signal shifts in demand, potentially affecting commodity prices and production strategies.
Yearly Comparisons: A Story of Market Evolution Analyzing consumption data over several years offers insights into long-term trends and market adjustments.
Now, let’s apply these concepts with a real example.
Consider this screenshot:
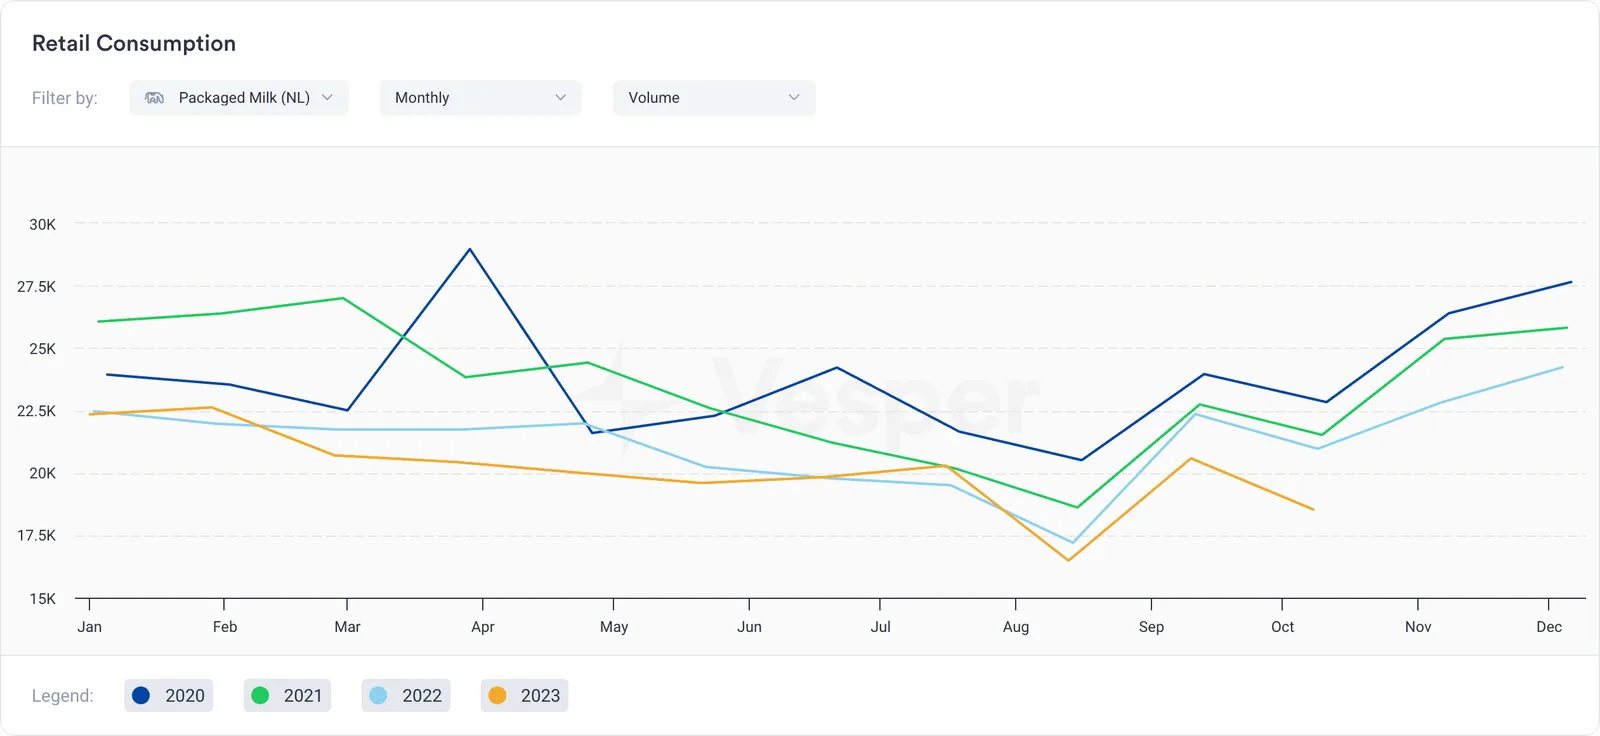
It details retail consumption in metric tons for packaged milk in The Netherlands, covering the past four years (2020 - 2023).
What stands out is the trend: In 2023, the volume is at its lowest. This isn’t just a statistic; it’s a crucial market insight. A decline in consumption could point to various factors - changing consumer preferences, increased competition, or even broader economic conditions.
This trend can influence numerous decisions in the commodity market. For producers and traders of dairy products, it could mean reevaluating production levels, adjusting marketing strategies, or exploring new markets. For retailers, this might indicate the need to diversify product offerings or revise pricing strategies.
Moreover, this data can serve as a benchmark for other regions or similar commodities. By comparing consumption patterns across different markets, traders and producers can identify opportunities or risks and adjust their strategies accordingly.
In essence, retail consumption data is more than just numbers; it’s a narrative of the market. Understanding this narrative is key to making informed decisions in the commodities sector. In a market where consumer trends can rapidly shift, staying abreast of these changes is not just beneficial – it’s essential for success.
5. Navigate Currency Fluctuations in Commodity Trading
Navigating currency fluctuations in commodity trading is like mastering the art of sailing in turbulent seas.
Here’s why it’s so important:
Currency Value Impacts Commodity Prices Changes in currency rates can significantly affect the cost of commodities, especially in global trade.
Risk Management Understanding and anticipating currency trends helps in mitigating financial risks associated with commodity trading.
Competitive Edge Traders who adeptly navigate these fluctuations can gain a competitive advantage in pricing and profitability.
Now, let’s see how this plays out practically:
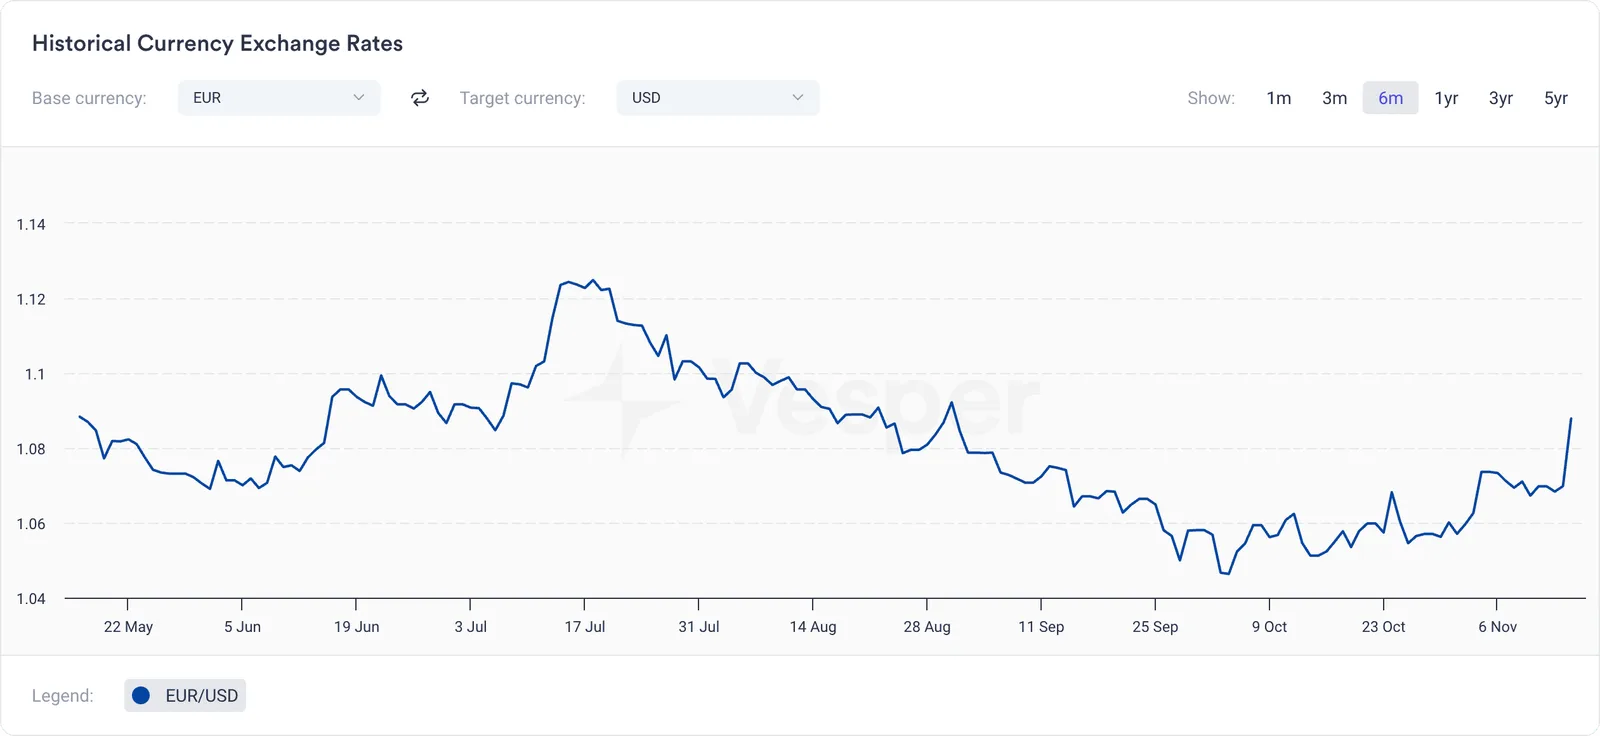
This widget allows you to explore historical currency exchange rates. You can select from a variety of currencies like EUR, USD, CAD, and more, to compare against your base currency.
For instance, you choose EUR as your base and USD as your target. The widget displays the exchange rate trends over a period. This visual representation is not just informative; it’s a strategic tool.
Notice how the EUR/USD rate fluctuates. These fluctuations can be the difference between profit and loss in your commodity transactions. A stronger EUR might mean higher costs for your imported commodities, while a weaker EUR could enhance your export competitiveness.
This tool empowers you to make more informed decisions. You can hedge against risks, plan your buying or selling strategies better, and even decide on the right timing for your transactions.
Moreover, this insight is invaluable for international traders. Currency exchange rates can influence which markets are more favorable for buying or selling, and when to enter or exit these markets.
In summary, navigating currency fluctuations in commodity trading isn’t just about keeping up with exchange rates. It’s about understanding how these rates influence market dynamics, cost structures, and ultimately, your trading decisions. In the dynamic world of commodities, this knowledge is key to staying adaptable and successful.
6. Interpret Production Data for Commodity Insights
Interpreting production data is a game-changer in commodity insights.
Let’s delve into why:
Production Trends Shape Markets Yearly production volumes provide a snapshot of a commodity’s supply dynamics, influencing market prices and availability.
Historical Context Offers Clarity Comparing current production levels with historical data helps in understanding market cycles and trends.
Future Projections Guide Strategies Estimates for upcoming periods are crucial for forecasting market conditions and planning accordingly.
Consider this practical example:
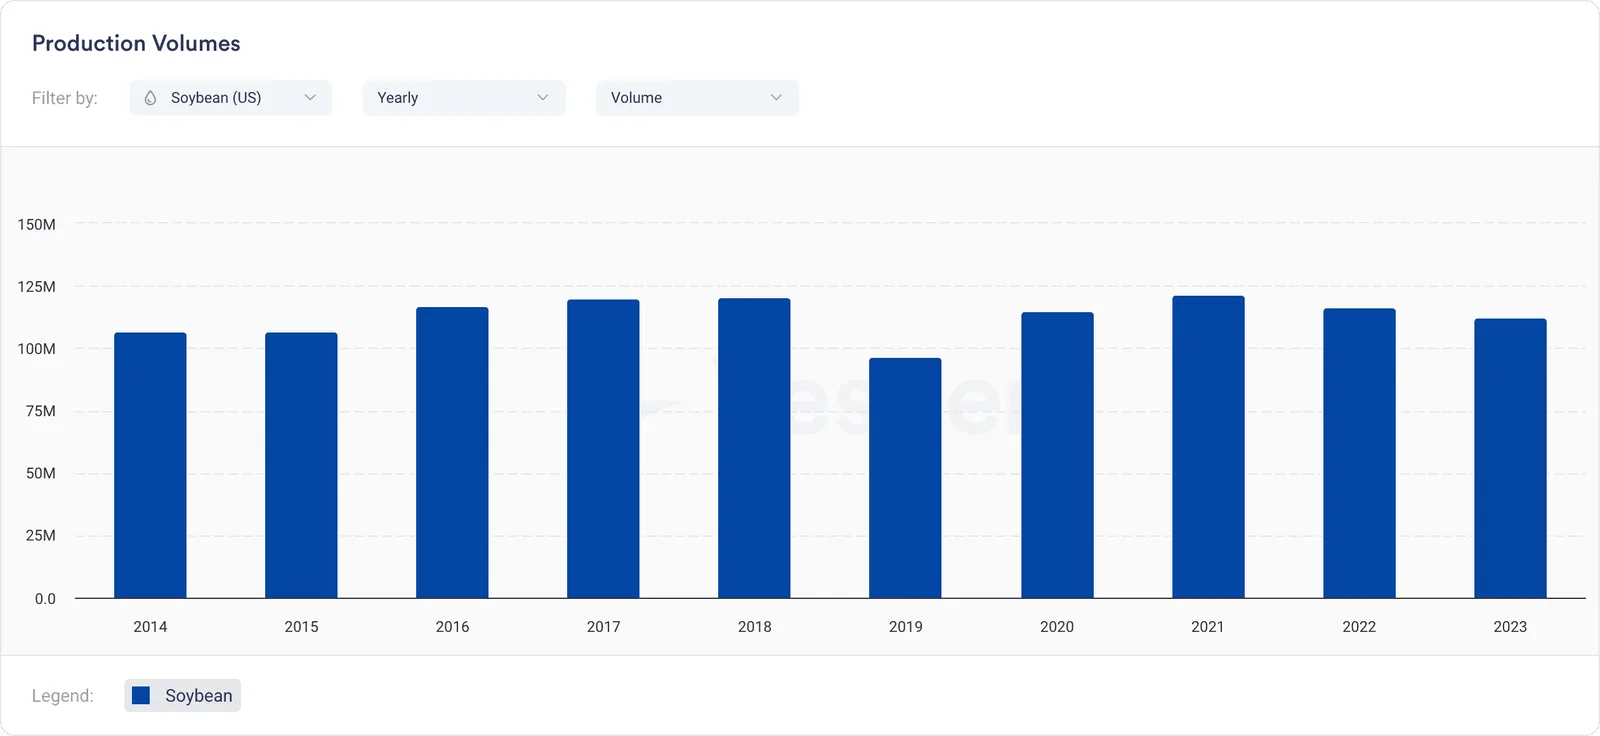
It details yearly production volumes of Ethanol in Brazil over the last decade. A key observation? There’s a slight increase in 2024 – 28 billion liters, up from 26.5 billion in 2023.
But here’s the catch – these levels aren’t as high as the COVID years, 2019 (33 billion) and 2020 (35.5 billion). This isn’t just data; it’s a narrative of market evolution. The rise in 2024 suggests a recovery trend, but still below the peak years.
This widget offers more than just Brazilian ethanol data. You can switch between monthly figures and year-to-date (YTD) data, covering both sugar and ethanol production per country. For the EU, the yearly production data for 2023 are based on EU Commission estimates for the upcoming crop season. The platform even calculates monthly Isoglucose and White Sugar production data for EU-28, with methodologies detailed in their Help & Support section. Remember, all future production data are estimates and subject to change.
Interpreting this data is key. For instance, the rise in ethanol production in 2024 could indicate a strengthening market, potentially impacting global supply and prices. For traders and producers, this insight is invaluable for making informed decisions about buying, selling, or expanding into new markets.
In summary, production data isn’t just numbers on a screen. It’s a lens through which market players can view the past, understand the present, and anticipate the future. In the dynamic world of commodities, such insights are not just helpful – they’re essential for staying competitive and successful.
7. Leverage Supply and Demand Analytics in Commodities
Analyzing supply and demand data in commodities is akin to deciphering a map that reveals where the market’s currents will flow next.
Here’s what it unveils:
Precise Market Pulse This data pinpoints exactly where supply meets demand, highlighting whether a commodity is in surplus or shortage.
Future Price Trajectories It signals upcoming price trends, helping you anticipate whether costs will rise or fall.
Strategic Buying/Selling Points Identifying shifts in supply and demand guides you on when to buy low or sell high.
Now, let’s see this in action.
Consider the following widget:
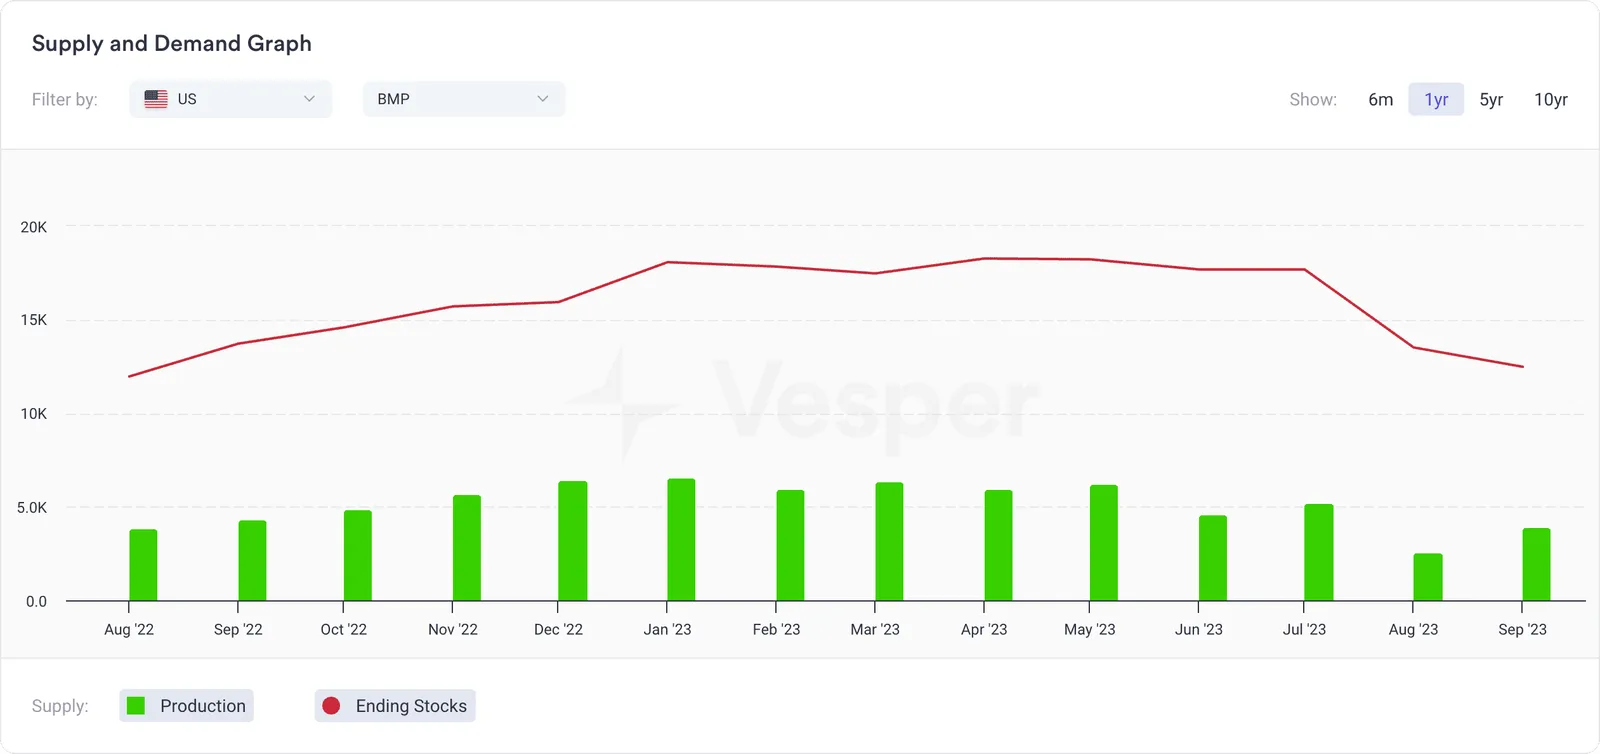
It shows a supply and demand graph for Buttermilk Powder (BMP) in the US, comparing September 2022 and 2023. Production dropped from 4.4 thousand metric tons to 3.9, and ending stocks fell from 13.7 to 12.5.
This isn’t just a chart; it’s a crystal ball into the market’s future. The decline in production and stocks suggests a tightening supply, potentially driving prices up. It’s a direct signal to possibly stock up now before prices climb or, if you’re a producer, to adjust your pricing strategy in anticipation of increased demand.
The Balance Sheet Graph goes beyond just showing figures; it contextualizes the BMP market in the US. It uses robust methodologies, including the USDA’s data and a calculated approach for consumption based on past years, to provide an accurate picture of the market.
In essence, this supply and demand data is your compass in the volatile sea of commodity trading. It not only shows you what’s happening now but also gives you the foresight to navigate future market shifts. For anyone in the commodities game, this insight isn’t just helpful – it’s indispensable for informed decision-making and staying ahead of the curve.
Conclusion
As we come to the end of our exploration of commodity insights, it’s clear that the world of commodities is as complex as it is fascinating.
Each aspect we’ve delved into – be it price benchmarking, market drivers, shipping costs, retail consumption trends, currency fluctuations, production data, or supply and demand analytics – plays a critical role in shaping the landscape of commodity trading.
These insights are not just pieces of information; they are powerful tools that, when wielded with skill and understanding, can lead to informed decisions, strategic foresight, and ultimately, market success.
Whether you are a seasoned trader or new to the field, the knowledge and insights shared in this blog are your allies in the ever-evolving and exciting world of commodities. Remember, in the realm of commodities, knowledge is not just power – it is the key to unlocking potential and paving the path to success.